One of the first things you notice when managing Amazon Ads is that the data doesn’t settle right away. Clicks and costs show up fast, but conversions, sales, and impressions take longer to update. And those are the metrics that drive strategy.
That’s a problem.
Advertisers rely on timely data to make decisions. If you’re managing budgets or evaluating ROAS based on a snapshot that’s still shifting, you could be pausing profitable campaigns or under-crediting what’s actually working.
At Optmyzr, we decided to measure just how delayed Amazon Ads reporting really is. We looked at how much performance data changed over time, how often that change was significant, and what marketers can do to avoid making the wrong call too soon.
Here’s what we found.
What is Data Delay on Amazon ads?
Amazon Ads data delay refers to the lag between when an event (like an ad click or sale) occurs and when it gets fully reported in the Amazon Ads console or API. According to Amazon, it can take up to 14 days for conversion and sales data to settle, while metrics like impressions can also take time to complete.
Why is this important to understand?
Advertisers rely on timely data to:
- Optimize budgets
- Adjust bids
- Evaluate ROAS and profitability
If that data is still in flux, there’s a risk of making decisions based on a faulty snapshot, like turning off a high-performing campaign or under-crediting a successful tactic. For advertisers managing across platforms, Amazon’s delay creates a blind spot that’s easy to overlook but hard to ignore.
What we analyzed in our study
We ran a deep dive analysis using internal platform data from campaigns running on February 10, 2025. We pulled Amazon Ads performance data for that day repeatedly over the next 17 days, assuming the snapshot on February 27 was the most complete.
Our analysis included:
- 302 Amazon Ads accounts
- 14 global marketplaces
- 14,991 campaigns
- 79 unique users
Metrics tracked:
- Impressions
- Clicks
- Cost
- Attributed Conversions (14-day window)
- Attributed Sales (14-day window)
What we learned from the data
The results were eye-opening, especially when you zoom in on the campaigns most affected by Amazon’s reporting delays.
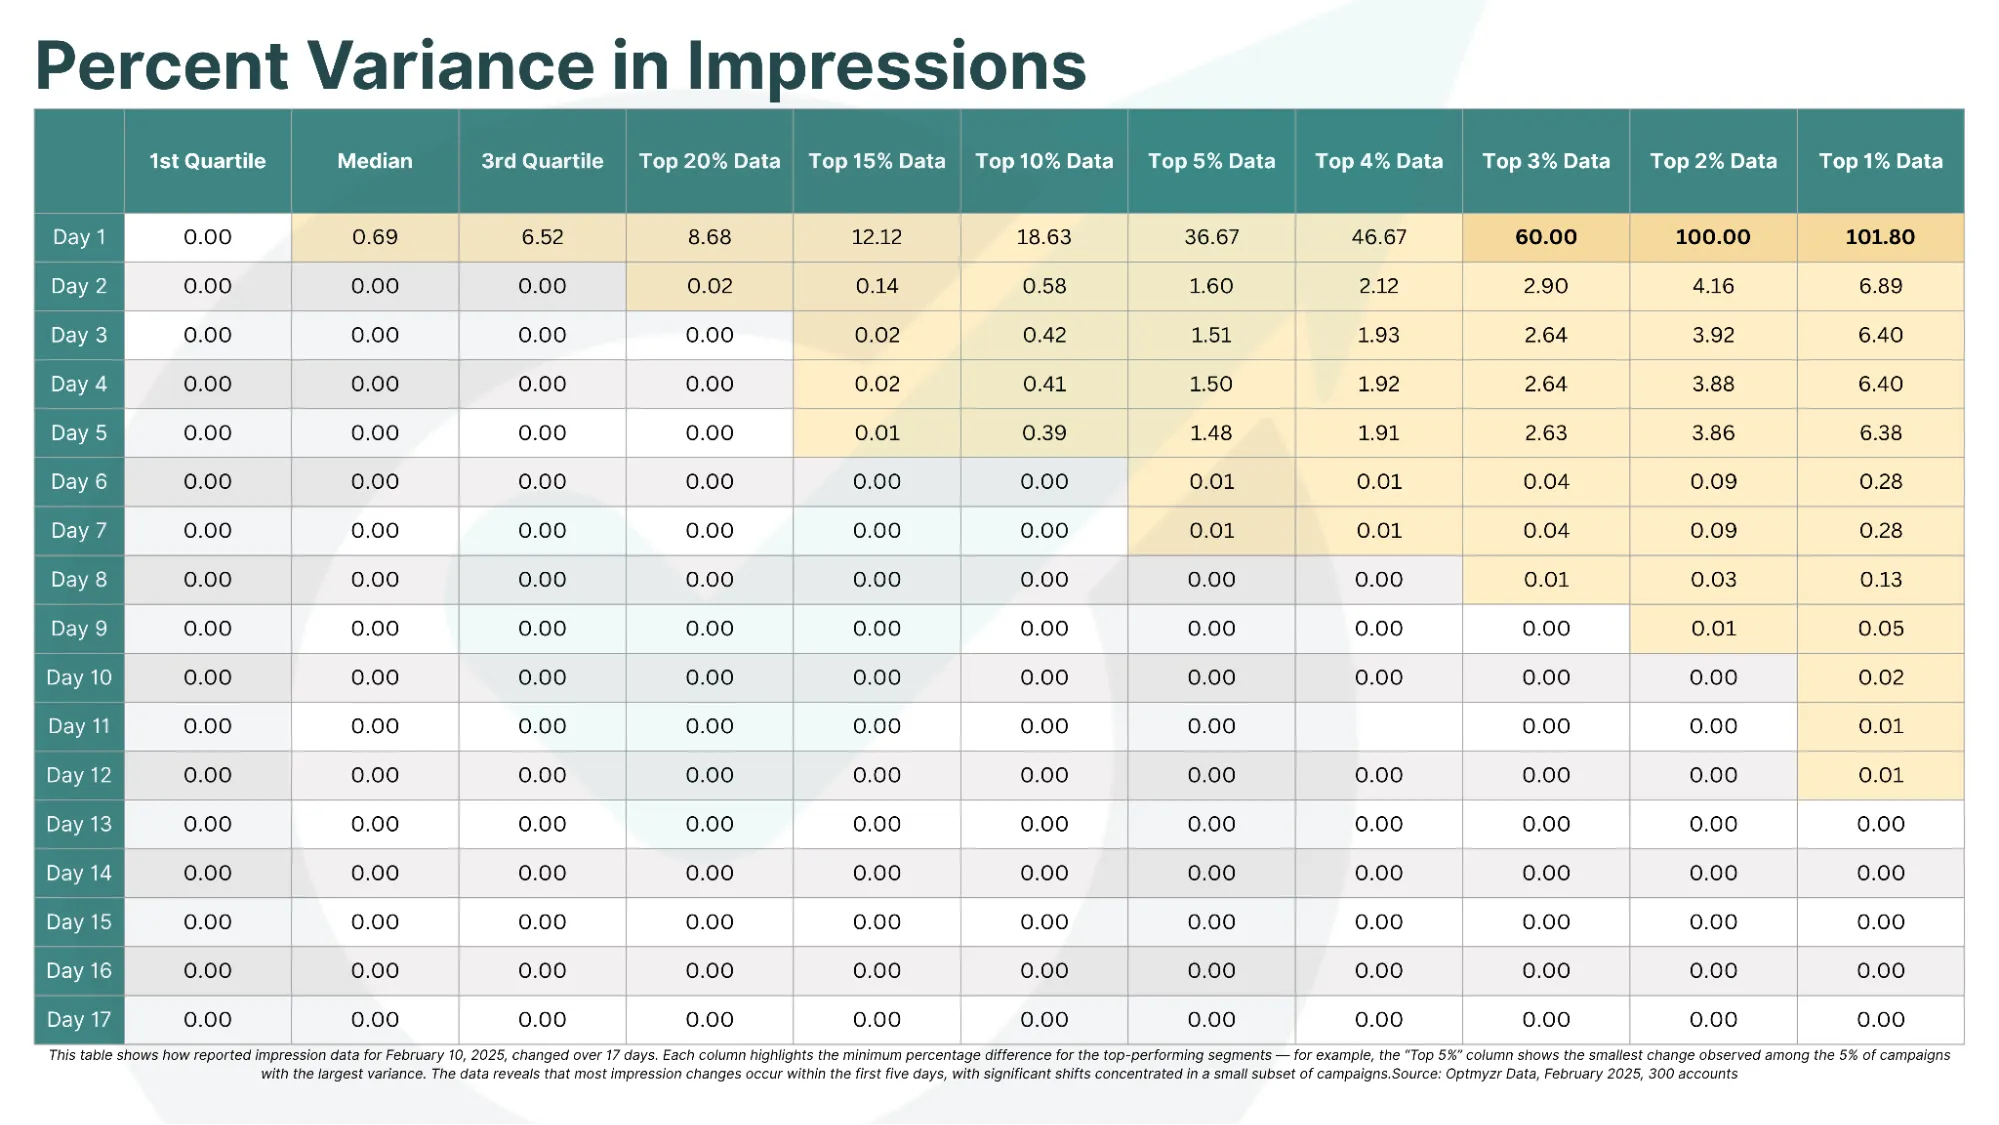
- In the top 5% of campaigns, impression counts changed by at least 36.67% from Day 1 to Day 17. That’s a significant swing in visibility data that could affect everything from pacing to optimization logic.
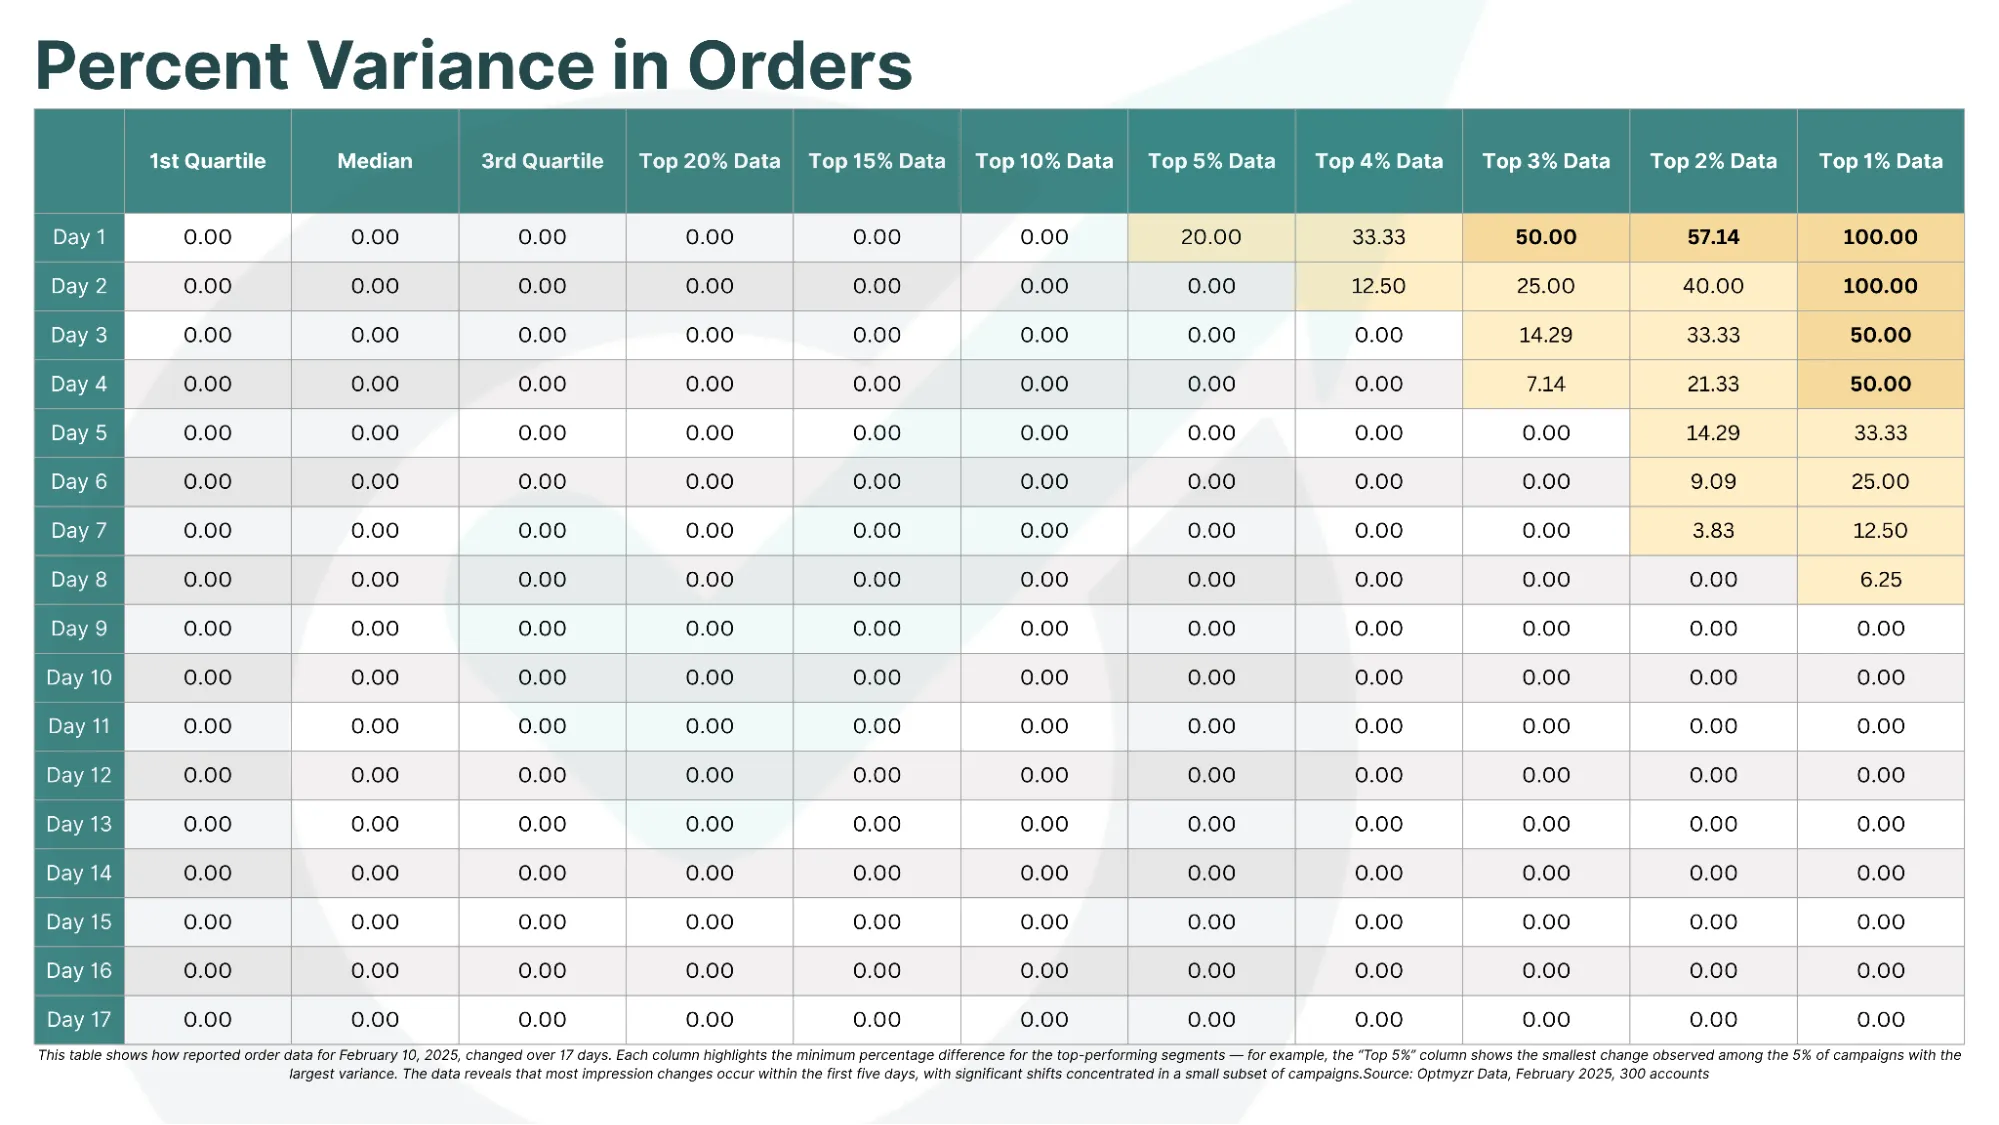
- For attributed sales, the top 5% of campaigns saw their revenue figures grow by at least 18.75% after the initial report. That’s enough to shift decisions about profitability and campaign continuation.
These aren’t fringe anomalies. These are real, measurable discrepancies that occurred in 1 out of every 20 campaigns in our dataset — a meaningful share for any large-scale advertiser.
Not all metrics are equally delayed
A key insight from the study: not every metric is equally delayed.
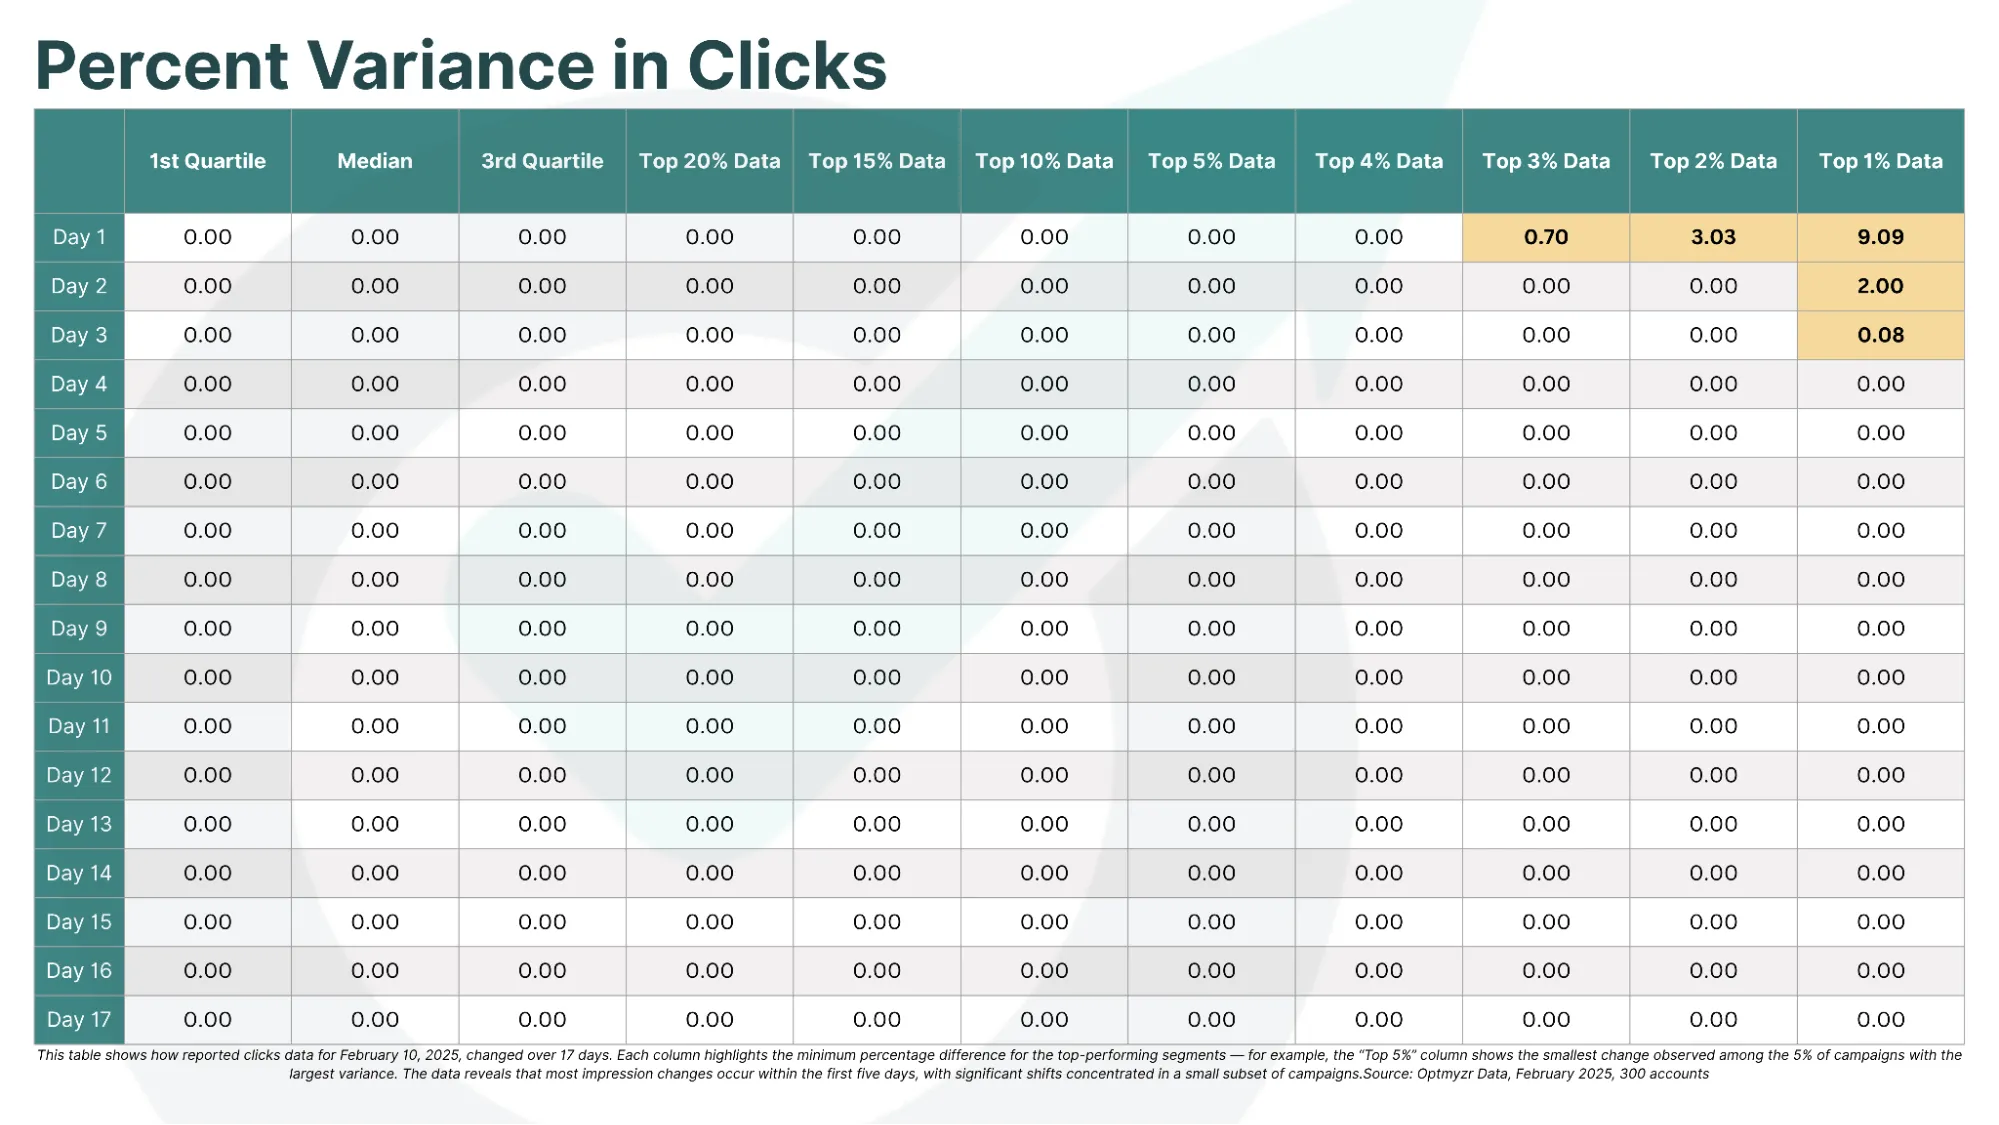
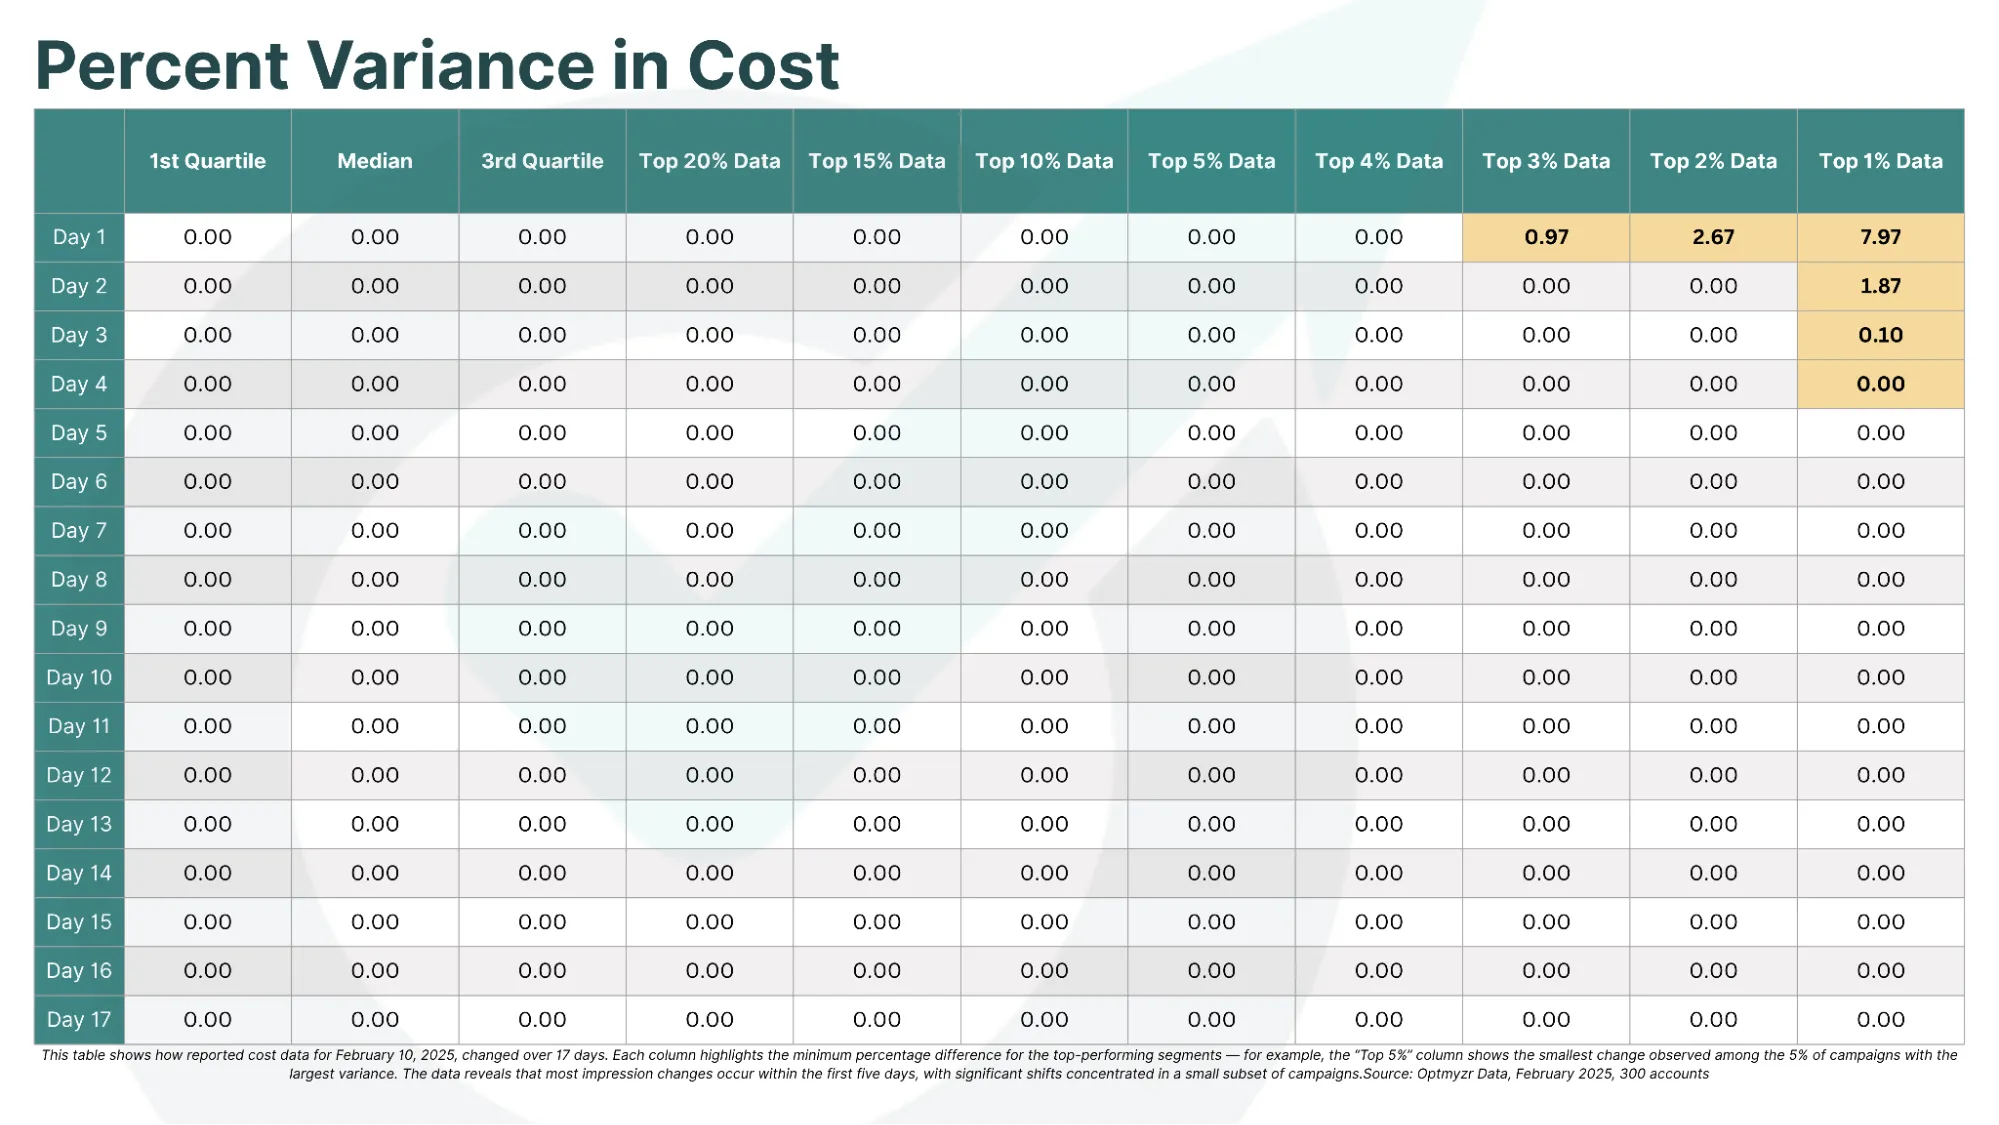
- Clicks and Cost data are reported relatively quickly and are much more stable.
- In contrast, Impressions, Conversions, and Sales take longer to finalize and are more susceptible to change.
For advertisers, this distinction matters:
- You can usually trust spend and click data right away.
- But metrics that reflect your business outcomes (like conversions or sales) require more patience.
Here’s a look at the delays for each of the analyzed metrics. Cells highlighted in yellow reflect delays between this day and the final data on day 17. I will explain below how to interpret the charts in more detail.

How should you interpret the “top X%” data?
You’ll notice we’ve included values like “Top 10%,” “Top 5%,” and “Top 1%” in our metrics. Here’s what those numbers mean:
Let’s take top 10% as an example:
- We measured how much each campaign’s data changed between Day 1 and Day 17.
- Then, we ranked all campaigns by that change.
- The Top 10% includes the campaigns with the biggest changes.
- The value we show is the smallest change within that group, so if your campaign is in the worst 10%, you’ll see at least that level of discrepancy.
This method helps quantify how bad things can get in edge cases, even if the average looks stable.
What can advertisers do based on our findings?
- Be patient with conversion data. Avoid making ROAS decisions in the first 3 days after a campaign runs.
- Educate clients or teams. Not everyone knows Amazon reporting is this delayed. Set expectations.
- Align reporting windows. If you’re generating weekly reports, exclude recent days where data hasn’t stabilized.
- Automate with caution. Don’t train bidding systems or make rules that act on unstable data.
- Flag volatile campaigns. Watch for accounts or products that fall in the top 10% for delayed metrics.
The bottom line
Amazon Ads offers an enormous opportunity, but if you’re making decisions based on yesterday’s data, you could be misjudging performance by 100% or more.
Smart advertisers know that it’s not just about what the data says, but also when it says it. By understanding how long it takes for Amazon Ads data to settle, you’ll avoid premature decisions and unlock better optimization strategies.
Want to run better Amazon Ads with less manual effort? Try Optmyzr free for 14 days today.