On July 23, 2025, Amazon abruptly pulled all its ads from Google shopping. The move disrupted the paid search ecosystem almost overnight. As one of Google’s biggest and savviest advertisers, Amazon’s exit gave us a rare look at what happens when a major player disappears from the auction.
At Optmyzr, we analyzed data from thousands of advertiser accounts to understand the immediate impact. The results challenge a familiar belief: that less competition means better outcomes. They also offer lessons for brands adjusting to sudden market shifts.
Note: How to rebalance budgets and monitor CPC shifts with Amazon exiting Google Shopping Ads
What actually happened
Amazon didn’t wind things down or test a new strategy. They pulled out of Google shopping ads completely and without warning. That created a rare chance to see how Google’s ad auctions respond when a major bidder suddenly vanishes.
In Google’s auction system, advertisers compete in real-time for ad placements based on their bids, ad quality, and expected impact. When a major player like Amazon exits, they don’t just free up a few ad slots. Their absence reshapes the competitive landscape across every keyword, audience, and placement they used to touch.
Our analysis methodology
To isolate the true impact of Amazon’s departure from seasonal effects, we used a precise 7-day comparison methodology with the strictest account matching criteria:
Study period: July 16-22, 2025 vs July 23-29, 2025
Why this matters: We skipped Prime Day (July 8–11) and balanced the weekdays across both weeks.
Dataset: Perfect account matching with identical advertiser pools in both periods
Requirements:
- Accounts must have 3+ days overall in both periods
- Accounts must appear in the same shopping ads category in both periods
- Accounts must have 3+ days within that category in both periods
This clean comparison lets us tie changes to Amazon’s exit rather than promotional calendar effects, day-of-week variations, or account churn.
Caveats: Conversion lag in ecommerce
Some ecommerce categories have longer paths to purchase. This means part of the conversion value may not have shown up in our initial 7-day window. A lower observed conversion value doesn’t always mean poor performance — it might just reflect a time lag.
To account for this, we’ll re-run the study using the same time window but pull data 30 days later. That way, we can measure any additional revenue that accrues over time and ensure the findings reflect true long-term performance.
Overall market impact: More volume, less value
The data tells a surprising story: less competition doesn’t always help the advertisers left behind.
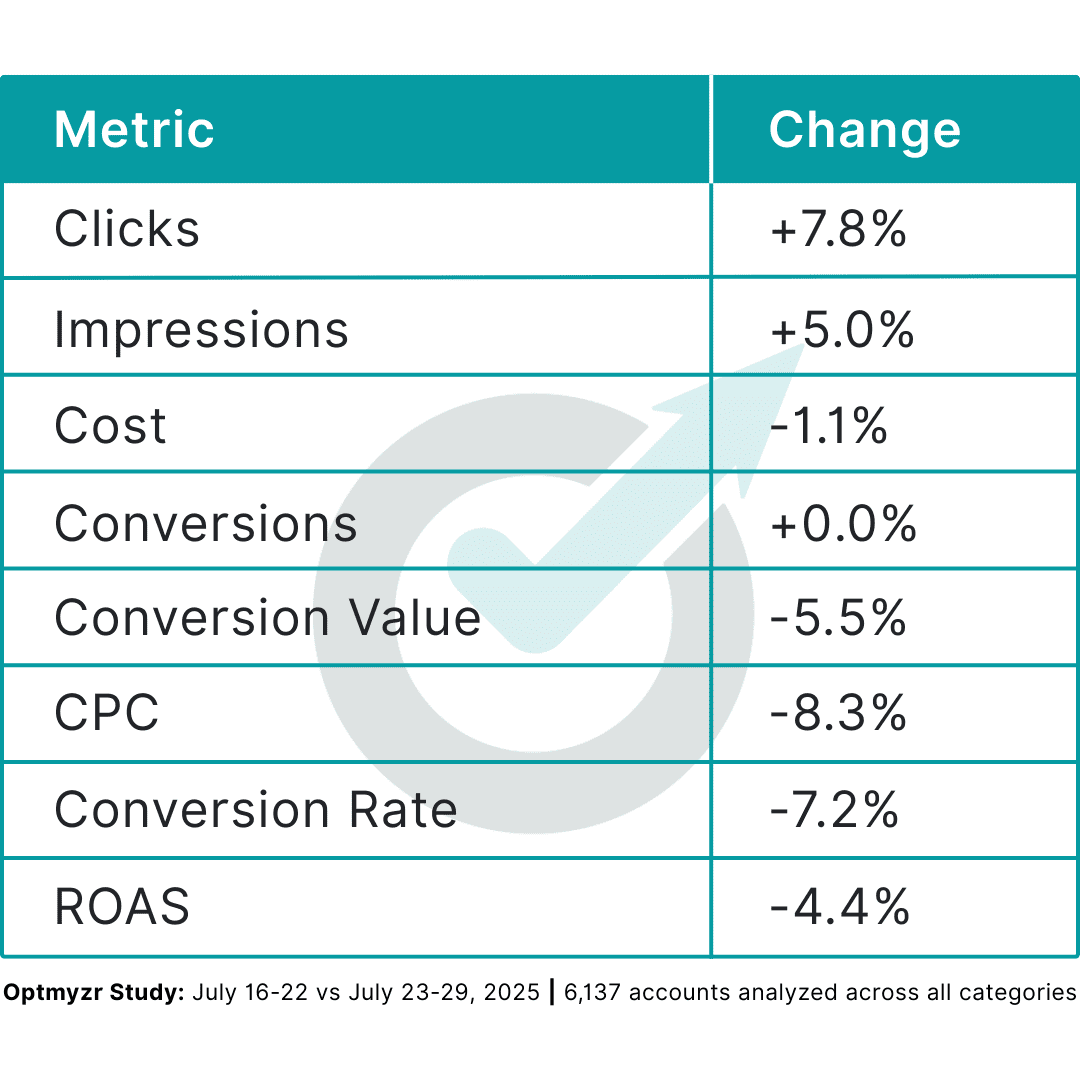
Key Insight: Advertisers got more clicks for less money, but the value of those clicks dropped. It suggests many of those extra clicks came from people looking for Amazon. When they landed on competitor ads, they brought expectations around price, shipping, and convenience that few brands could match.
The consumer expectation trap
The standout insight: volume went up, but value went down. Advertisers saw:
- 8.3% lower CPCs — looks good on the surface
- 7.8% more clicks — more traffic, more chances
- 5.5% drop in conversion value — less revenue from that extra traffic
The pattern points to buyer behavior. Shoppers looking for Amazon clicked elsewhere, but still expected Amazon-level pricing, speed, and ease. When competitors couldn’t match these expectations, conversion rates and values suffered.
For PPC managers, this highlights the danger of the “volume trap”—celebrating increased traffic without considering whether that traffic genuinely aligns with your value proposition.
Category-by-category breakdown: Winners and losers
The impact varied dramatically across different industry verticals, revealing which types of businesses were best positioned to capitalize on Amazon’s departure.
Electronics: The clear winner
Electronics brands were best positioned to gain from Amazon’s exit. Big players like Best Buy and Apple can compete on the same things Amazon excels at: fast delivery, strong pricing, and trusted fulfillment.
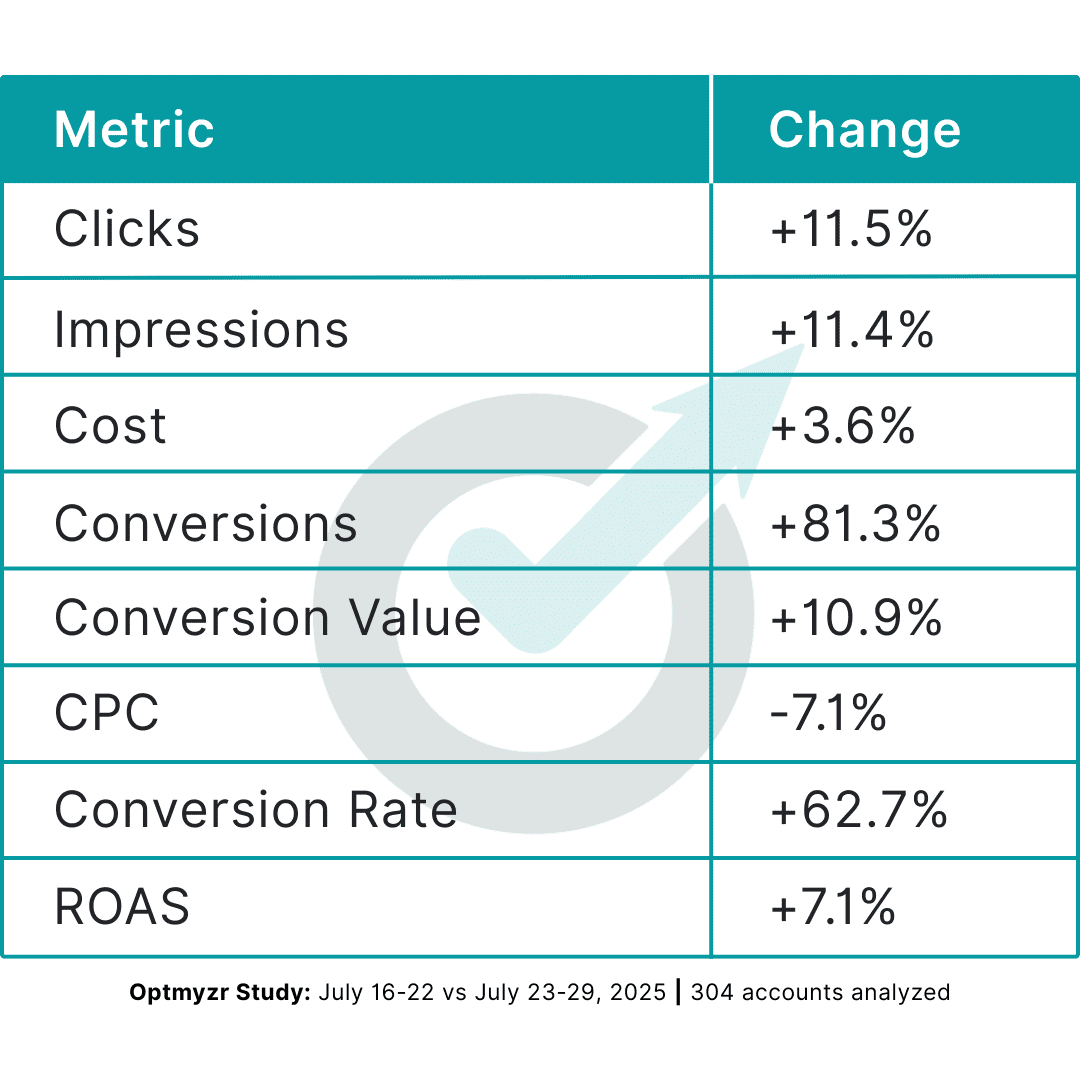
Electronics was the only major category to see increases across all key value metrics: conversions (+81.3%), conversion value (+10.9%), and ROAS (+7.1%).
Despite a moderate increase in impressions (+11.4%) and clicks (+11.5%), these advertisers successfully converted the Amazon-displaced traffic at higher rates and values, likely because they could satisfy consumers’ expectations for fast, convenient delivery and competitive pricing.
Home & Garden: The volume puzzle
Home & Garden presents an interesting case study in the volume trap phenomenon, with significant traffic increases but declining value metrics.
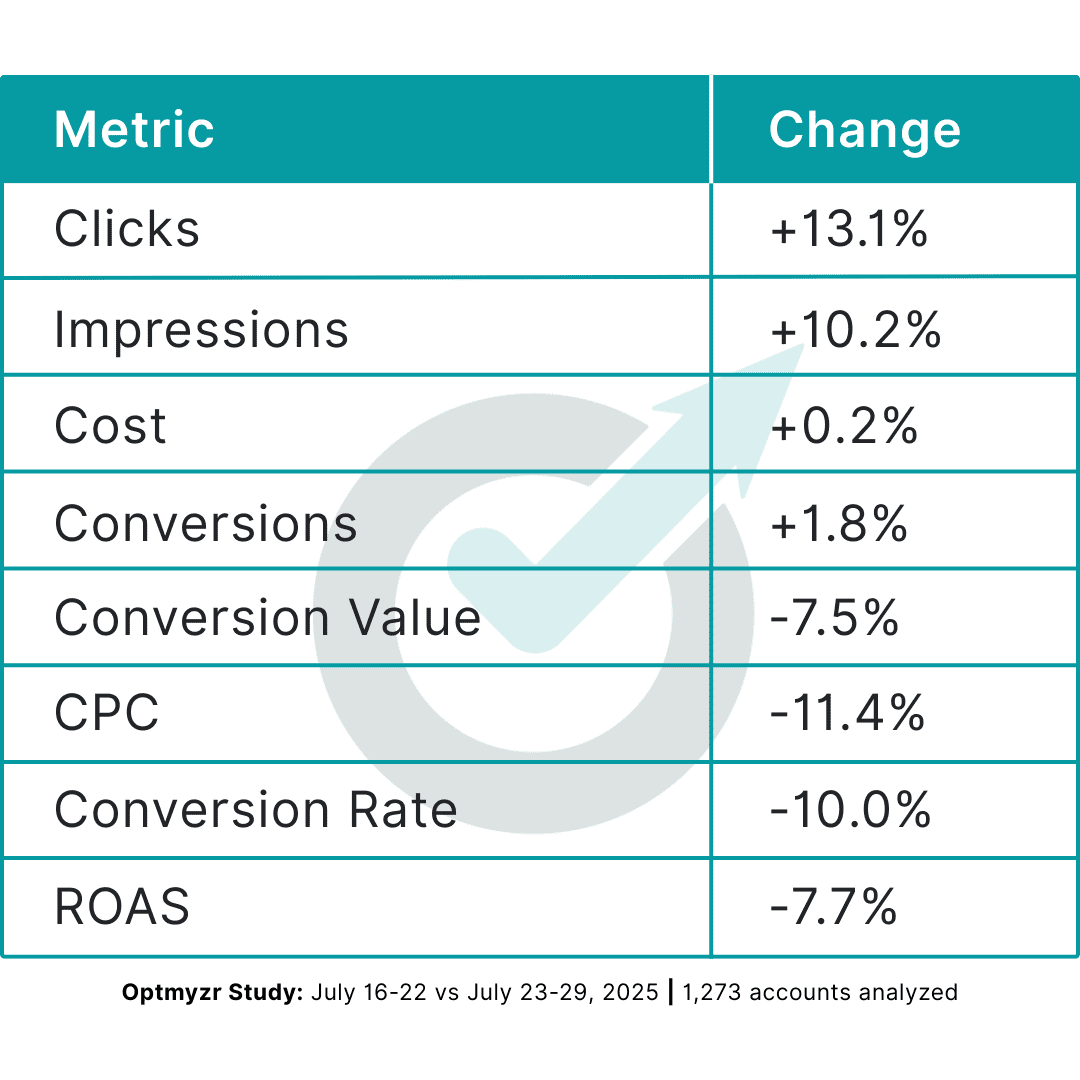
The pattern—significant click growth (+13.1%) and stable cost (+0.2%) but declining conversion value (-7.5%) and ROAS (-7.7%)—suggests Amazon-seeking consumers found home & garden alternatives but made lower-value purchases or were more price-sensitive than typical customers.
Sporting Goods: The volume trap exemplified
Sporting Goods represents perhaps the clearest example of the “volume trap” phenomenon we’ve been describing.
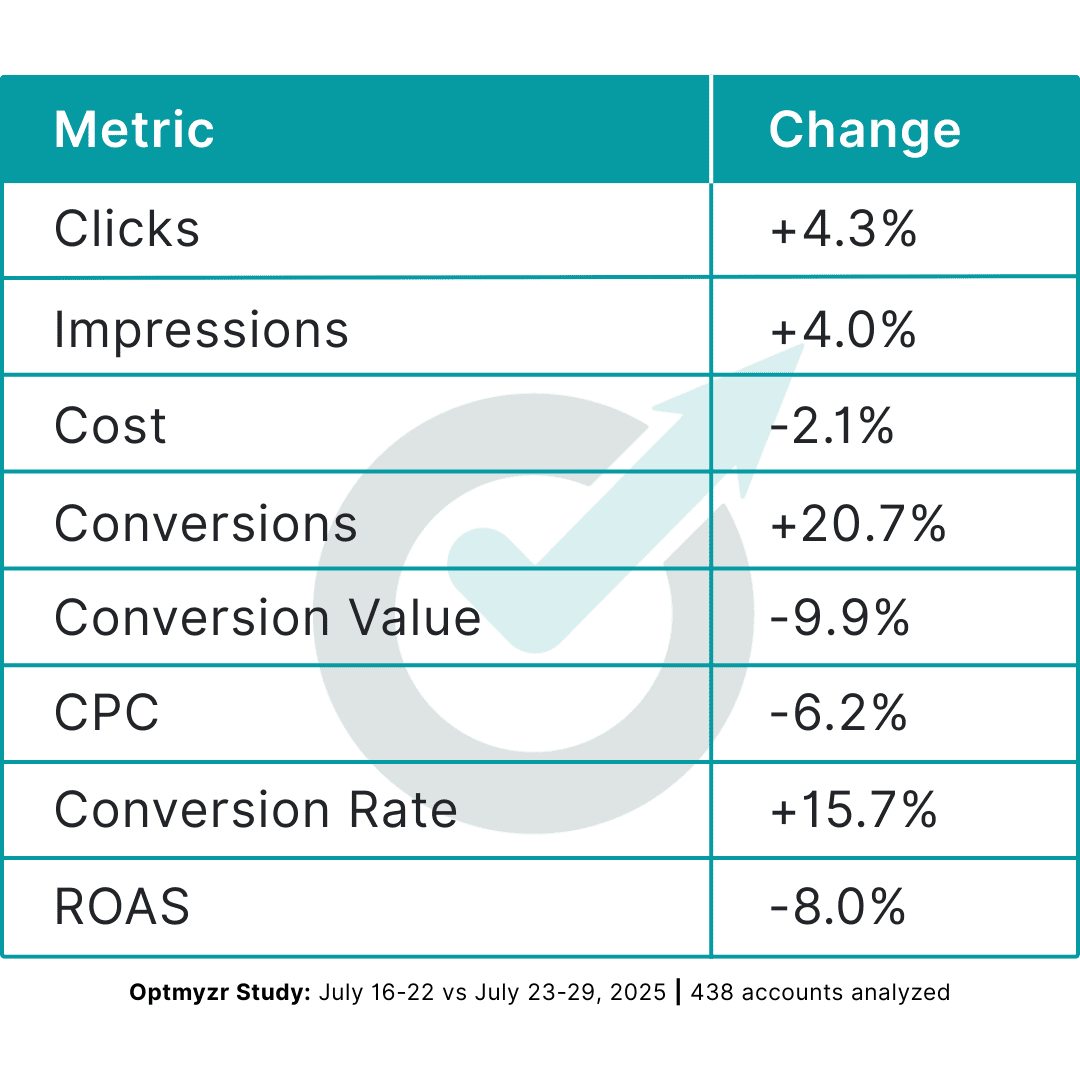
This category saw substantial conversion volume increases (+20.7%) and improved conversion rates (+15.7%) with minimal traffic growth (+4.3% clicks), yet experienced significant value decline (-9.9%) and ROAS deterioration (-8.0%).
Likely explanation: shoppers landed on competitor sites, but bought cheaper gear or held back due to price.
Health & Beauty: Stable volume, flat value
Health & Beauty brands picked up the extra traffic, but couldn’t hold onto revenue per sale.
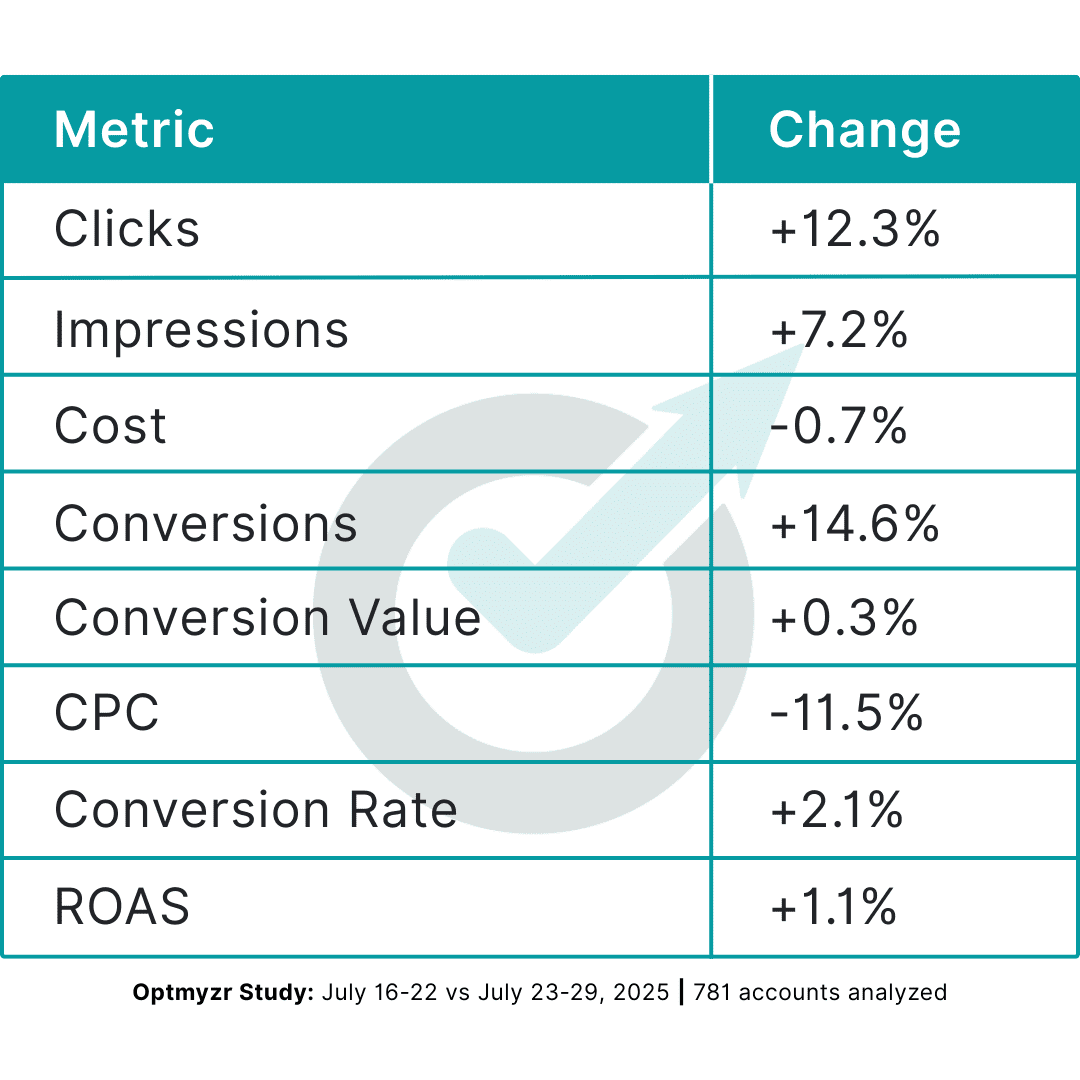
Despite achieving 14.6% more conversions from Amazon-displaced traffic, conversion value remained essentially flat (+0.3%). Translation: those new conversions were worth a lot less than usual. If quality stayed the same, revenue should have risen in lockstep. But thanks to new clicks being cheaper (-11.5%), ROAS slightly rose (+1.1%).
Tools and Hardware: Similar consumer expectation challenges
Tools and Hardware followed the same pattern as Sporting Goods — more conversions, but lower value.
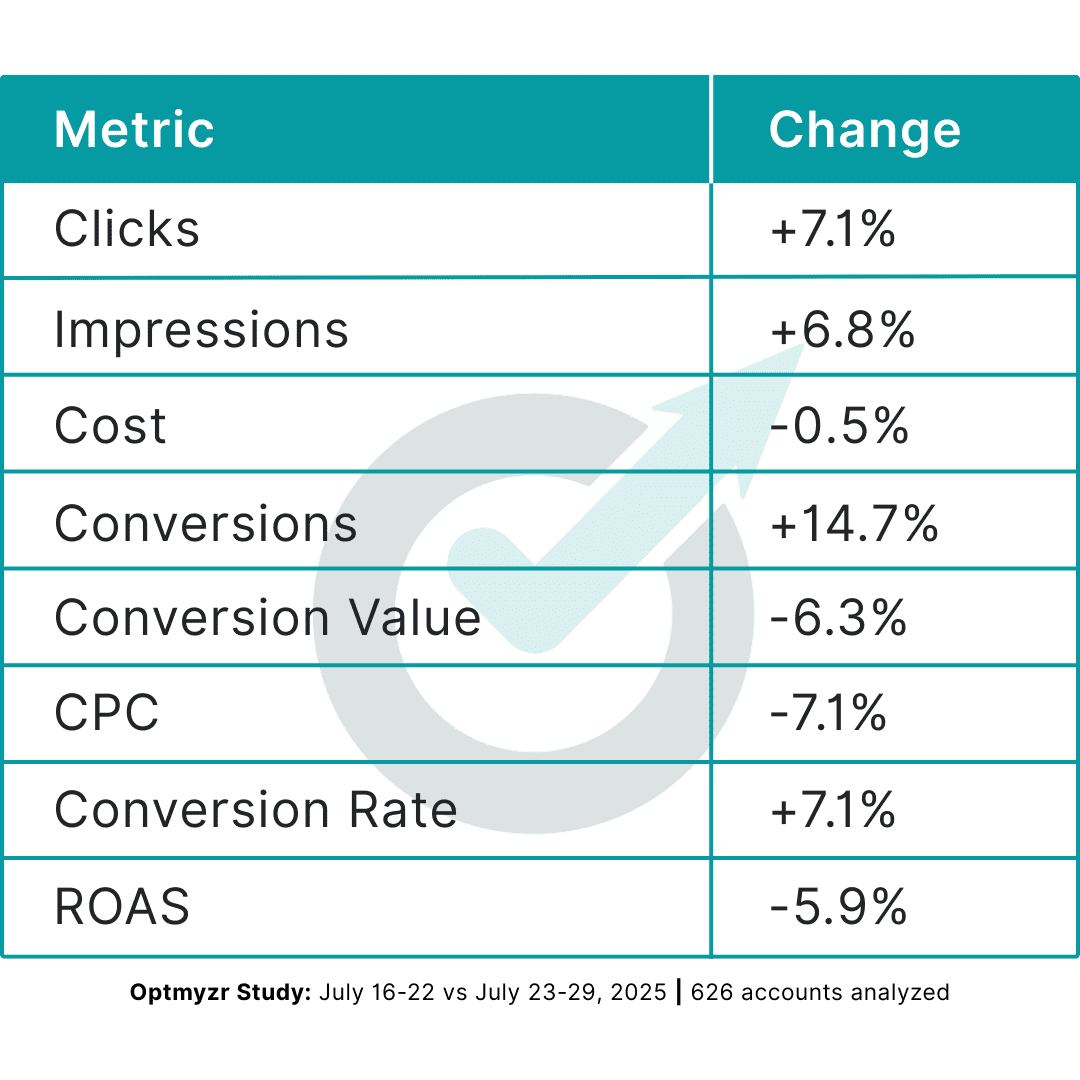
Like Sporting Goods, this category captured significantly more Amazon-displaced conversions (+14.7%) with improved conversion rates (+7.1%) but struggled to extract the same value per conversion (-6.3% value, -5.9% ROAS), likely due to consumer expectations around pricing and convenience that Amazon had established.
Vehicles & Parts: High-value category decline
Vehicles & Parts showed concerning trends across both volume and value metrics.
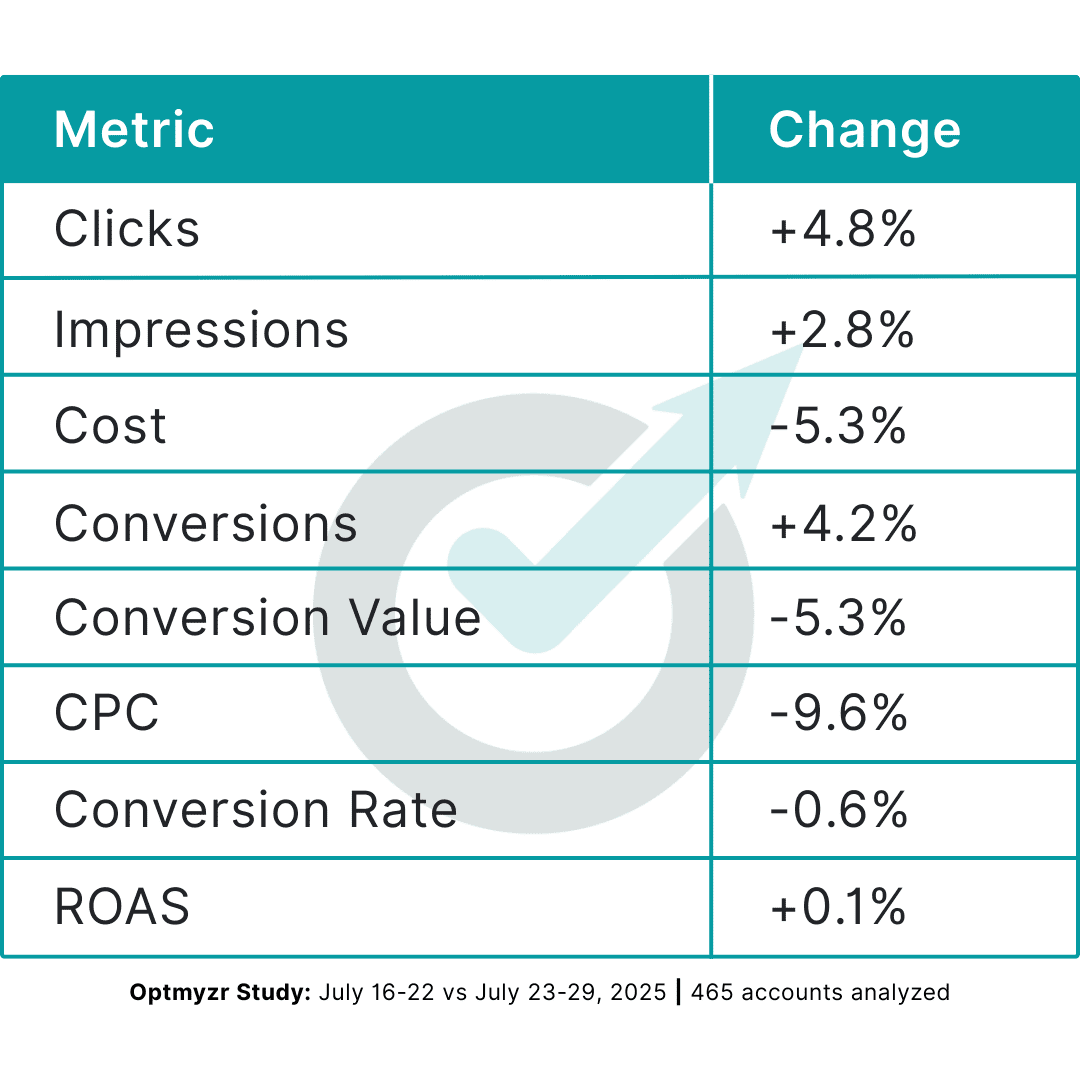
Despite modest click growth (+4.8%) and reduced costs (-5.3%), the category experienced declining conversion value (-5.3%), suggesting that Amazon-seeking consumers in this category had different purchase behaviors or price expectations. But like Health & Beauty, the reduction in CPC (-9.6%) helped protect the ROAS (+0.1%)
Apparel & Accessories: Large volume, declining value
As the largest category by volume, Apparel & Accessories demonstrates the volume trap at scale.
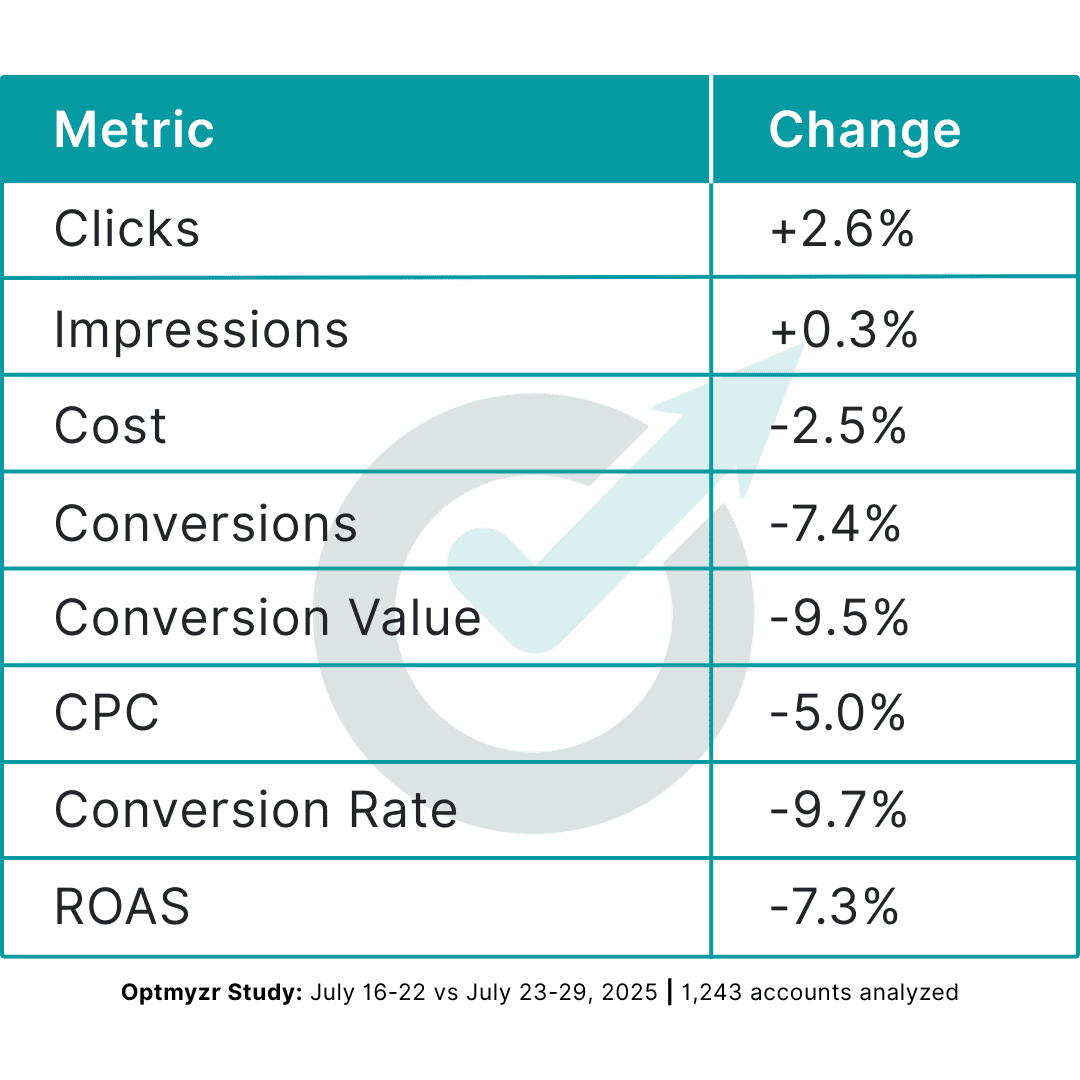
Despite representing the largest volume of traffic, Apparel & Accessories saw declining performance across key metrics, with conversion value dropping 9.5% and ROAS declining 7.3%. This suggests that Amazon-seeking fashion consumers had strong expectations around pricing, selection, and return policies that competitors struggled to match.
Arts & Entertainment: The content value challenge
Arts & Entertainment showed mixed results, with increased traffic but declining conversion metrics.
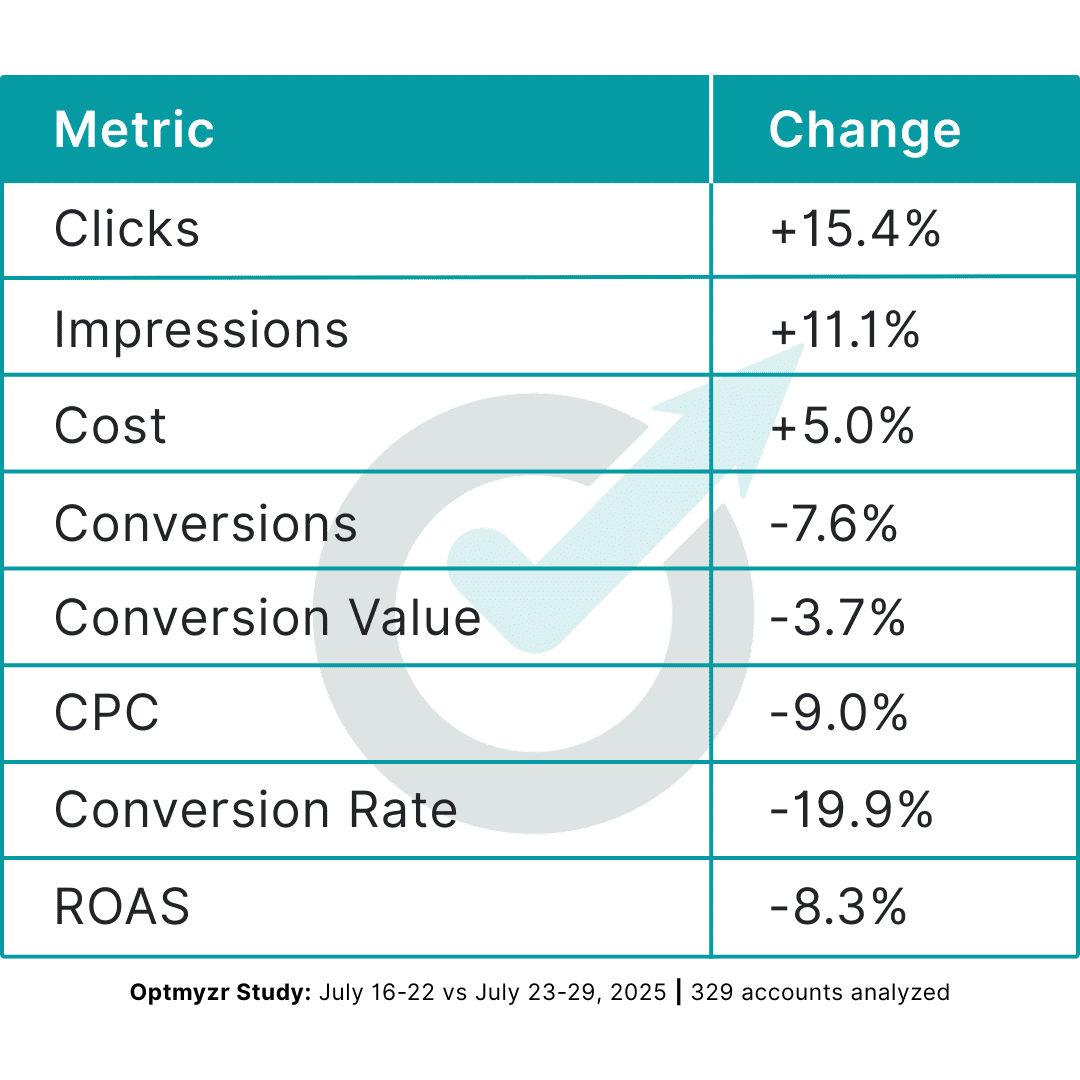
This category achieved significant click growth (+15.4%) but saw concerning declines in conversion rate (-19.9%) and ROAS (-8.3%), suggesting that displaced Amazon traffic in entertainment categories had different engagement patterns or value expectations.
Furniture: Stable volume, value concerns
Furniture presents an interesting anomaly with stable click volume but declining conversion value.
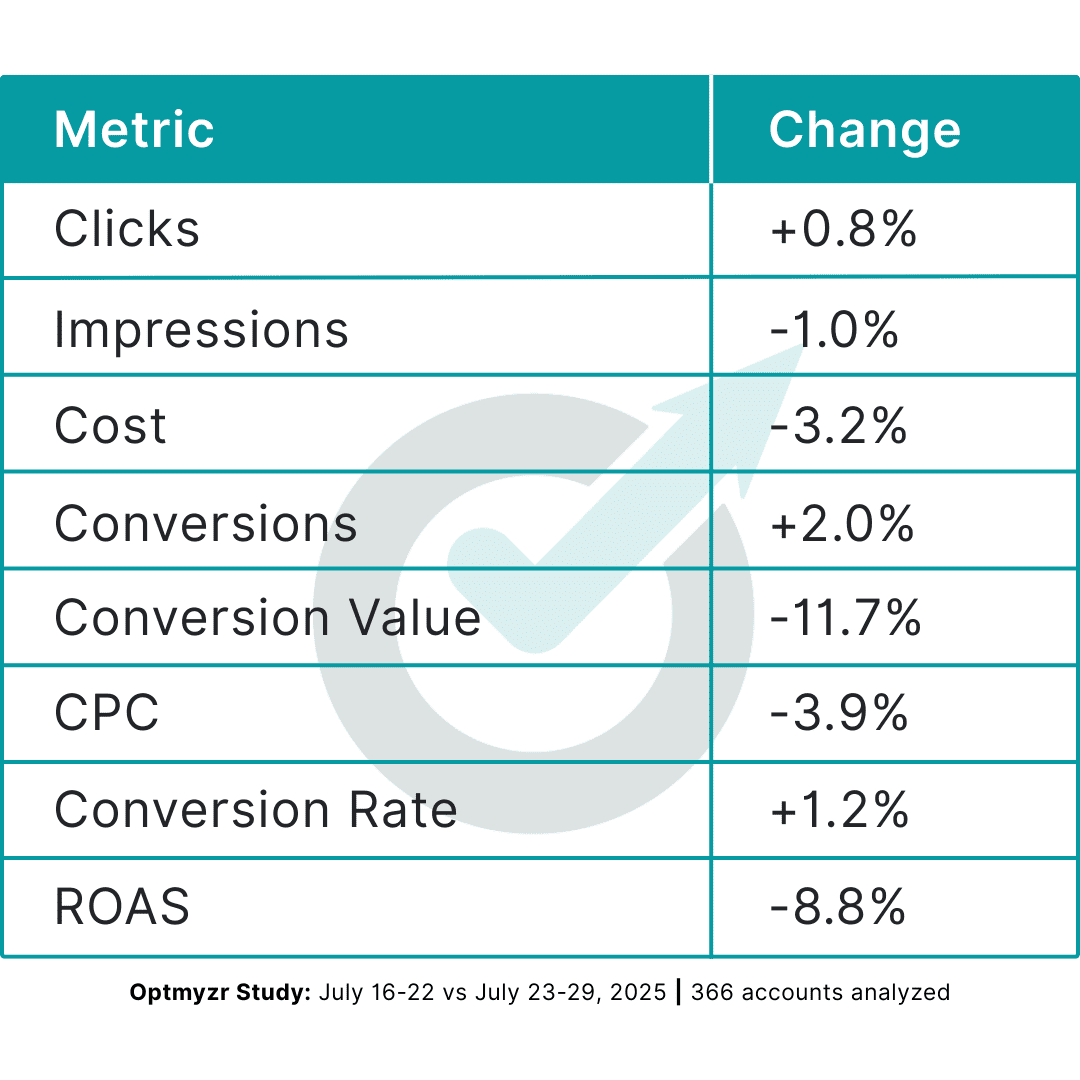
The pattern—stable clicks (+0.8%) and conversion volume (+2.0%) but dramatically lower conversion value (-11.7%) and ROAS (-8.8%)—suggests a fundamental shift in purchase behavior. Despite reduced costs, the significant value decline indicates consumers may have been purchasing lower-priced items or single pieces rather than complete furniture sets.
What this means for your Google Ads strategy
Different categories reacted in different ways — but the patterns offer clear takeaways for PPC teams:
1. Assess your competitive position against Amazon’s value proposition
Electronics succeeded because major players like Best Buy and Apple can match Amazon’s delivery speed and pricing. In contrast, most other categories saw the classic “volume trap”—more traffic but less value as Amazon-seeking consumers brought different expectations.
2. Recognize the volume trap early
Categories like Sporting Goods (+20.7% conversions, -9.9% value) and Health & Beauty (+14.6% conversions, +0.3% value) show how increased traffic can mask underlying performance degradation. Always track value, not just volume.
3. Learn from true success vs. volume traps
Only Electronics truly succeeded with positive conversion value (+10.9%) and ROAS growth (+7.1%). Everyone else hit some version of the volume trap — more clicks, but less to show for it.
4. Understand your category’s vulnerability
If you compete on Amazon’s turf — price, speed, convenience — you’re more exposed. The data shows widespread expectation mismatches across these categories.
5. Focus on sustainable competitive advantages
Rather than simply trying to capture displaced Amazon traffic, develop positioning that attracts consumers who genuinely value your specific offerings.
Why displaced traffic isn’t free traffic
Amazon’s exit highlights something critical: traffic doesn’t shift cleanly when a dominant player leaves. It drags along expectations most brands can’t meet — fast shipping, low prices, and frictionless buying.
That creates the volume trap: cheaper clicks, more traffic, and worse results. Unless you can actually match Amazon’s offer, you’ll struggle to turn those clicks into value.
For the Google Ads ecosystem, this suggests that major ecommerce advertisers play a crucial role not just in competing for inventory, but in training and conditioning consumer expectations. When they leave, shoppers don’t reset. They carry their shaped expectations into your funnel, whether you can meet them or not.
Takeaways for PPC advertisers
What PPC managers should take from all this:
Distinguish true success from volume traps
Only Electronics achieved both volume and value growth. Most categories experienced some form of the volume trap with declining efficiency.
Monitor ROAS alongside conversion metrics
Flat or growing conversion volume can hide declining profitability if conversion values decline or costs increase.
Evaluate displaced traffic quality
Amazon-seeking consumers bring specific expectations that most categories couldn’t meet profitably, leading to either lower conversion values or conversion rate declines.
Consider lifetime value implications
The only justification for accepting lower immediate ROAS is if the additional traffic represents new customers with strong repeat purchase potential.
Focus on sustainable differentiation
The successful Electronics category could match Amazon’s value proposition, while others struggled when competing on Amazon’s core strengths.
Displaced traffic isn’t neutral — it’s shaped by the brand that left. And unless you can meet those expectations or grow LTV fast, it’s traffic you’ll struggle to monetize.


