Reporting is a big part of the job for PPC marketers, but it often turns into a time-consuming headache—especially when working with multiple clients and ad platforms.
Native tools rarely cut it once you’re working across platforms. Looker Studio usually needs heavy customization, and Google Analytics isn’t built for PPC-specific deep dives.
So, you need a reporting tool that saves time, pulls data from all your ad platforms, and—most importantly—helps you explain what actually changed. In this guide, we’ve rounded up PPC reporting tools that go beyond charts and dashboards, and help you make sense of performance when clients or stakeholders start asking questions.
But first, what should you look for in a PPC reporting tool?
Before comparing tools, it helps to know what actually matters once you start using them day to day. These are the things that tend to break—or slow teams down—as reporting gets more complex.
What to evaluate | Why it matters in practice |
|---|---|
Data reliability | You need to be able to pull the right data every time, even as spend, accounts, or platforms scale. Missing or delayed numbers quickly erode trust. |
Core reporting capabilities | Dashboards, scheduled reports, and ad-hoc analysis should be easy to build and adjust when performance changes unexpectedly. |
Ease of use | If only one person on the team understands the setup, reporting becomes a bottleneck instead of a time-saver. |
Customization & flexibility | Clients, internal teams, and executives don’t need the same views. Reports should adapt without being rebuilt from scratch. |
Setup & integrations | Long setup times or fragile integrations slow adoption and often lead teams back to manual reporting. |
Scalability | A tool that works for five accounts should still hold up at fifty—without breaking workflows or performance. |
Data security & access control | Especially important when sharing reports externally or managing multiple clients with different access needs. |
Keeping these factors in mind, let’s look at some of the best PPC reporting tools available today.
Best PPC reporting tools
Name of the Tool | Top Feature | Pricing |
|---|---|---|
Optmyzr | Drag-and-drop reporting with pre-built widgets, cross-platform data integration, and automated scheduling | From $209/month for $25K spend, up to 25 accounts |
Skai | Unified platform for managing PPC campaigns across various channels | From $114,000/year |
DashThis | Easy-to-use and attractive dashboard tool to stop wasting time gathering data | From $49/month |
ReportGarden | Automate cross-channel reporting, manage campaign budgets, and create invoices | From $89/month |
Supermetrics | Move data from various sources to preferred reporting, analytics, or storage platform | Pricing is platform-specific |
Databox | Pulls all your data into one place to track performance and discover insights in real-time | From $199/month |
Whatagraph | Automatically collects data from multiple channels and creates visual reports | From $249/month |
Swydo | Create, schedule, and share reports for your marketing campaigns | From $69/month |
Optmyzr
Best for: PPC agencies and in-house teams that want reporting to sit alongside optimization and monitoring workflows, not operate as a standalone dashboard.
Pricing: From $209/month ($25K spend, upto 25 accounts)
Rating: Rated 4.6/5 on G2 and 4.6/5 Capterra
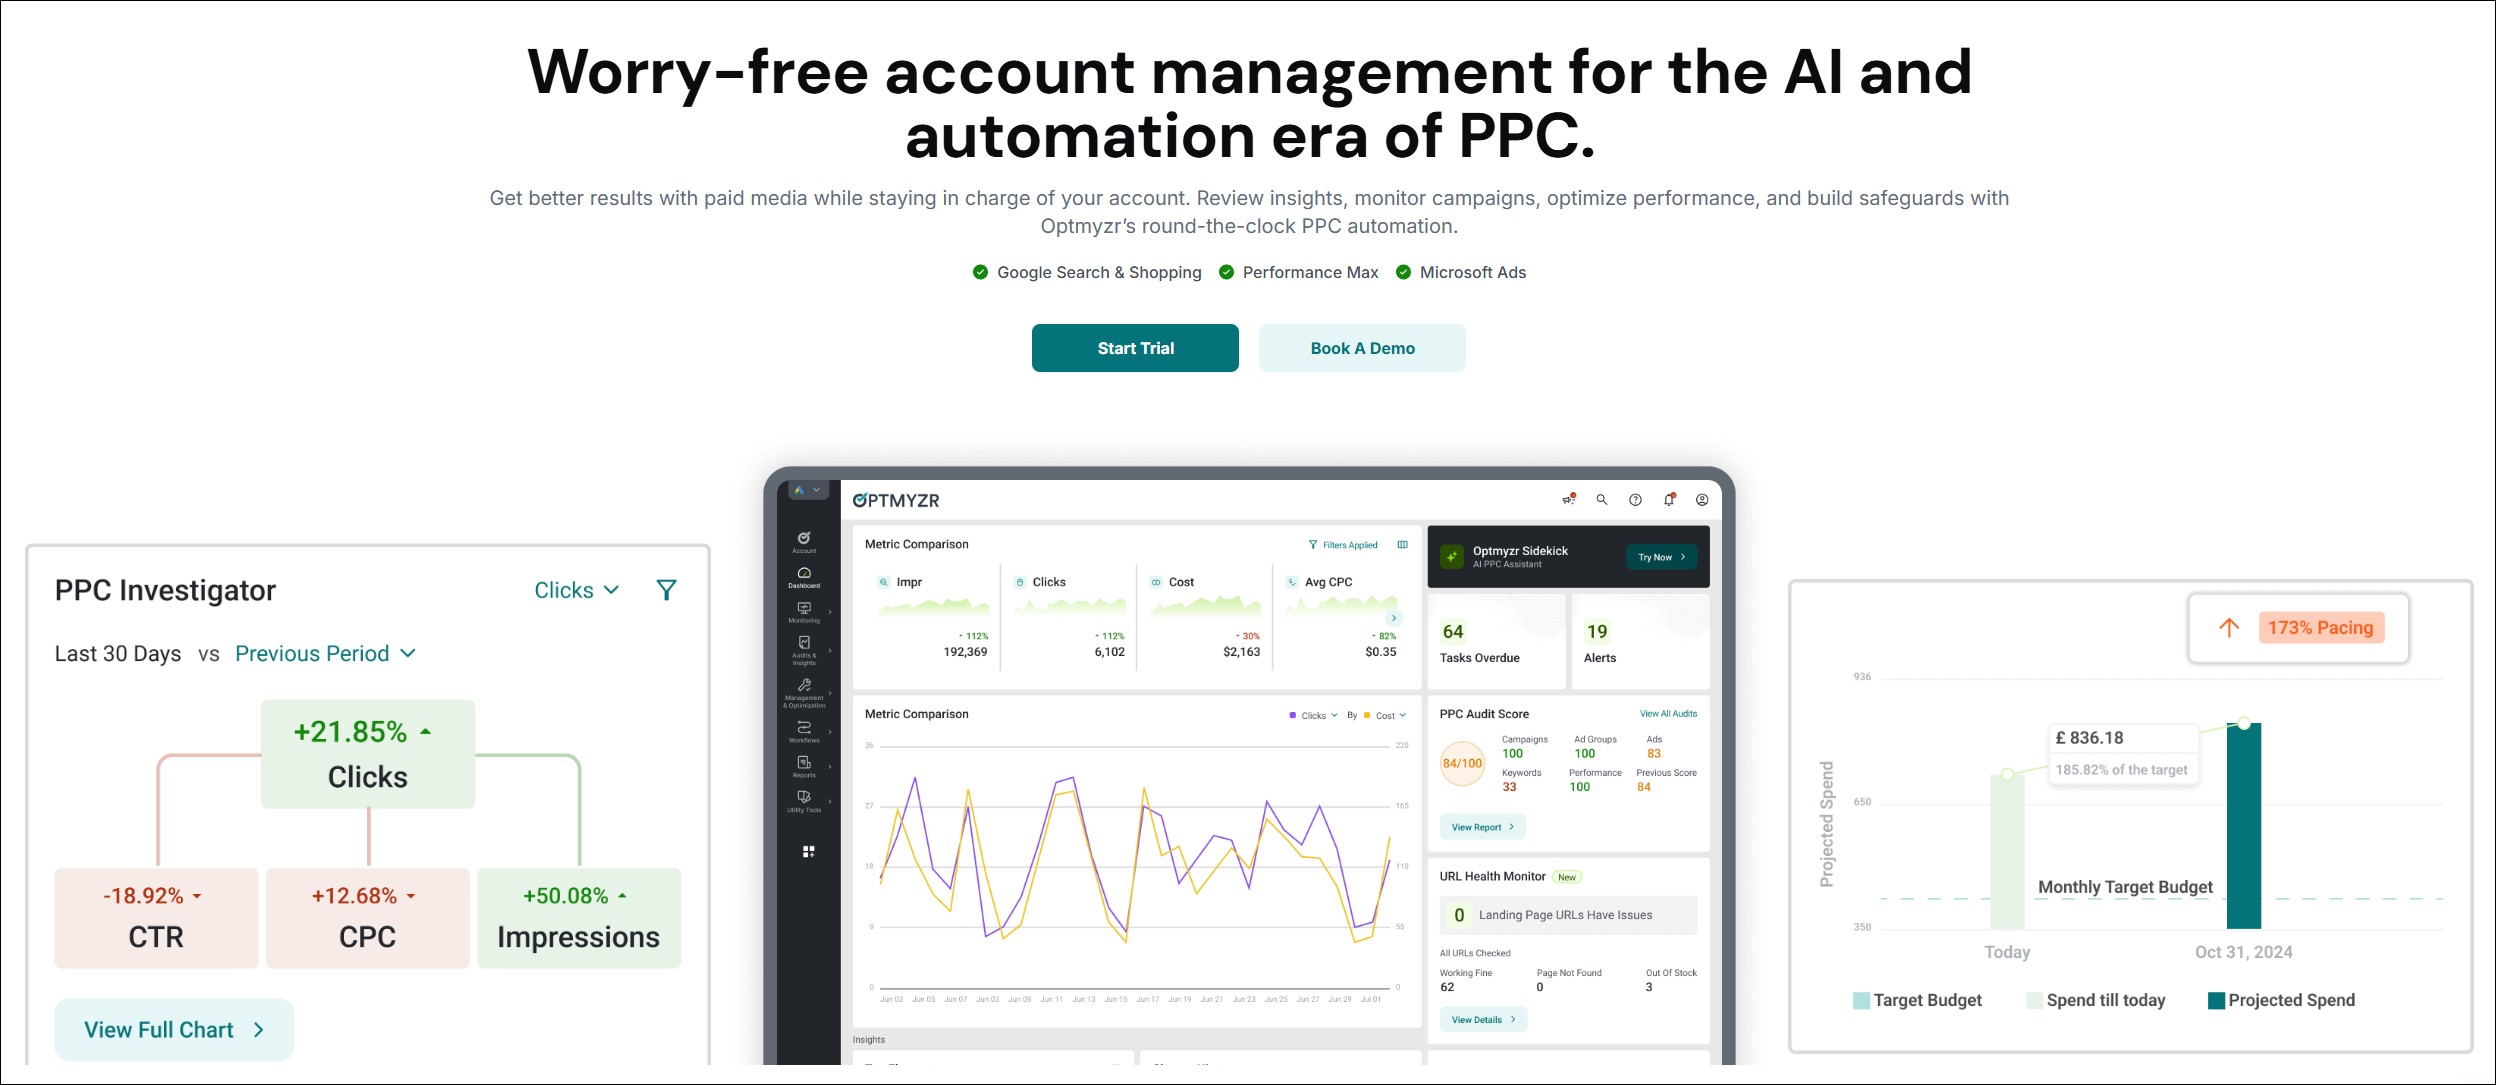
Optmyzr is not a reporting-only tool. Teams typically adopt it when basic dashboards stop being enough—especially once they’re managing multiple accounts, platforms, or clients and need reporting that reflects what’s actually happening inside the accounts.
Rather than functioning only as a reporting layer, Optmyzr combines reporting with optimization, monitoring, and account analysis. This makes it easier to review performance while also seeing relevant context, such as alerts, trends, and recent account activity, without switching between tools.
What kinds of teams use Optmyzr?
Optmyzr is commonly used by:
- Agencies managing multiple clients and accounts that need consistent, repeatable reporting
- In-house PPC teams working across Google Ads, Microsoft Ads, Amazon Ads, and supported paid social platforms
- Teams that want reporting alongside visibility into account changes and optimization activity

Key reporting features
- Cross-platform reporting across major ad platforms, with aligned metrics for comparison
- Custom dashboards and scheduled reports that update automatically
- Performance monitoring and alerts to help surface issues as they happen
- Change monitoring and alerts, providing visibility into account activity alongside performance data
- Multi-account reporting, useful for agency-level and portfolio views
Read more: Optmyzr’s reporting capabilities
Pros & Cons
Pros
- Reporting sits alongside optimization and monitoring workflows
- Strong support for multi-account and cross-platform reporting
- Helpful for investigating and adding context to performance changes
- Well-suited for agencies and teams managing accounts at scale
- Supports real-time data refresh
- Known for top-quality customer support and fast response times
Cons
- May feel heavy if you only need a lightweight reporting tool
- Best value comes when teams actively use its optimization and monitoring features
- Among social media ad platforms, Optmyzr supports Meta and LinkedIn Ads only at the moment; lacks support for TikTok, Snapchat, and other social media platforms
- Some users may find the vast number of tools and features that are available overwhelming at first
What do users say about Optmyzr?
Optmyzr’s users often highlight the benefit of having reporting, monitoring, and optimization in one place—particularly when managing multiple accounts or clients. Instead of relying solely on static dashboards, teams say they use Optmyzr to review performance with additional operational context.
Some users have also find Optmyzr’s reports superior to Looker Studio’s, citing better UI, richer widgets, integrated data, and more flexible scheduling options.
Sign up for a 14-day free trial today to give Optmyzr a try. You will also get the resources you need to get started and more. Our team will also be on hand to answer questions and provide any support we can.
Skai

Best for: Large brands and agencies that manage media across multiple channels and want a centralized view of spend and performance.
Category: Enterprise media management platform with built-in reporting
Pricing: From $114,000/year
Rating: Rated 4/5 on G2 and 4.4/5 on Capterra
Skai is an omnichannel advertising management platform designed to help teams plan, launch, optimize, and measure paid media across “walled-garden” channels from a single interface. Reporting in Skai is designed to support that broader workflow—especially when teams need visibility into performance and budgets across channels.
Key reporting features
- Centralized dashboards and reporting views for monitoring campaign performance in one place
- Spend and performance tracking across channels, aligned to omnichannel media workflows
- Budget management and pacing-related capabilities, built into Skai’s platform
Pros and Cons
Pros
- Useful when multiple stakeholders need standardized visibility into spend and performance across channels
- Strong fit for teams focused on budget management and pacing at scale
Cons
- Expensive, complicated pricing and free trial structure
- Has a longer support response time (6-24 hours) than Optmyzr (2 hours)
- Some users mention a learning curve, especially across different modules
- Can be more than you need if you’re only looking for a lightweight reporting layer
What do users say about Skai?
G2 reviewers often highlight Skai’s usability and support, and some call out improvements in budget management and pacing—while noting that parts of the platform can take time to learn.
Read: How Skai compares to Optmyzr
DashThis
Best for: Agencies and freelancers that need simple, repeatable, client-facing dashboards without heavy setup or maintenance.
Pricing: From $49/month
Rating: Rated 4.8/5 on G2 and 4.5/5 on Capterra
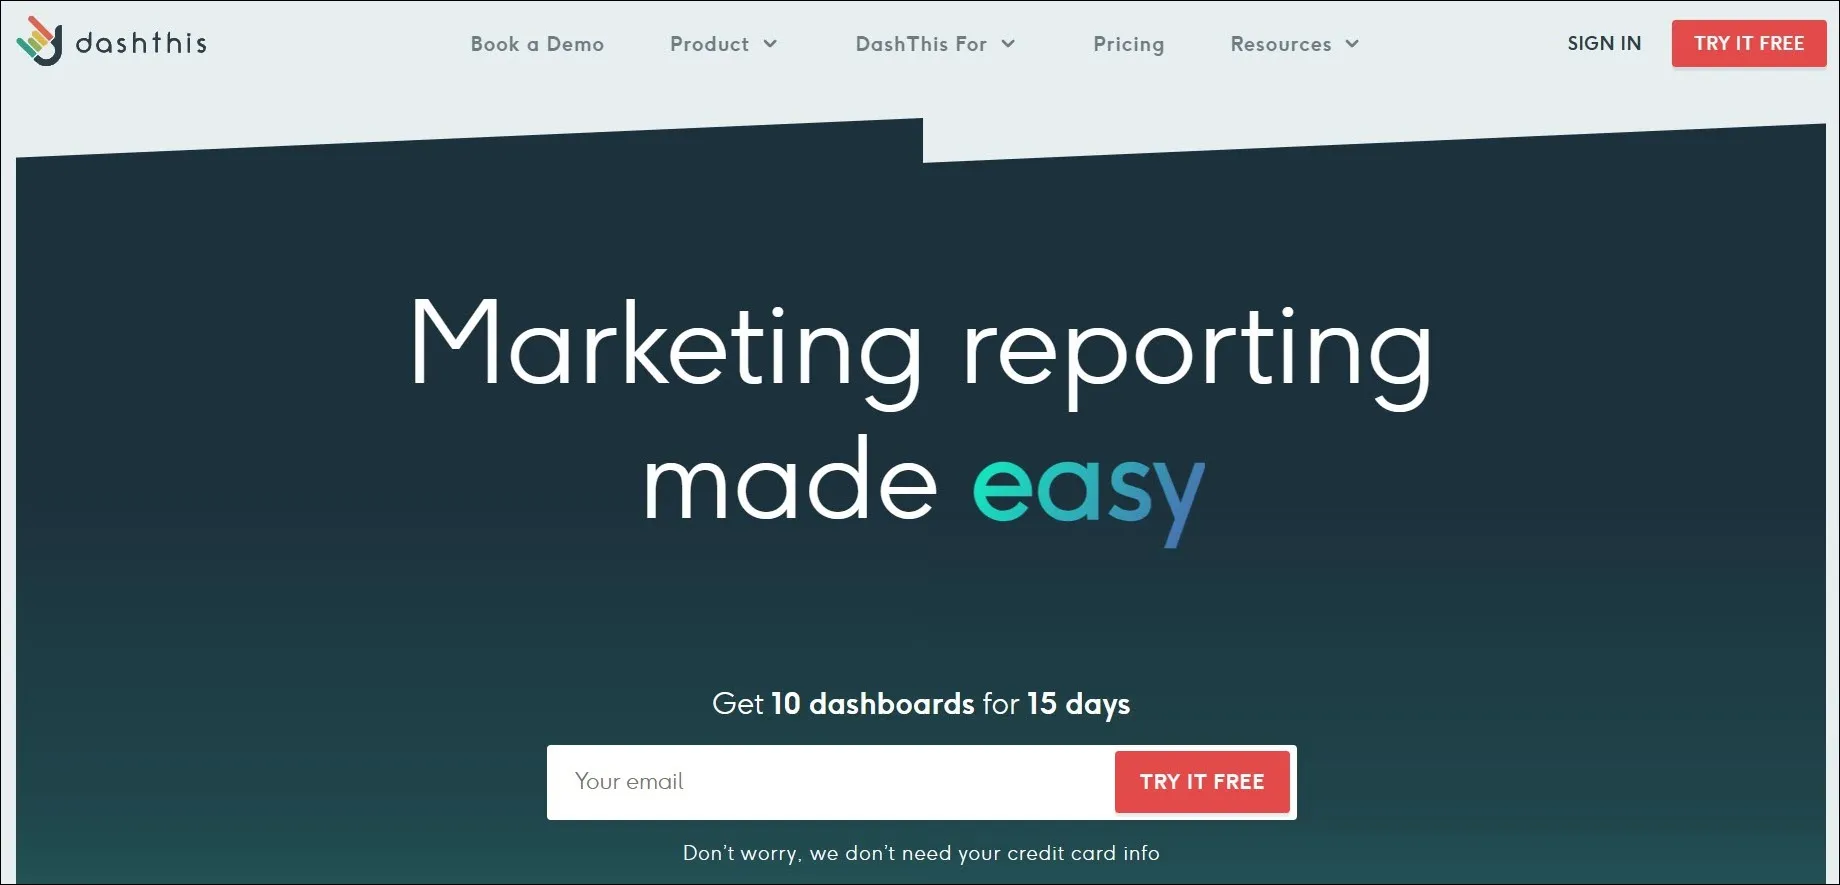
DashThis is a reporting-first tool designed to make it easy to build and share marketing dashboards. Teams typically use it when the goal is to deliver clean, consistent reports to clients on a regular schedule—without spending hours pulling data or rebuilding charts.
Unlike diagnostic or optimization tools, DashThis focuses on presentation. It works well when you already know what you want to report and need a reliable way to package that information for clients or stakeholders.
Reporting role
DashThis plays a client-ready dashboarding role in the reporting workflow. It’s best suited for recurring reports and high-level performance overviews, rather than deep PPC analysis or investigation.
Key reporting features
- Automated, scheduled dashboards that update regularly
- Drag-and-drop report builder with pre-built widgets and templates
- Multi-source data integration for common digital marketing platforms
- Shareable dashboards and exports, designed for client consumption
Pros and Cons
Pros
- Easy to set up and use, even for non-technical users
- Well-suited for agencies managing repeatable reporting across clients
- Clean, readable dashboards that clients can understand quickly
Cons
- Steep pricing especially for small businesses or freelancers, not a big issue if you only need a few dashboards, but the cost can add up quickly if you need a lot of dashboards
- Some users reported errors and inconsistencies in dashboard data.
- Limited flexibility for deep PPC analysis or custom metrics
- Less useful for diagnosing why performance changed
What do users say about DashThis?
Users often appreciate DashThis for its ease of use and presentation-ready dashboards, especially for client reporting. Some note that while it’s effective for high-level reporting, it’s less flexible when more detailed analysis or custom reporting logic is needed.
ReportGarden
Best for: Agencies that want client reporting in one place, and also care about workflow features like client management and billing.
Pricing: From $89/month
Rating: Rated 4.5/5 on G2 and 4.5/5 on Capterra
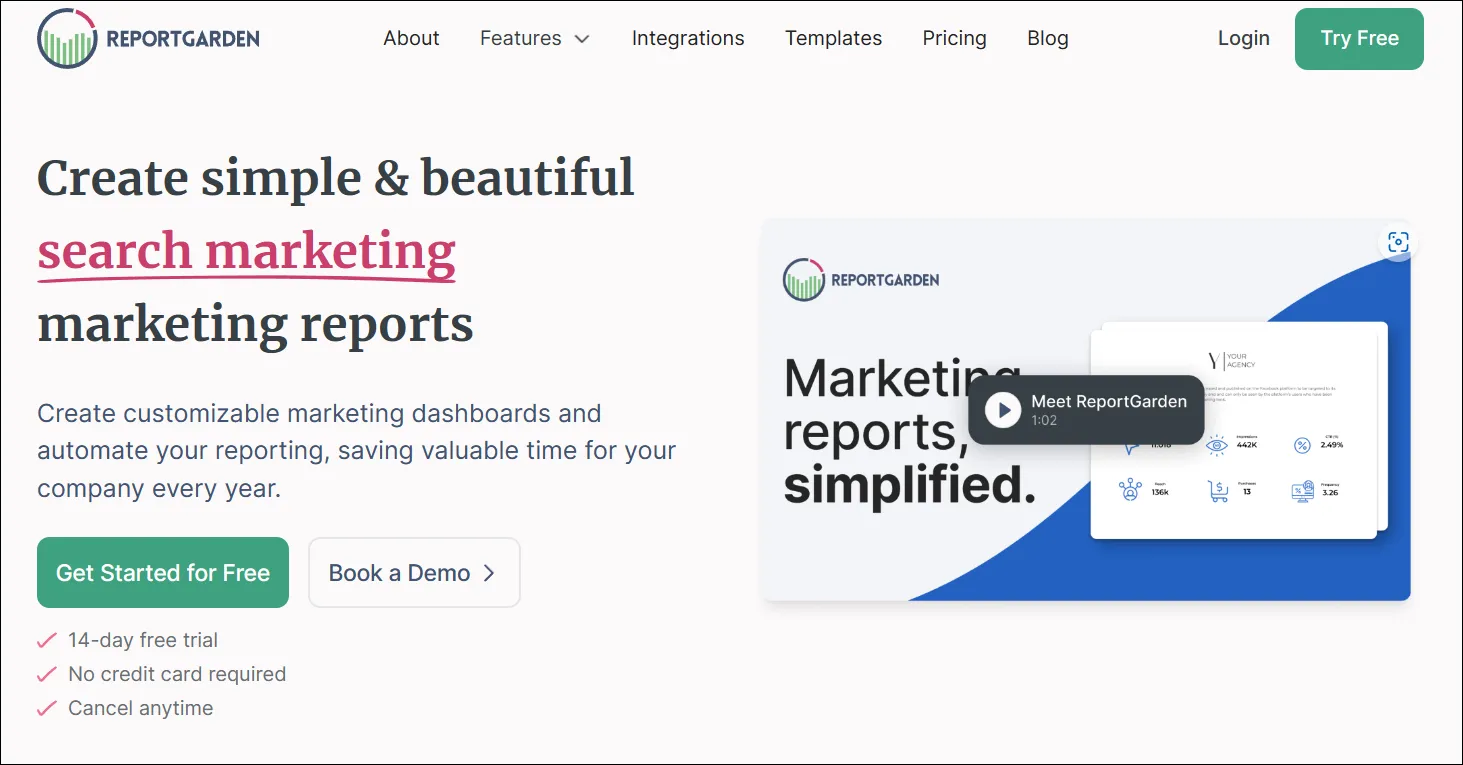
ReportGarden is a reporting-focused platform built for agencies that need to deliver recurring marketing reports to clients without rebuilding everything every month. It’s typically used when the goal is to standardize reporting across multiple clients and channels, and keep delivery consistent.
Where reporting-first dashboard tools focus mainly on visuals, ReportGarden leans more toward agency workflow—making it a better fit for teams that want reporting plus operational structure, not just charts.
Reporting role
ReportGarden plays a client reporting + agency workflow role. It’s best for repeatable client reporting, not deep PPC diagnostics.
Key reporting features
- Client-ready dashboards and scheduled reports for recurring delivery
- Templates and widgets that make reporting repeatable across clients
- Multi-platform reporting support for common digital marketing channels
- Agency workflow support (useful if you want reporting alongside client operations)
Pros and Cons
Pros
- Good fit for agencies managing repeatable client reporting at scale
- Useful when you want reporting plus workflow features in one place
- Easy for clients and stakeholders to consume
Cons
- Steep pricing especially for small businesses or freelancers; not a big issue if you only need a few dashboards, but the cost can add up quickly if you need a lot of dashboards
- Can feel expensive for freelancers or smaller teams
- Some users report occasional dashboard inconsistencies
- Takes time to get fully set up if you’re standardizing across many clients
What do users say about ReportGarden?
Users often like ReportGarden for reducing manual reporting work and keeping recurring reports consistent. Some mention a learning curve during setup and onboarding, especially when building repeatable templates across clients.
Supermetrics
Best for: eams that want full control over reporting and already build reports in tools like Google Sheets, Looker Studio, or a BI warehouse.
Pricing: Pricing is platform-specific
Rating: Rated 4.4/5 on G2 and 4.4/5 on Capterra
Supermetrics isn’t a dashboarding or reporting platform on its own. It’s a data connector that pulls marketing and advertising data from multiple sources and sends it into the tools where you actually build reports.
Teams usually choose Supermetrics when they don’t want to be locked into a pre-built dashboard experience—and instead want to design their own reporting in spreadsheets, Looker Studio, or a data warehouse.
Reporting role
Supermetrics plays a data pipeline / connector role. It helps you get PPC data into your reporting environment, but it doesn’t replace the reporting layer itself.
Key reporting features
- Connects to multiple marketing and ad platforms to extract performance data
- Exports data into reporting destinations like Sheets, Looker Studio, and databases (depending on plan)
- Scheduled refreshes so your reports update without manual exports
- Flexible data handling for teams that need custom reporting logic
Pros and Cons
Pros
- Strong option if you want custom reporting and control over data structure
- Useful for teams already using Sheets/Looker/BI tools for reporting
- Helps reduce manual data exports and recurring report maintenance
Cons
- On the pricier side for small businesses or freelancers considering its biggest use cases are analysis and reporting
- Not a dashboard tool—your team still needs to build the reports elsewhere
- Can be overkill if you just want ready-made dashboards
- Setup and maintenance may require more technical comfort (especially at scale)
- Reports of substandard customer support on G2
What do users say about Supermetrics?
Users often value Supermetrics for reliably pulling data from multiple platforms into their reporting setup. Some mention occasional connector issues and a learning curve, particularly when building more complex reporting workflows.
Read: How Supermetrics compares to Optmyzr
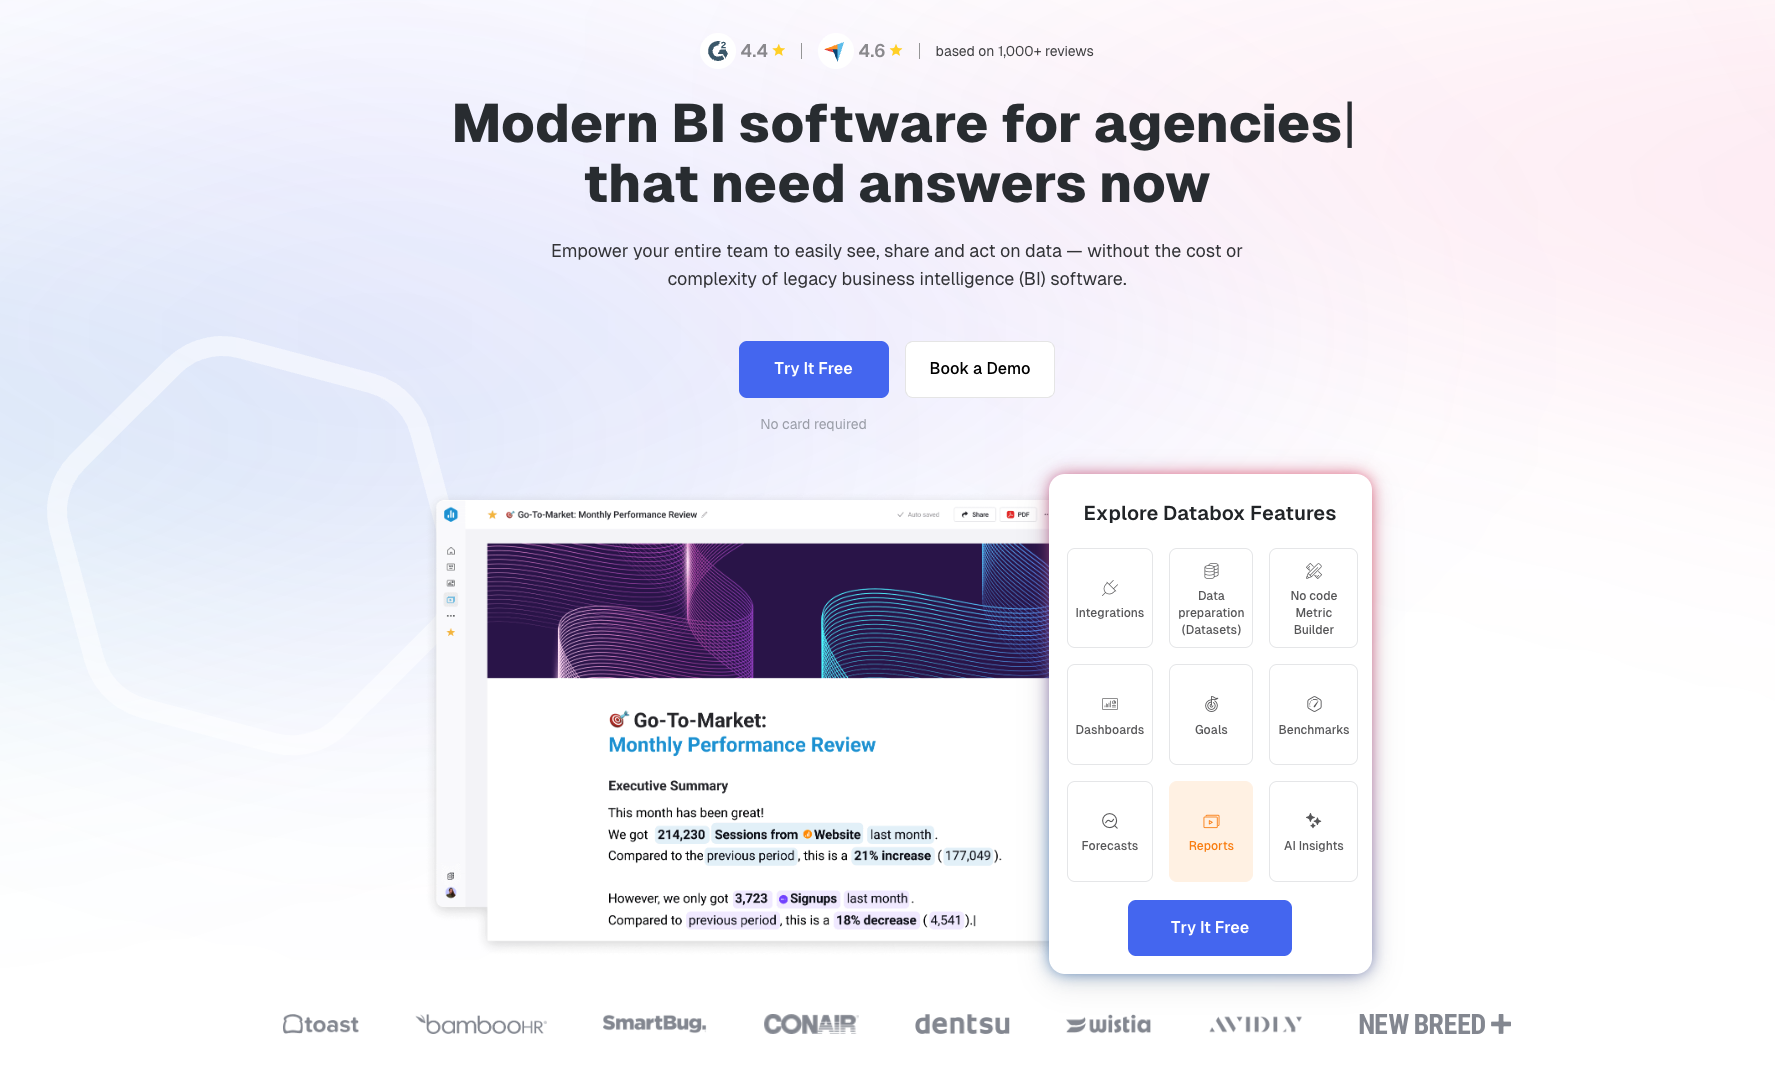
Databox
Best for: Teams that want simple KPI dashboards to track performance at a glance—especially for leadership updates and weekly check-ins.
Pricing: Free plan available; paid plans from $199/month
Rating: Rated 4.4/5 on G2 and 4.7/5 on Capterra
Databox is a dashboarding tool built around pulling metrics from multiple sources into one place and presenting them in clean, easy-to-read views. Teams typically use it when they want a quick performance pulse without building a full reporting stack.
In PPC reporting, Databox is most useful for high-level visibility—things like spend, conversions, CPA, and ROAS trends—rather than deep analysis into why performance changed.
Reporting role
Databox plays an executive dashboard / KPI tracking role. It’s best for monitoring and summary views, not detailed PPC diagnostics.
Key reporting features
- KPI dashboards designed for quick performance monitoring
- Multi-source integrations for common marketing and analytics platforms
- Scheduled updates so dashboards stay current without manual exports
- Shareable views for internal stakeholders
Pros and Cons
Pros
- Easy to read and quick to set up for KPI monitoring
- Useful for leadership dashboards and recurring check-ins
- Good for cross-channel summaries in one place
Cons
- On the pricier side for small businesses or freelancers considering its biggest use cases are analysis and reporting
- Limited when you need to explain why performance changed
- Can require careful setup to keep metrics consistent across sources
What do users say about Databox?
Users often like Databox for its clean dashboards and ease of use. Some mention that it takes time to get dashboards set up the way they want, especially when connecting multiple data sources.
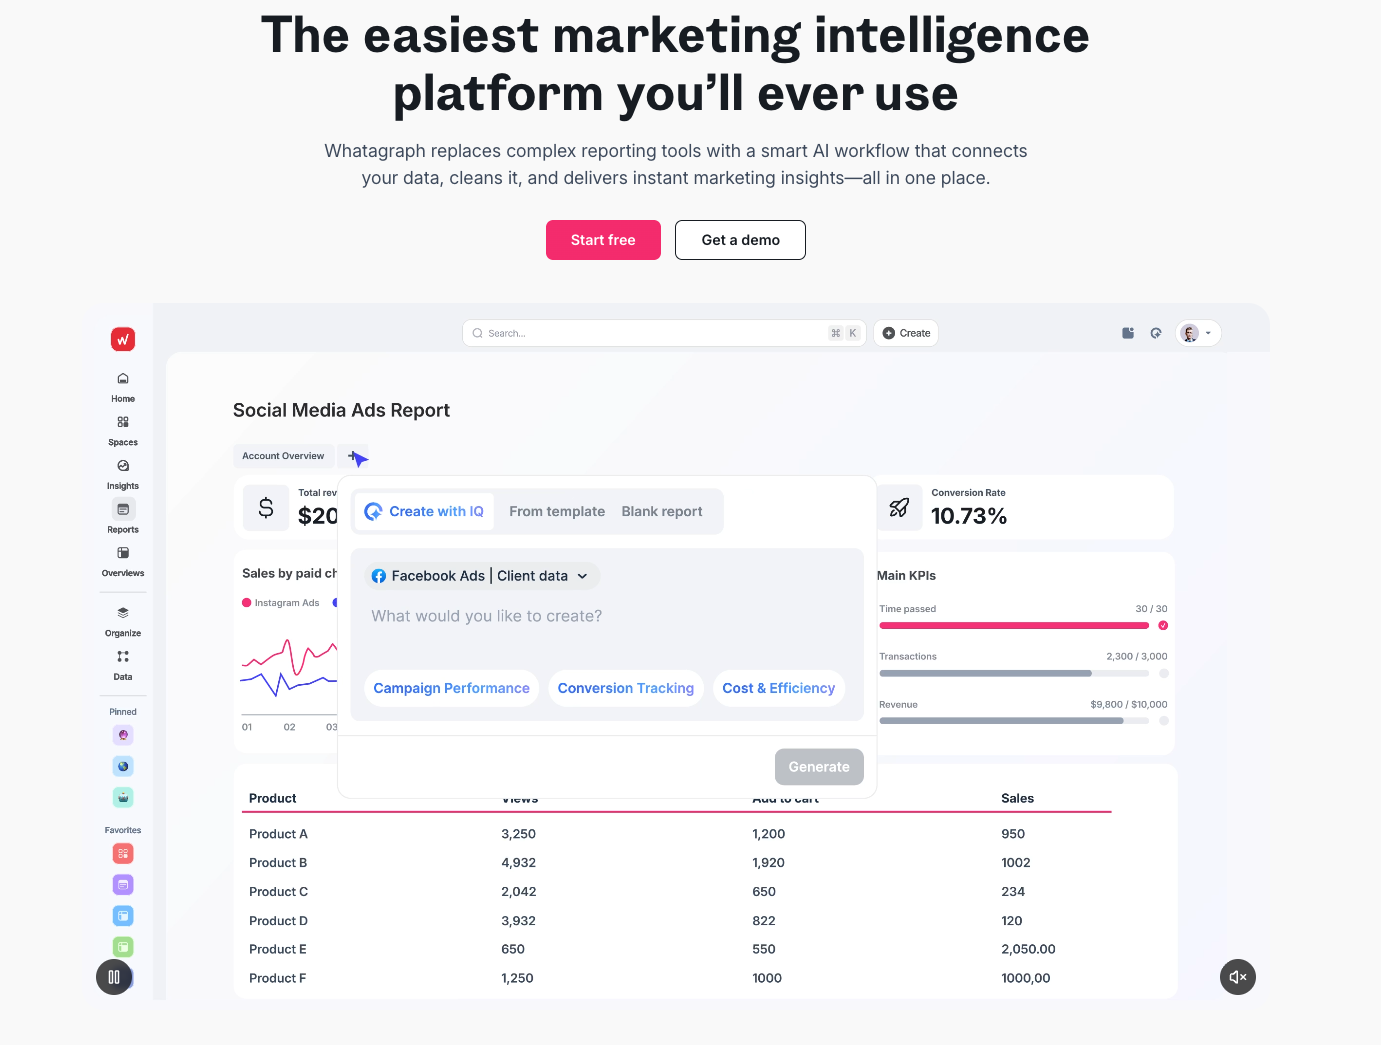
Whatagraph
Best for: Agencies and in-house teams that need customizable, multi-channel client reports with a clean delivery workflow.
Pricing: From $249 per month
Rating: Rated 4.5/5 on G2 and 4.4/5 on Capterra
Whatagraph is a reporting-first platform built around pulling data from multiple marketing sources and turning it into client-ready reports and dashboards. Teams typically use it when they want to standardize reporting across accounts and channels, while still customizing layouts for different clients or stakeholders.
In PPC workflows, Whatagraph is most useful for presentation and delivery—packaging performance data into reports that are easy to share and easy to understand.
Reporting role
Whatagraph plays a client reporting and report delivery role. It’s designed for building and sharing reports, not for diagnosing account issues.
Key reporting features
- Multi-source reporting across common marketing platforms
- Customizable report layouts for different clients and stakeholders
- Templates and widgets to speed up report creation
- Shareable dashboards and scheduled delivery
Pros and Cons
Pros
- Strong fit for agencies delivering recurring client reports
- Clean layouts that are easy for clients to consume
- Good balance of templates and customization
Cons
- Adjustments within reports don’t happen in real-time
- Known to be buggy occasionally
- Not built for deep PPC analysis or “why did this change?” diagnostics
- Data refresh may not be immediate depending on sources and setup
- Some users report occasional data quirks depending on connectors
What do users say about Whatagraph?
Users often mention that it’s easy to build client-facing reports and automate delivery. Some note that pricing can feel high for smaller teams, and that occasional connector limitations can show up depending on data sources.
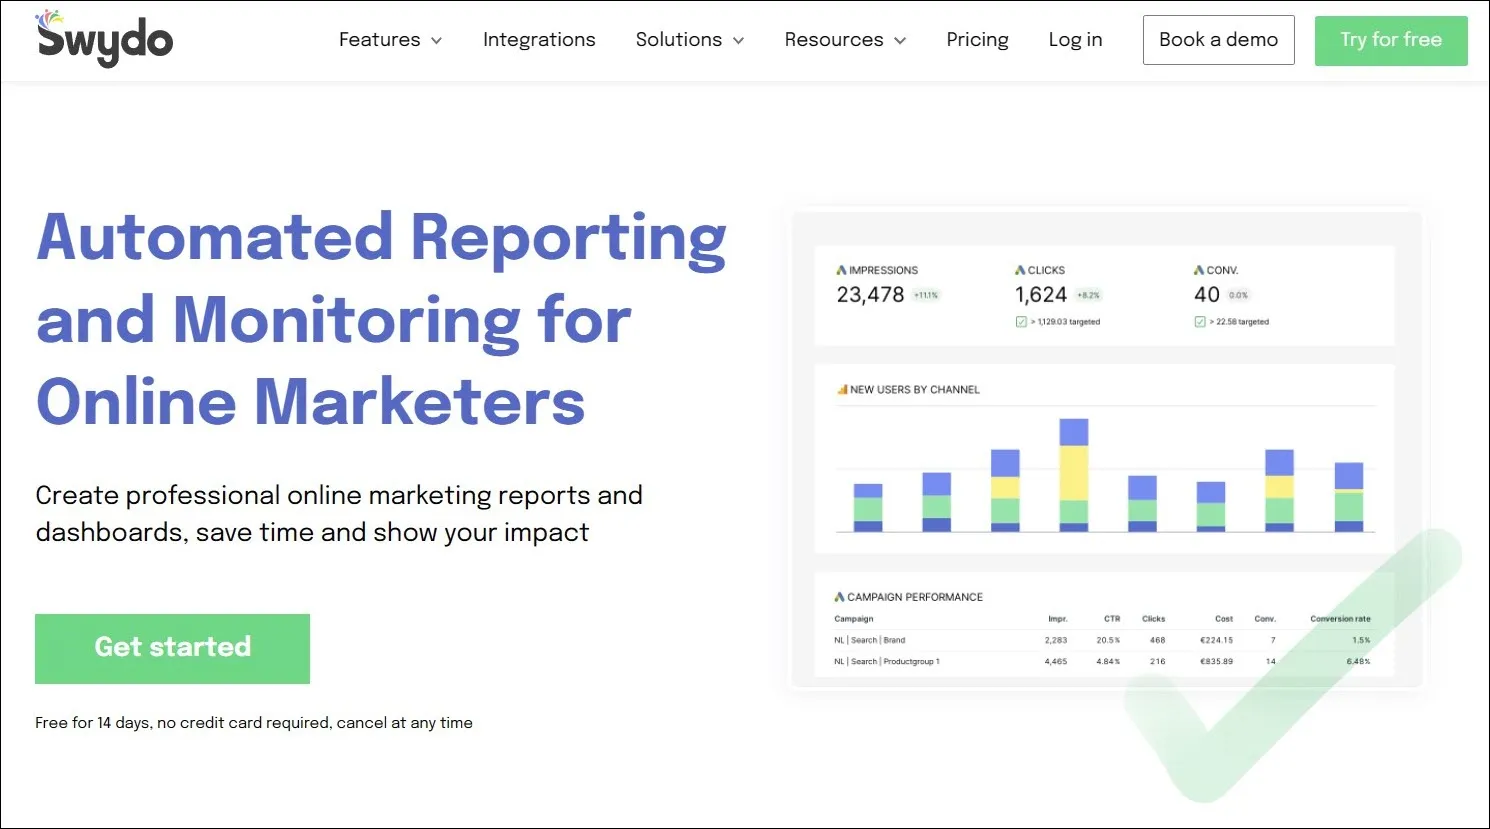
Swydo
Best for: Agencies and freelancers who want budget-friendly, scheduled reporting for PPC and other marketing channels.
Pricing: From $69/month
Rating: Rated 4.2/5 on G2 and 4.5/5 on Capterra
Swydo is a reporting tool built to help teams pull data from common marketing platforms and turn it into repeatable reports. It’s typically used when the priority is consistent client reporting—scheduled delivery, shareable dashboards, and a workflow that doesn’t require rebuilding reports every month.
In PPC reporting, Swydo works best for recurring reporting and presentation, rather than deep analysis or diagnostics.
Reporting role
Swydo plays a scheduled reporting and client dashboarding role.
Key reporting features
- Templates and widgets to speed up report creation
- Scheduled report delivery for recurring reporting cycles
- Common marketing integrations for multi-channel reporting
- Customizable report layouts for client-facing presentation
Pros and Cons
Pros
- Good option for standardized client reporting on a budget
- Reporting is straightforward and easy to repeat across clients
- Useful when you want scheduled delivery without a heavy setup
Cons
- Not designed for deep PPC analysis or investigation
- Connector limitations can depend on the platforms you use
- Some users mention support could be stronger compared to higher-priced tools
What do users say about Swydo?
Users often like Swydo for making recurring reports easier to build and deliver. Some mention they’d like more flexibility in data handling and automation, depending on their reporting needs.
Track. Monitor. Report.
Dashboards show what happened. But PPC teams get judged on whether they can explain it. Optmyzr helps you report performance with context—so you can catch issues early, show what changed, and back up your recommendations with real account visibility.
Sign up for a 14-day free trial today. Thousands of advertisers — from small agencies to big brands — worldwide use Optmyzr to manage over $5 billion in ad spend every year. Plus, if you want to know how Optmyzr’s various features help you in detail, talk to one of our experts today for a consultation call.
You will also get the resources you need to get started and more. Our team will also be on hand to answer questions and provide any support we can.
Frequently Asked Questions
What is a PPC reporting tool?
A PPC reporting tool is software that aggregates and analyzes data from your pay-per-click campaigns across multiple platforms. It provides insights, helps you visualize performance trends, and simplifies campaign reporting across client accounts.
Why do I need a PPC reporting tool?
Native ad platform dashboards often fall short when managing campaigns across multiple networks. Reporting tools save time, centralize campaign metrics, and produce clear, actionable insights and visual reports—without heavy customization.
How do PPC reporting tools deliver broader value compared to manual reporting?
They enable:
- Automated data aggregation from multiple platforms
- Visual dashboards for quick insights
- Scheduled reports that save time and reduce manual tasks
- Deeper, more consistent reporting that’s often unattainable via native tools or spreadsheets
Why don’t my numbers match between Google Ads, GA4, and my reporting tool?
Different platforms use different attribution models, time zones, and data refresh schedules, which is why numbers rarely line up perfectly. Reporting tools that clearly show data sources, refresh timing, and context make these differences easier to understand and communicate.
How often should I report PPC performance—and what’s overkill?
Weekly reporting works well for pacing and early issue detection, while monthly reporting is better for performance trends and strategy. Tools that support flexible scheduling and reusable templates make it easier to adjust reporting frequency without extra work.
What’s the minimum PPC reporting stack that still works?
Most teams can get by with one core reporting platform for dashboards and delivery, plus one tool that provides monitoring or diagnostic context. The right mix depends on how much explanation and control you need when performance changes.