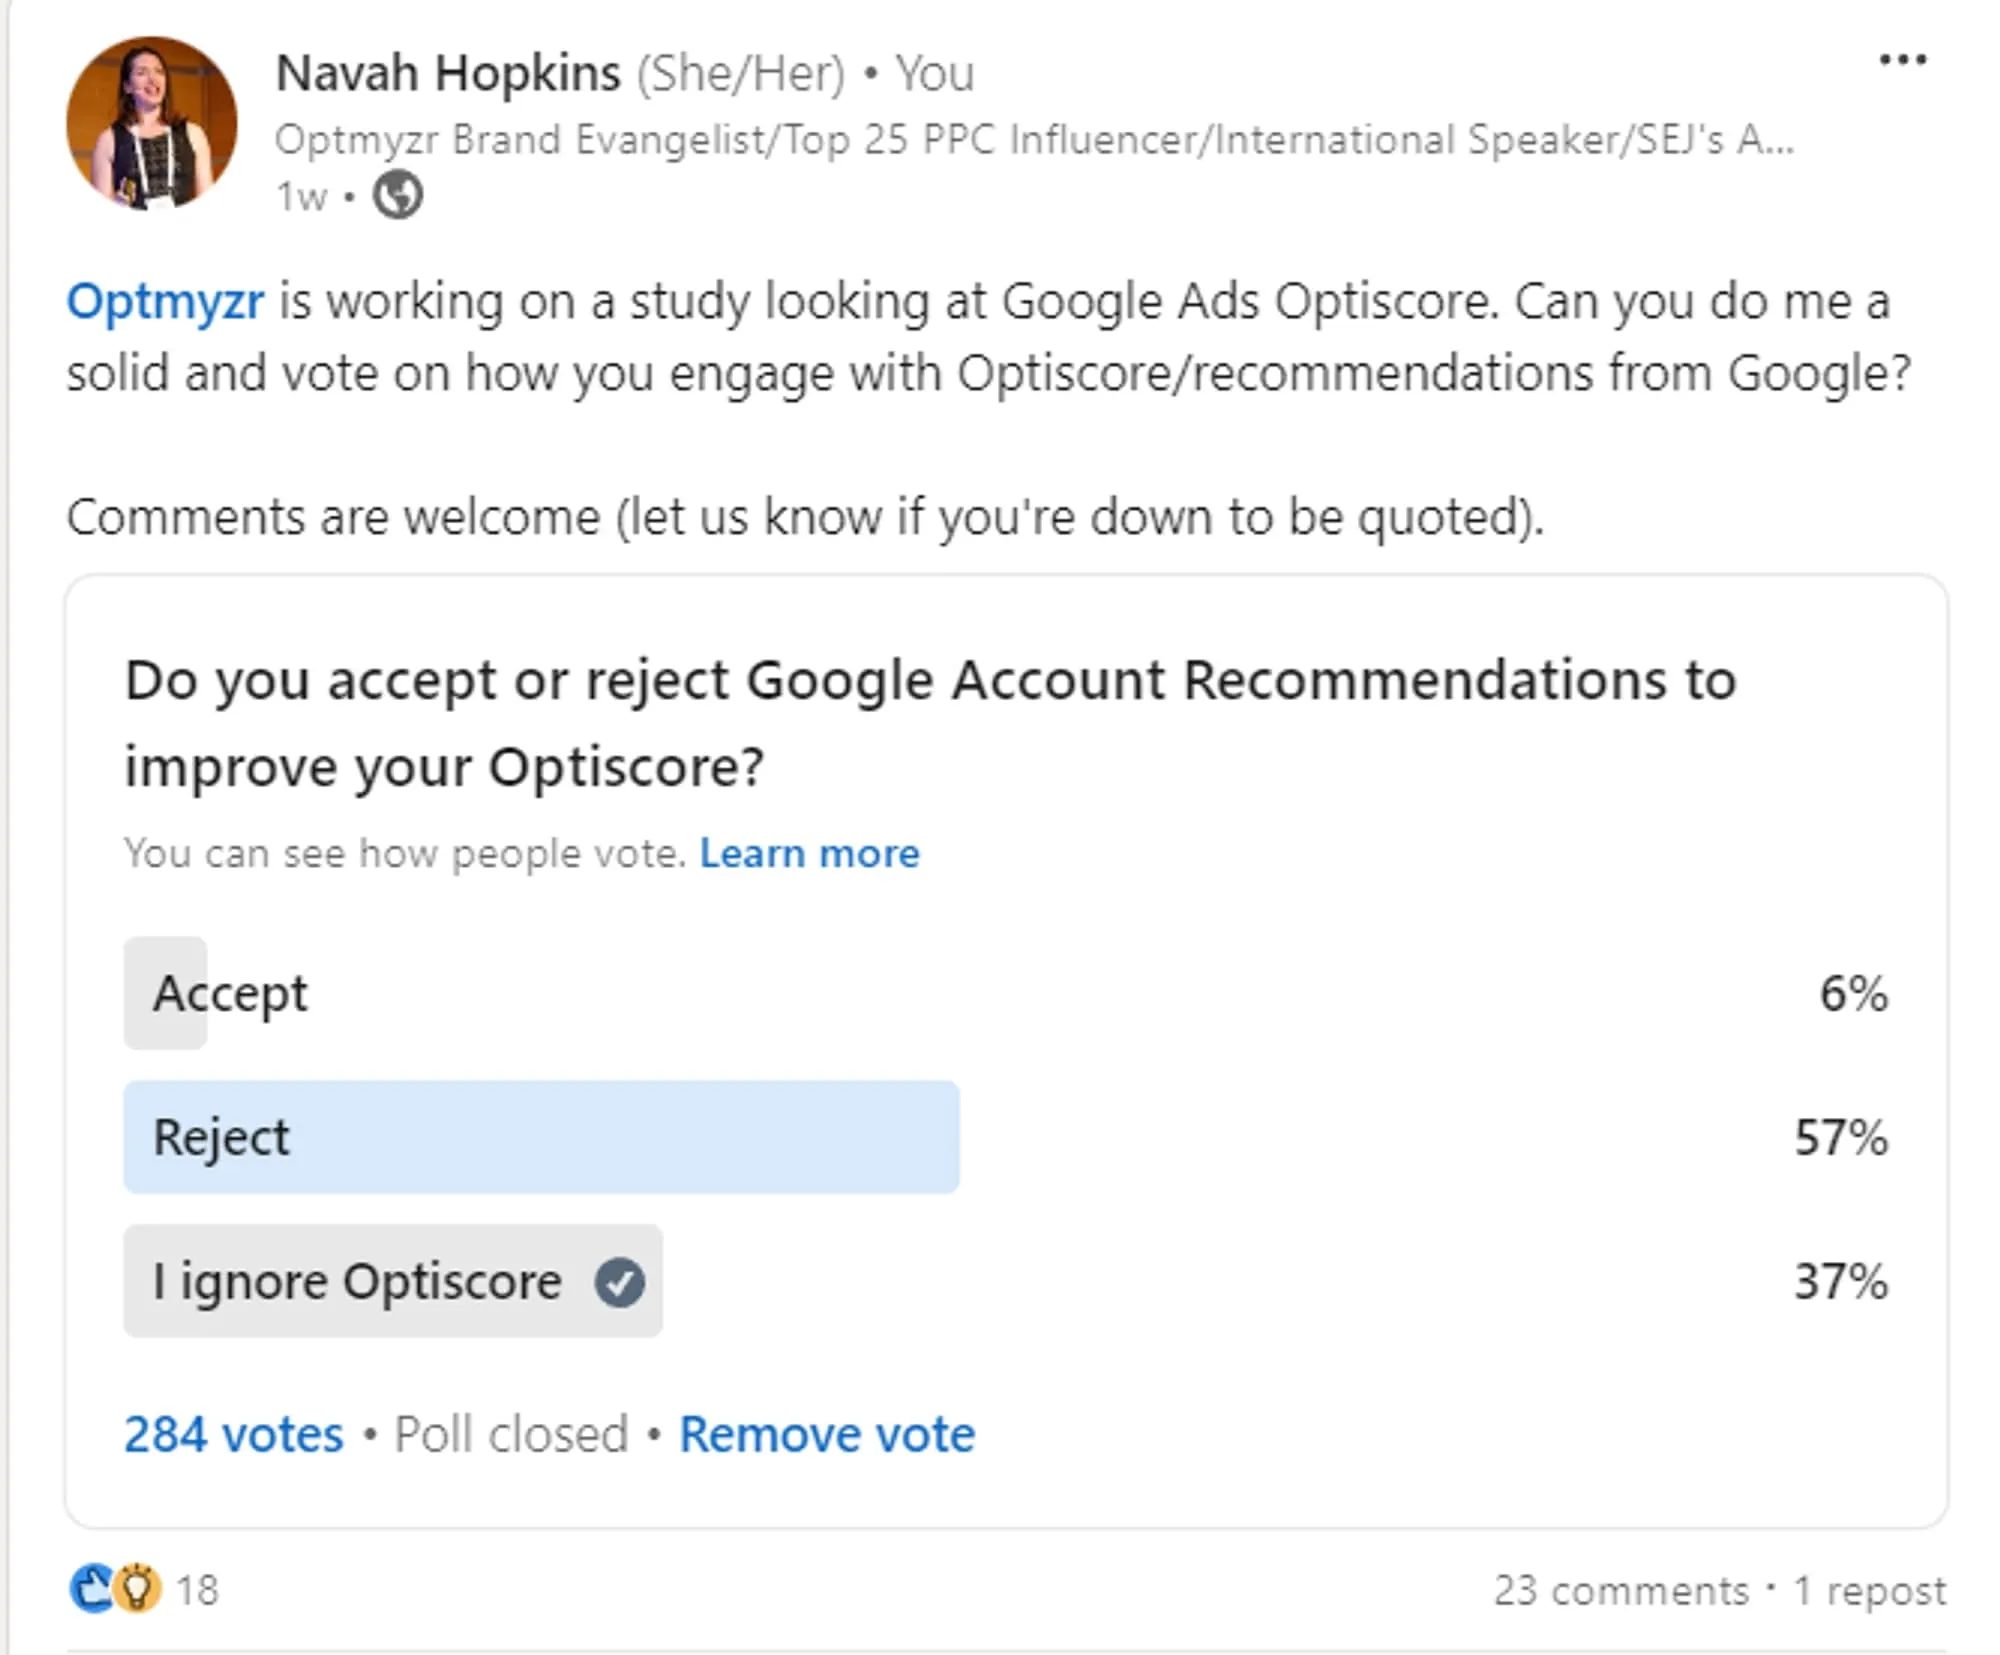
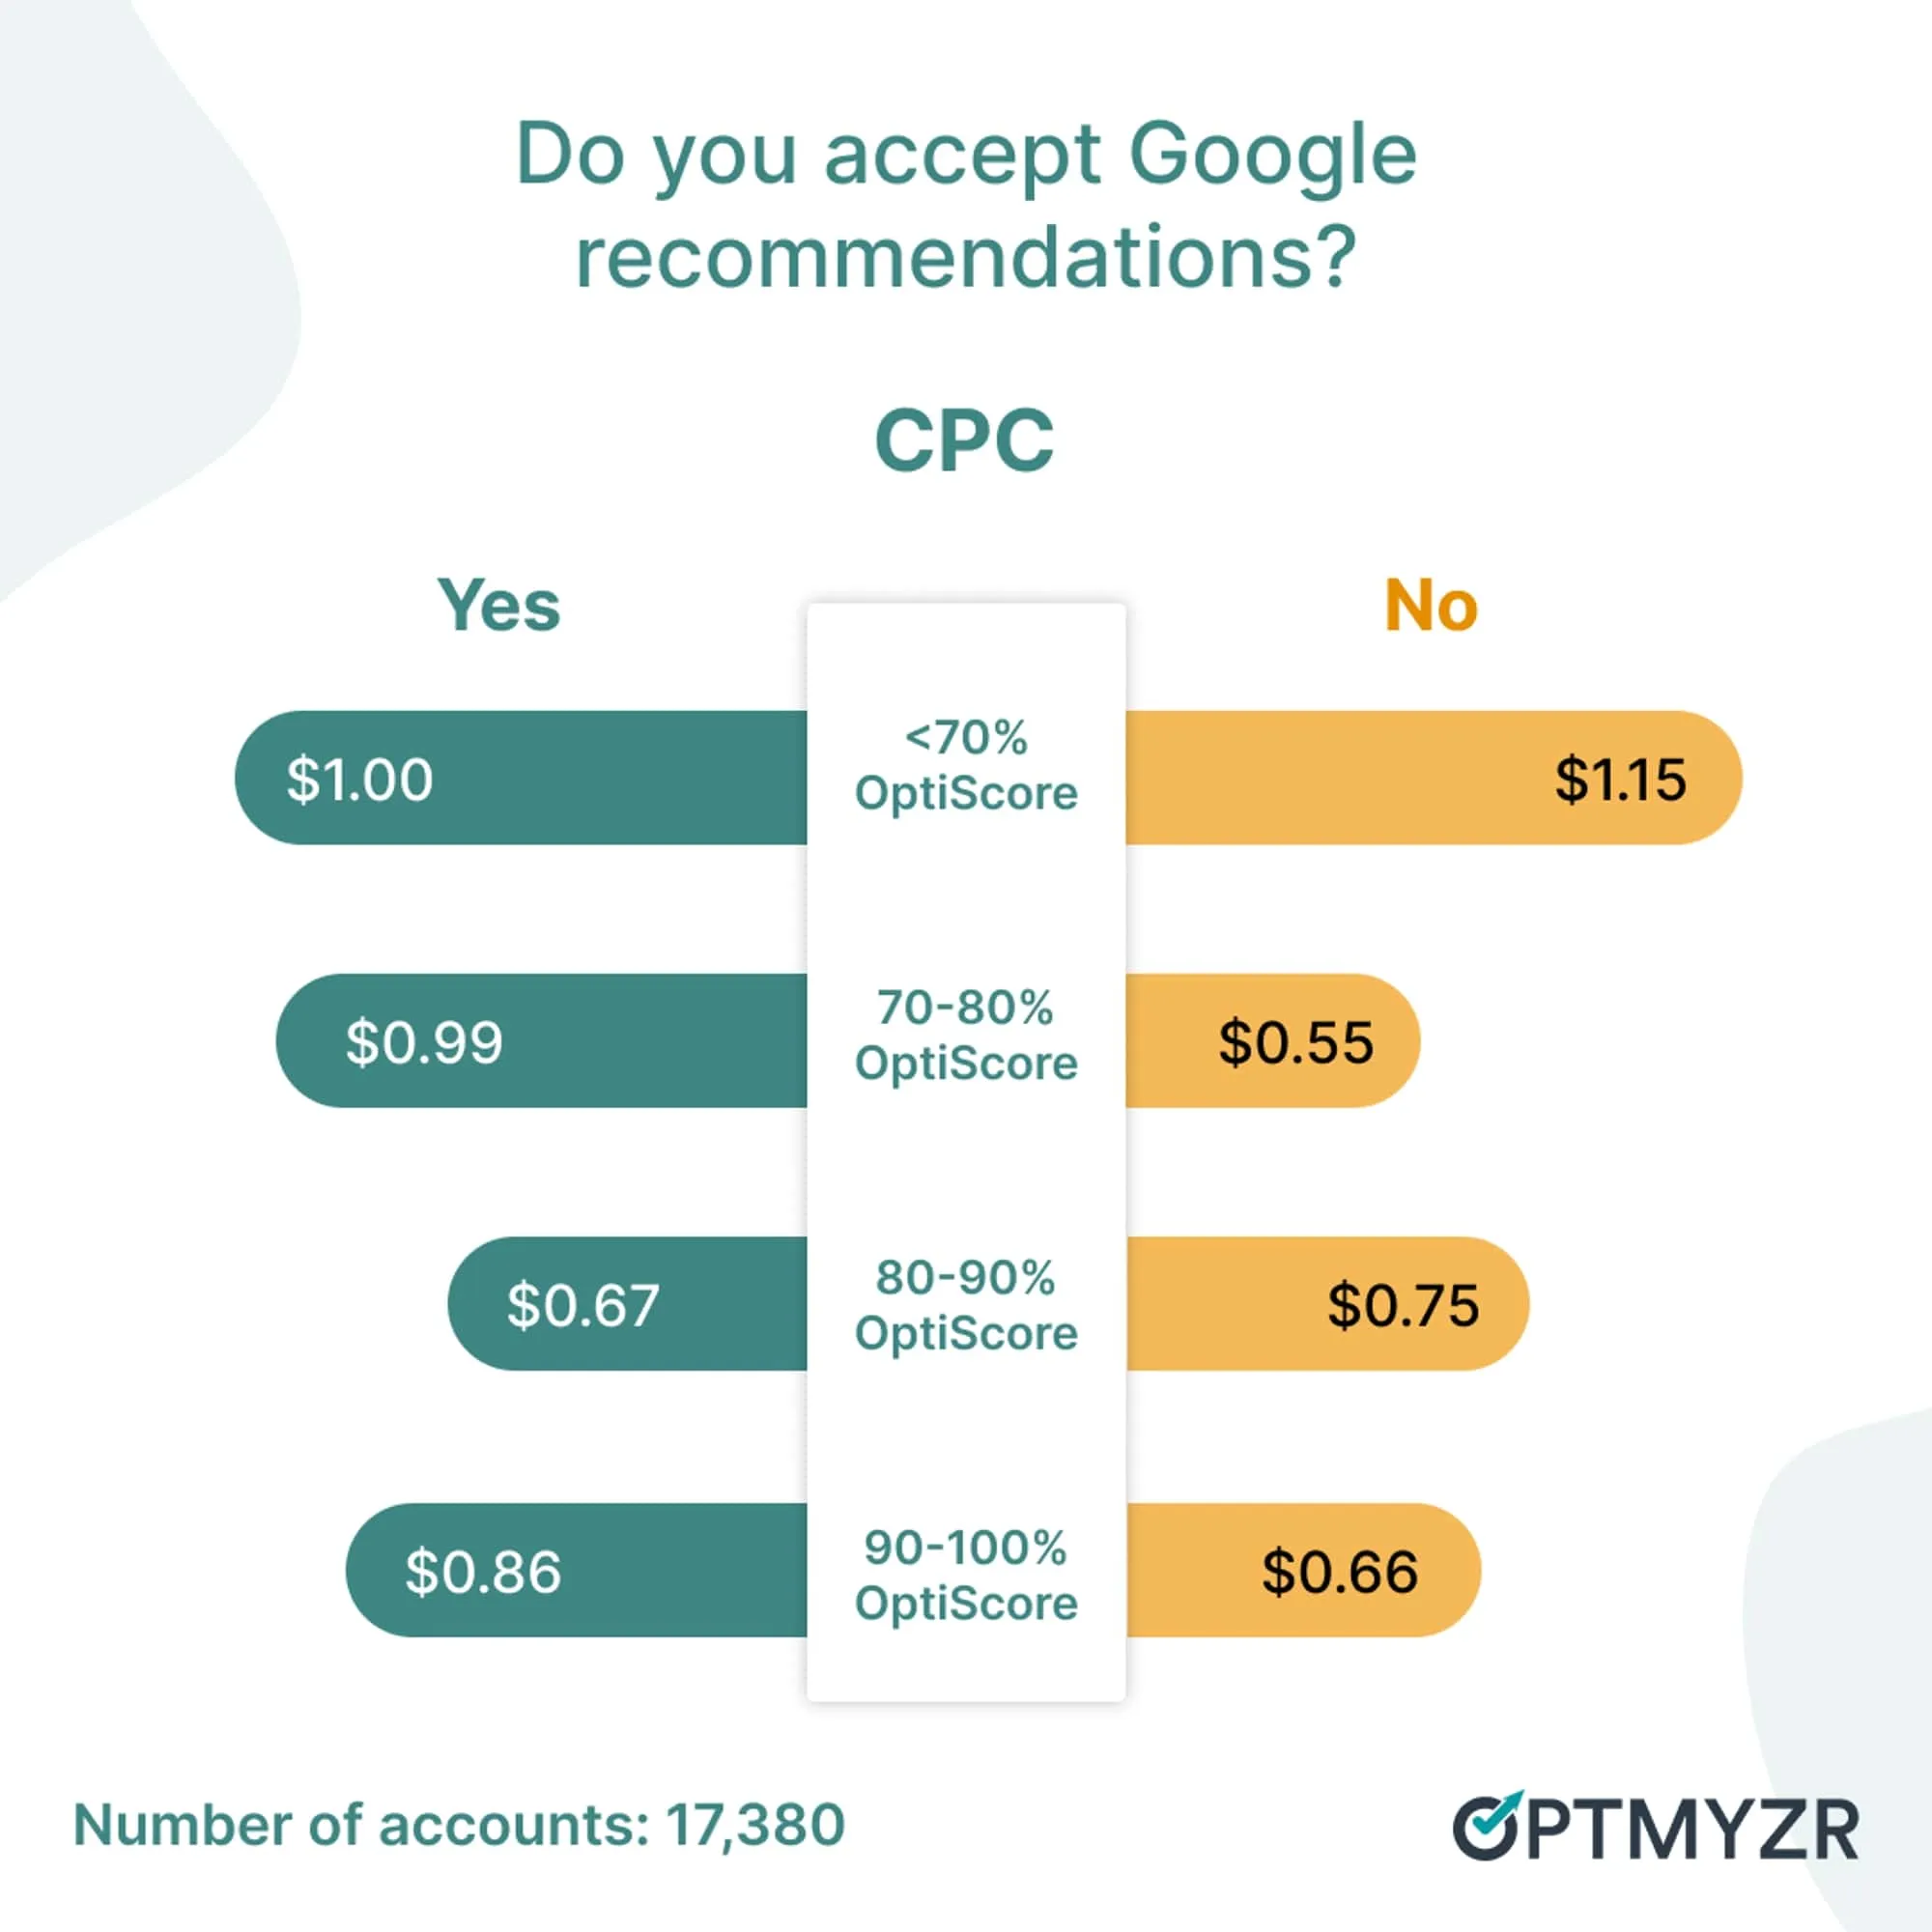
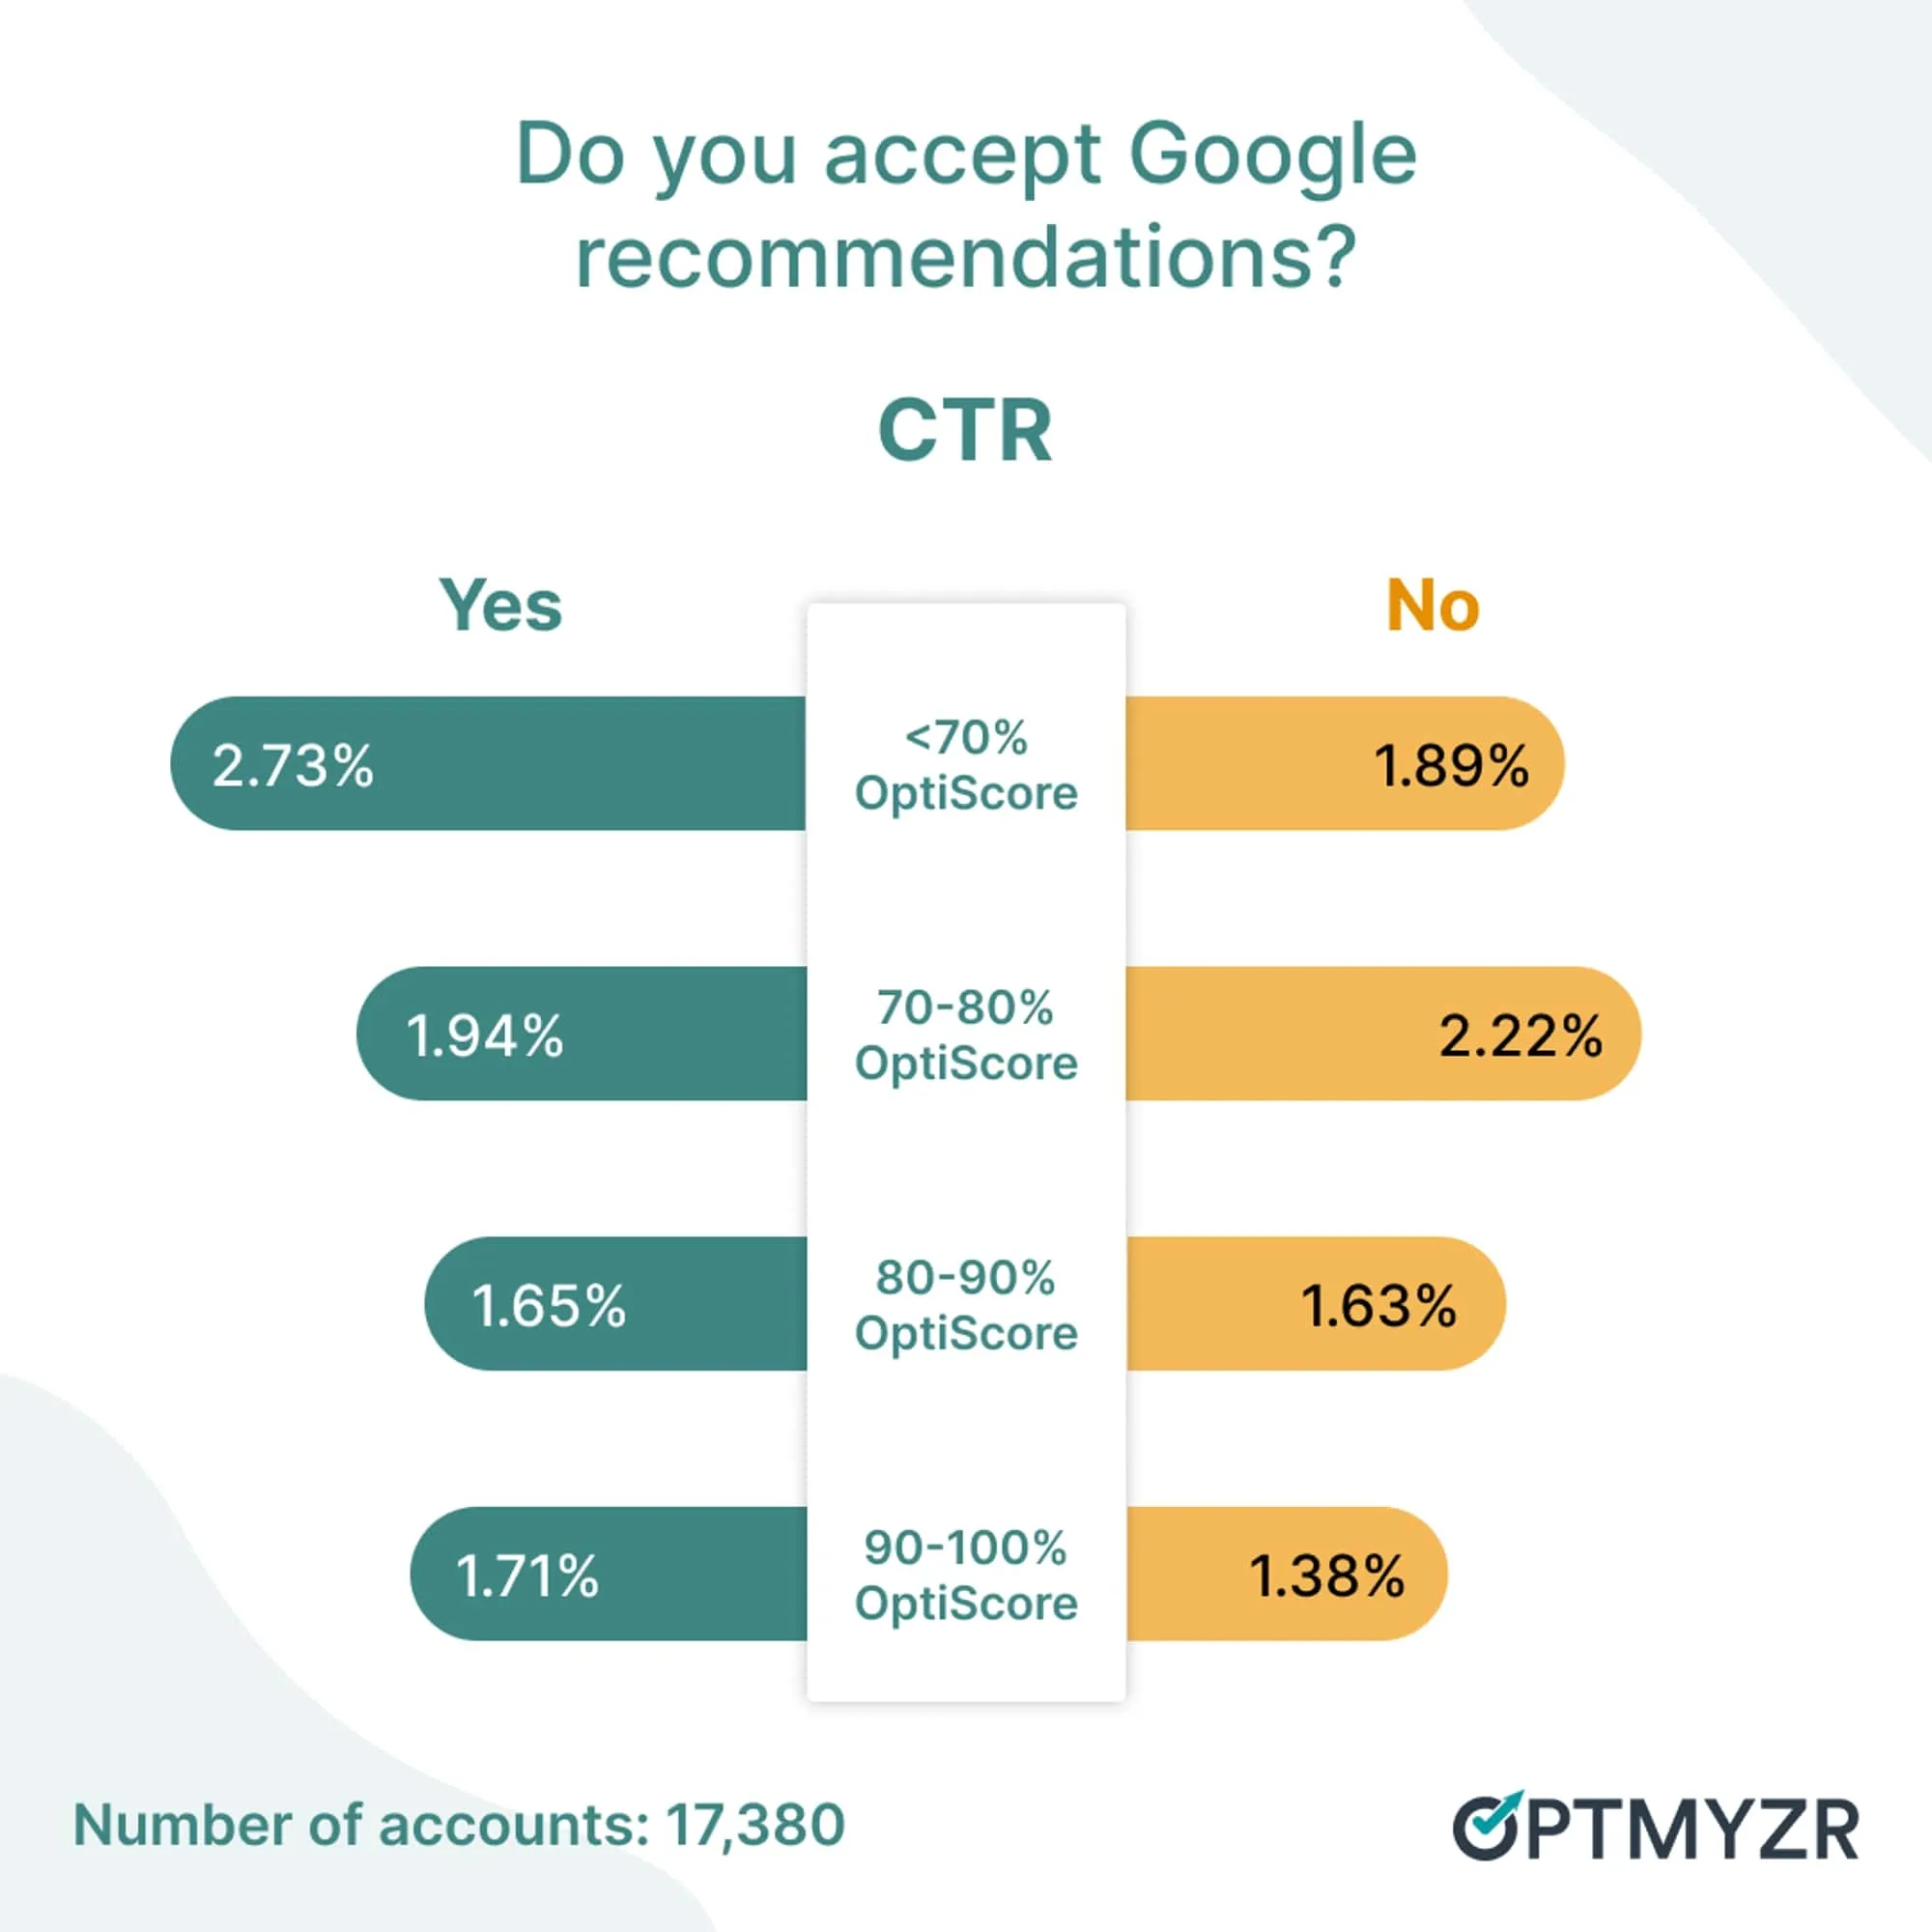
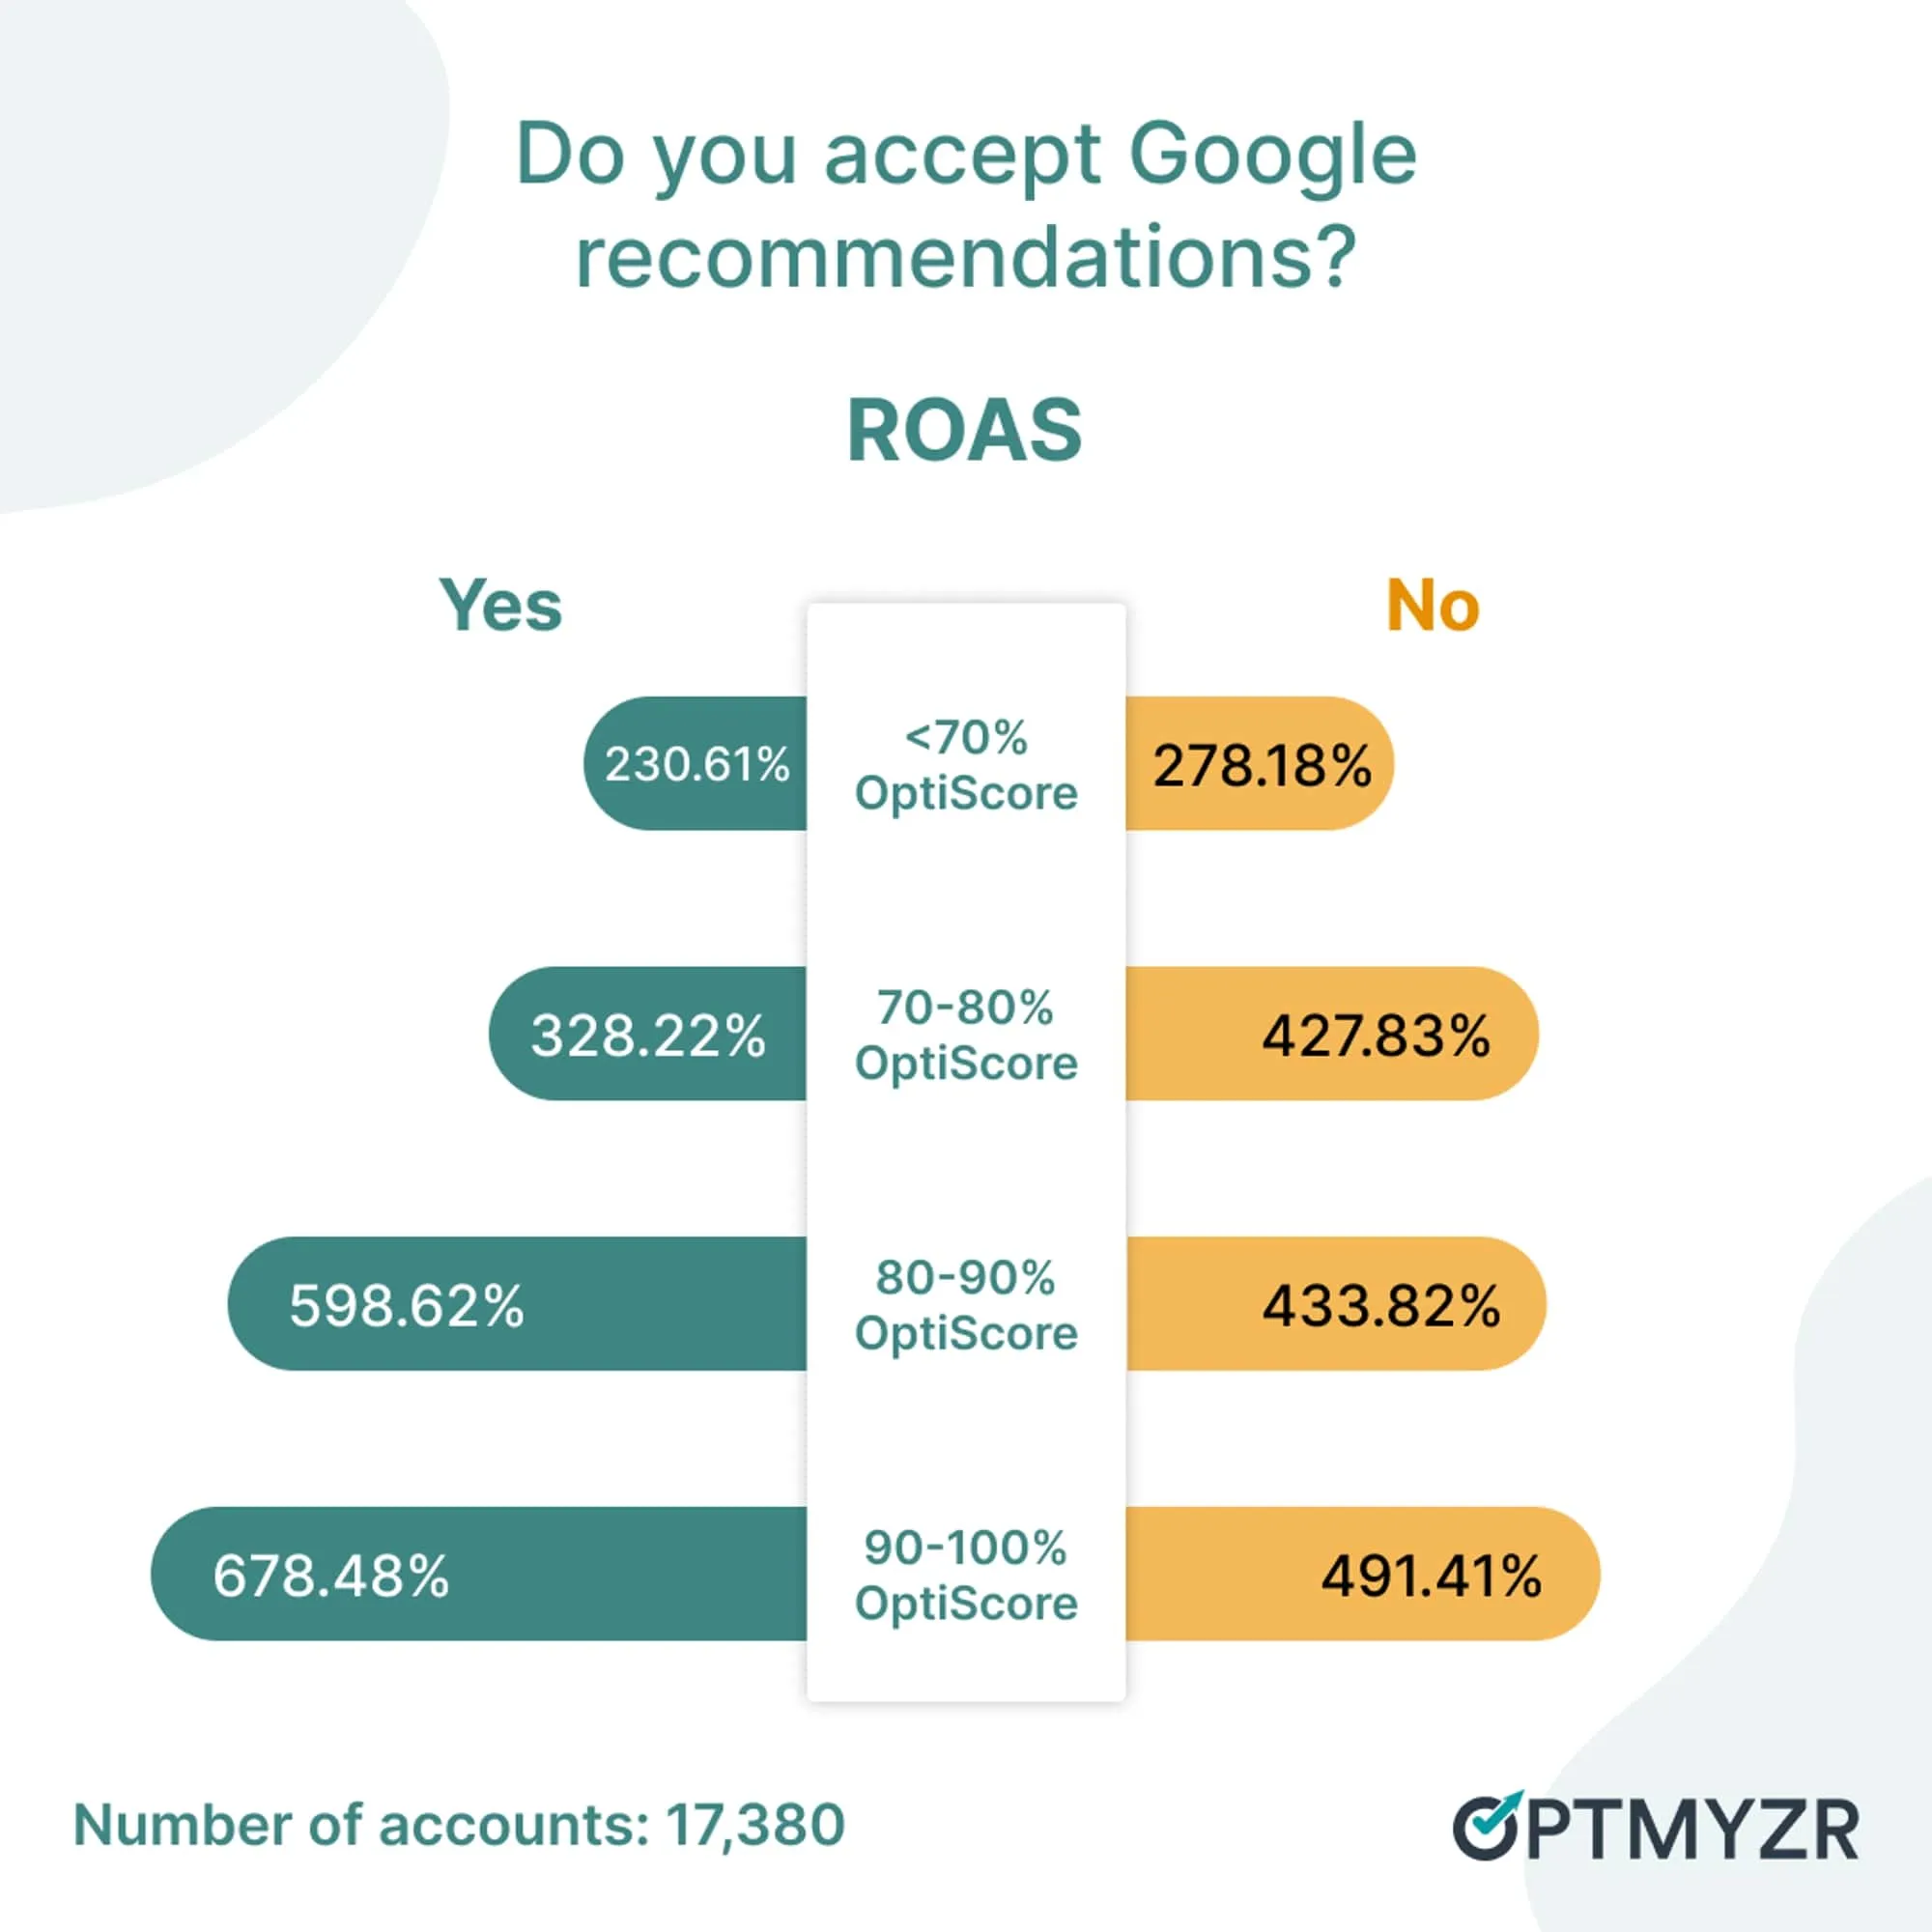
On July 23, 2025, Amazon abruptly pulled all its ads from Google shopping. The move disrupted the paid search ecosystem almost overnight. As one of Google’s biggest and savviest advertisers, Amazon’s exit gave us a rare look at what happens when a major player disappears from the auction.
At Optmyzr, we analyzed data from thousands of advertiser accounts to understand the immediate impact. The results challenge a familiar belief: that less competition means better outcomes. They also offer lessons for brands adjusting to sudden market shifts.
Amazon didn’t wind things down or test a new strategy. They pulled out of Google shopping ads completely and without warning. That created a rare chance to see how Google’s ad auctions respond when a major bidder suddenly vanishes.
In Google’s auction system, advertisers compete in real-time for ad placements based on their bids, ad quality, and expected impact. When a major player like Amazon exits, they don’t just free up a few ad slots. Their absence reshapes the competitive landscape across every keyword, audience, and placement they used to touch.
Our analysis methodology
To isolate the true impact of Amazon’s departure from seasonal effects, we used a precise 7-day comparison methodology with the strictest account matching criteria:
Study period: July 16-22, 2025 vs July 23-29, 2025 Why this matters: We skipped Prime Day (July 8–11) and balanced the weekdays across both weeks. Dataset: Perfect account matching with identical advertiser pools in both periods Requirements:
Accounts must have 3+ days overall in both periods
Accounts must appear in the same shopping ads category in both periods
Accounts must have 3+ days within that category in both periods
This clean comparison lets us tie changes to Amazon’s exit rather than promotional calendar effects, day-of-week variations, or account churn.
Caveats: Conversion lag in ecommerce
Some ecommerce categories have longer paths to purchase. This means part of the conversion value may not have shown up in our initial 7-day window. A lower observed conversion value doesn’t always mean poor performance — it might just reflect a time lag.
To account for this, we’ll re-run the study using the same time window but pull data 30 days later. That way, we can measure any additional revenue that accrues over time and ensure the findings reflect true long-term performance.
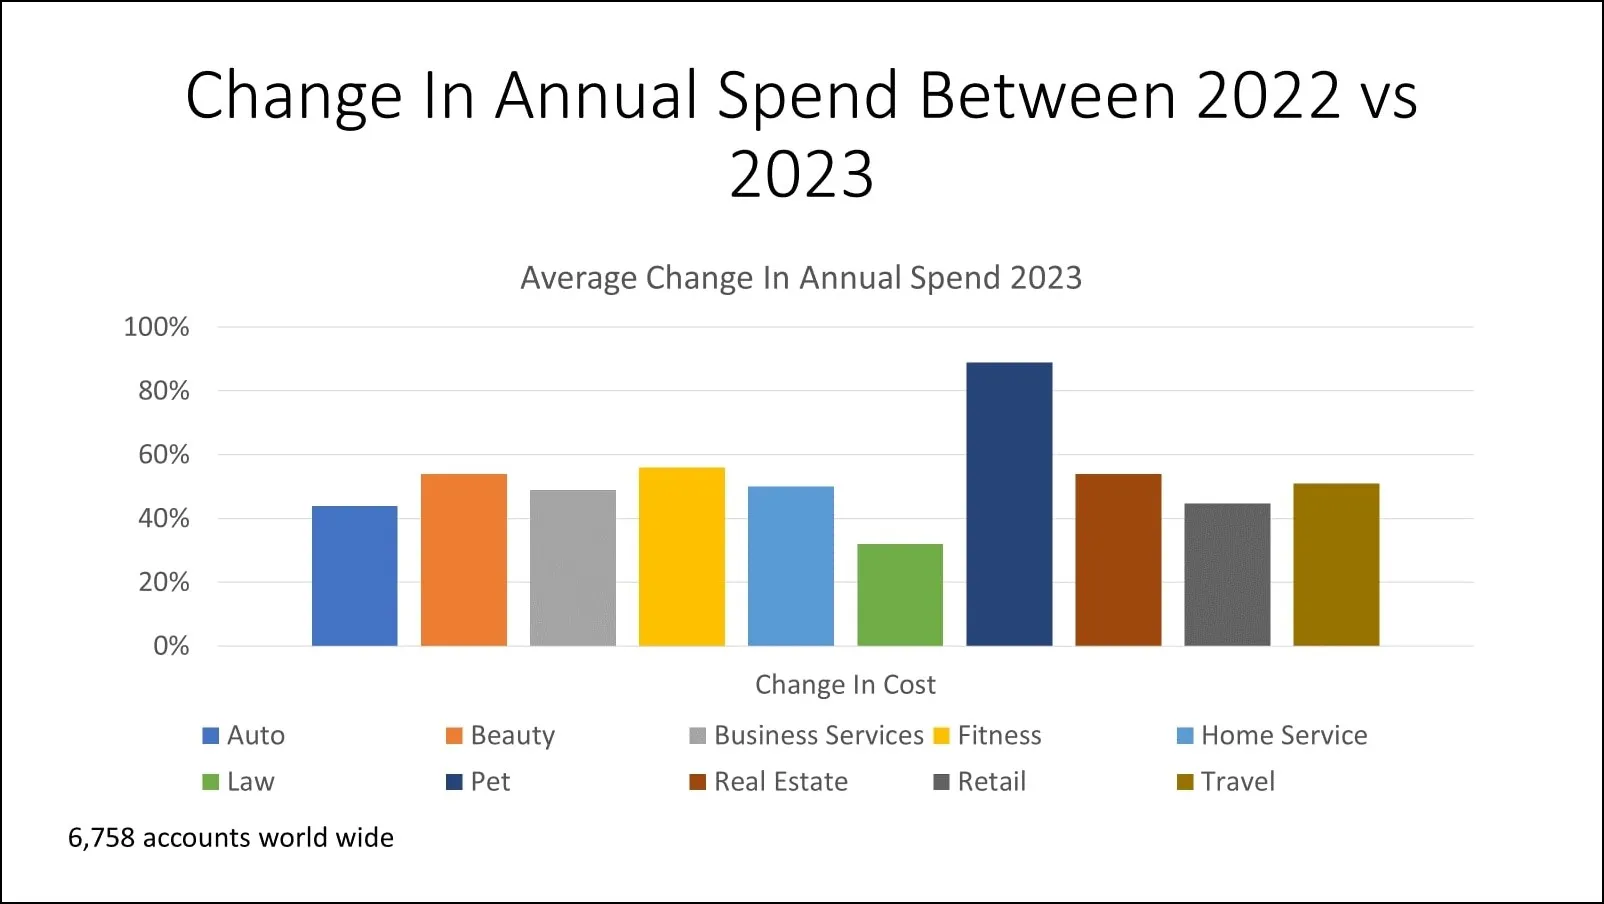
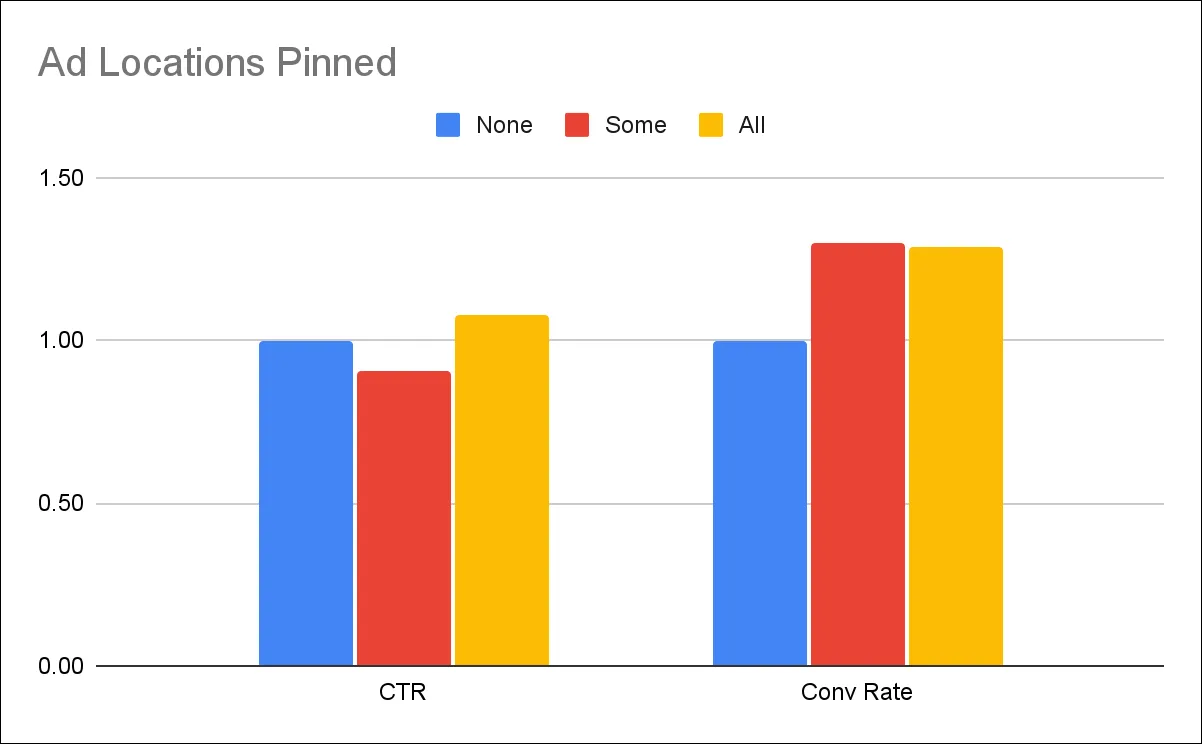
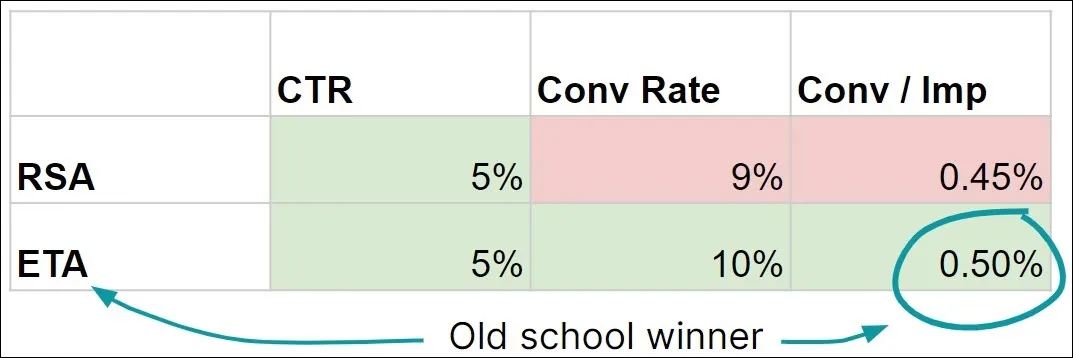
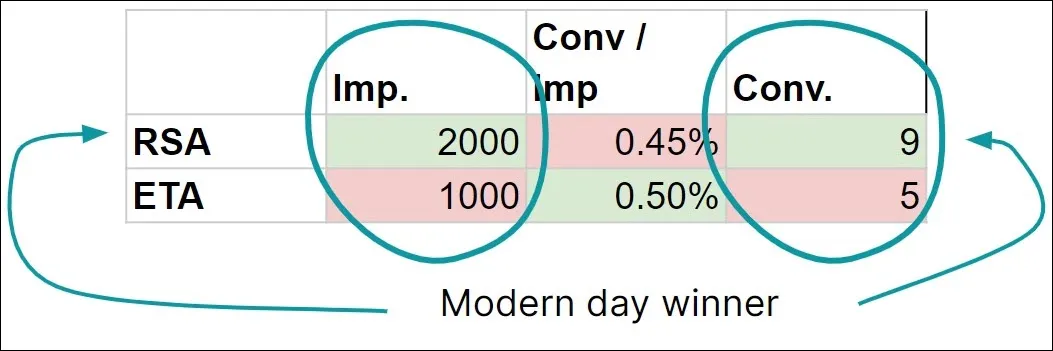
Overall market impact: More volume, less value
The data tells a surprising story: less competition doesn’t always help the advertisers left behind.
Key Insight: Advertisers got more clicks for less money, but the value of those clicks dropped. It suggests many of those extra clicks came from people looking for Amazon. When they landed on competitor ads, they brought expectations around price, shipping, and convenience that few brands could match.
The consumer expectation trap
The standout insight: volume went up, but value went down. Advertisers saw:
8.3% lower CPCs — looks good on the surface
7.8% more clicks — more traffic, more chances
5.5% drop in conversion value — less revenue from that extra traffic
The pattern points to buyer behavior. Shoppers looking for Amazon clicked elsewhere, but still expected Amazon-level pricing, speed, and ease. When competitors couldn’t match these expectations, conversion rates and values suffered.
For PPC managers, this highlights the danger of the “volume trap”—celebrating increased traffic without considering whether that traffic genuinely aligns with your value proposition.
Category-by-category breakdown: Winners and losers
The impact varied dramatically across different industry verticals, revealing which types of businesses were best positioned to capitalize on Amazon’s departure.
Electronics: The clear winner
Electronics brands were best positioned to gain from Amazon’s exit. Big players like Best Buy and Apple can compete on the same things Amazon excels at: fast delivery, strong pricing, and trusted fulfillment.
Electronics was the only major category to see increases across all key value metrics: conversions (+81.3%), conversion value (+10.9%), and ROAS (+7.1%).
Despite a moderate increase in impressions (+11.4%) and clicks (+11.5%), these advertisers successfully converted the Amazon-displaced traffic at higher rates and values, likely because they could satisfy consumers’ expectations for fast, convenient delivery and competitive pricing.
Home & Garden: The volume puzzle
Home & Garden presents an interesting case study in the volume trap phenomenon, with significant traffic increases but declining value metrics.
The pattern—significant click growth (+13.1%) and stable cost (+0.2%) but declining conversion value (-7.5%) and ROAS (-7.7%)—suggests Amazon-seeking consumers found home & garden alternatives but made lower-value purchases or were more price-sensitive than typical customers.
Sporting Goods: The volume trap exemplified
Sporting Goods represents perhaps the clearest example of the “volume trap” phenomenon we’ve been describing.
This category saw substantial conversion volume increases (+20.7%) and improved conversion rates (+15.7%) with minimal traffic growth (+4.3% clicks), yet experienced significant value decline (-9.9%) and ROAS deterioration (-8.0%).
Likely explanation: shoppers landed on competitor sites, but bought cheaper gear or held back due to price.
Health & Beauty: Stable volume, flat value
Health & Beauty brands picked up the extra traffic, but couldn’t hold onto revenue per sale.
Despite achieving 14.6% more conversions from Amazon-displaced traffic, conversion value remained essentially flat (+0.3%). Translation: those new conversions were worth a lot less than usual. If quality stayed the same, revenue should have risen in lockstep. But thanks to new clicks being cheaper (-11.5%), ROAS slightly rose (+1.1%).
Tools and Hardware: Similar consumer expectation challenges
Tools and Hardware followed the same pattern as Sporting Goods — more conversions, but lower value.
Like Sporting Goods, this category captured significantly more Amazon-displaced conversions (+14.7%) with improved conversion rates (+7.1%) but struggled to extract the same value per conversion (-6.3% value, -5.9% ROAS), likely due to consumer expectations around pricing and convenience that Amazon had established.
Vehicles & Parts: High-value category decline
Vehicles & Parts showed concerning trends across both volume and value metrics.
Despite modest click growth (+4.8%) and reduced costs (-5.3%), the category experienced declining conversion value (-5.3%), suggesting that Amazon-seeking consumers in this category had different purchase behaviors or price expectations. But like Health & Beauty, the reduction in CPC (-9.6%) helped protect the ROAS (+0.1%)
Apparel & Accessories: Large volume, declining value
As the largest category by volume, Apparel & Accessories demonstrates the volume trap at scale.
Despite representing the largest volume of traffic, Apparel & Accessories saw declining performance across key metrics, with conversion value dropping 9.5% and ROAS declining 7.3%. This suggests that Amazon-seeking fashion consumers had strong expectations around pricing, selection, and return policies that competitors struggled to match.
Arts & Entertainment: The content value challenge
Arts & Entertainment showed mixed results, with increased traffic but declining conversion metrics.
This category achieved significant click growth (+15.4%) but saw concerning declines in conversion rate (-19.9%) and ROAS (-8.3%), suggesting that displaced Amazon traffic in entertainment categories had different engagement patterns or value expectations.
Furniture: Stable volume, value concerns
Furniture presents an interesting anomaly with stable click volume but declining conversion value.
The pattern—stable clicks (+0.8%) and conversion volume (+2.0%) but dramatically lower conversion value (-11.7%) and ROAS (-8.8%)—suggests a fundamental shift in purchase behavior. Despite reduced costs, the significant value decline indicates consumers may have been purchasing lower-priced items or single pieces rather than complete furniture sets.
What this means for your Google Ads strategy
Different categories reacted in different ways — but the patterns offer clear takeaways for PPC teams:
1. Assess your competitive position against Amazon’s value proposition
Electronics succeeded because major players like Best Buy and Apple can match Amazon’s delivery speed and pricing. In contrast, most other categories saw the classic “volume trap”—more traffic but less value as Amazon-seeking consumers brought different expectations.
2. Recognize the volume trap early
Categories like Sporting Goods (+20.7% conversions, -9.9% value) and Health & Beauty (+14.6% conversions, +0.3% value) show how increased traffic can mask underlying performance degradation. Always track value, not just volume.
3. Learn from true success vs. volume traps
Only Electronics truly succeeded with positive conversion value (+10.9%) and ROAS growth (+7.1%). Everyone else hit some version of the volume trap — more clicks, but less to show for it.
4. Understand your category’s vulnerability
If you compete on Amazon’s turf — price, speed, convenience — you’re more exposed. The data shows widespread expectation mismatches across these categories.
5. Focus on sustainable competitive advantages
Rather than simply trying to capture displaced Amazon traffic, develop positioning that attracts consumers who genuinely value your specific offerings.
Why displaced traffic isn’t free traffic
Amazon’s exit highlights something critical: traffic doesn’t shift cleanly when a dominant player leaves. It drags along expectations most brands can’t meet — fast shipping, low prices, and frictionless buying.
That creates the volume trap: cheaper clicks, more traffic, and worse results. Unless you can actually match Amazon’s offer, you’ll struggle to turn those clicks into value.
For the Google Ads ecosystem, this suggests that major ecommerce advertisers play a crucial role not just in competing for inventory, but in training and conditioning consumer expectations. When they leave, shoppers don’t reset. They carry their shaped expectations into your funnel, whether you can meet them or not.
Takeaways for PPC advertisers
What PPC managers should take from all this:
Distinguish true success from volume traps
Only Electronics achieved both volume and value growth. Most categories experienced some form of the volume trap with declining efficiency.
Monitor ROAS alongside conversion metrics
Flat or growing conversion volume can hide declining profitability if conversion values decline or costs increase.
Evaluate displaced traffic quality
Amazon-seeking consumers bring specific expectations that most categories couldn’t meet profitably, leading to either lower conversion values or conversion rate declines.
Consider lifetime value implications
The only justification for accepting lower immediate ROAS is if the additional traffic represents new customers with strong repeat purchase potential.
Focus on sustainable differentiation
The successful Electronics category could match Amazon’s value proposition, while others struggled when competing on Amazon’s core strengths.
Displaced traffic isn’t neutral — it’s shaped by the brand that left. And unless you can meet those expectations or grow LTV fast, it’s traffic you’ll struggle to monetize.
When Google launched Performance Max (PMax), it was positioned as the ultimate automated campaign, designed to unify and optimize ads across all of Google’s channels: Search, Shopping, YouTube, Display, and more.
But as many advertisers have found, adding PMax to the mix isn’t always additive. In fact, it might be quietly cannibalizing the performance of your most valuable Search campaigns.
At Optmyzr, we wanted to know just how often this happens and how much impact it has. So we dug into performance data from hundreds of accounts to see where and when PMax overlaps with Search.
The results might surprise you…
Why we ran this study
Advertisers love the control and predictability of Search campaigns. Performance Max, on the other hand, provides less control and is, by design, more opaque.
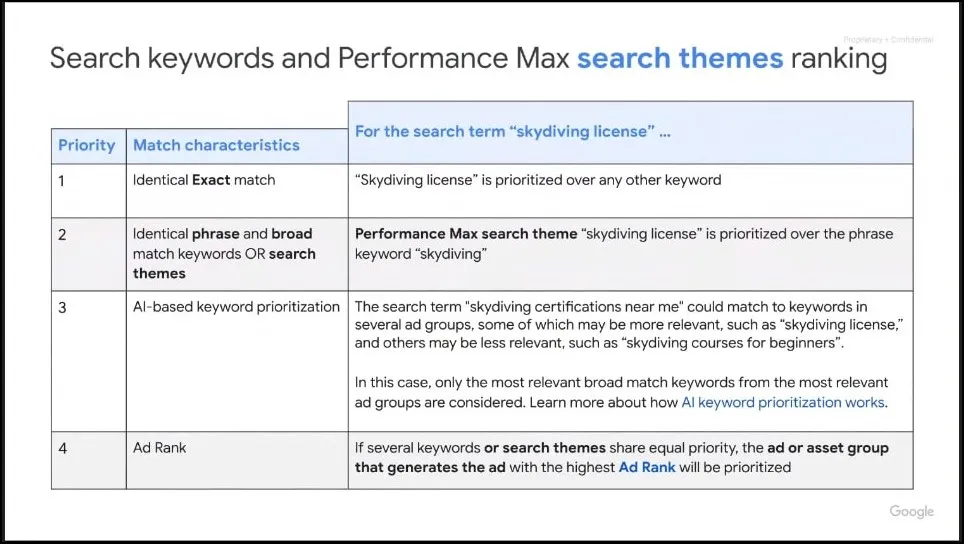
However, advertisers are encouraged to use both campaign types in tandem, with Google advising that the keywords added to a search campaign should nearly always take precedence over the automated matching done by PMax. They even tell us, “If the user’s query is identical to an exact match keyword in your Search campaign, the Search campaign will be prioritized over Performance Max.”
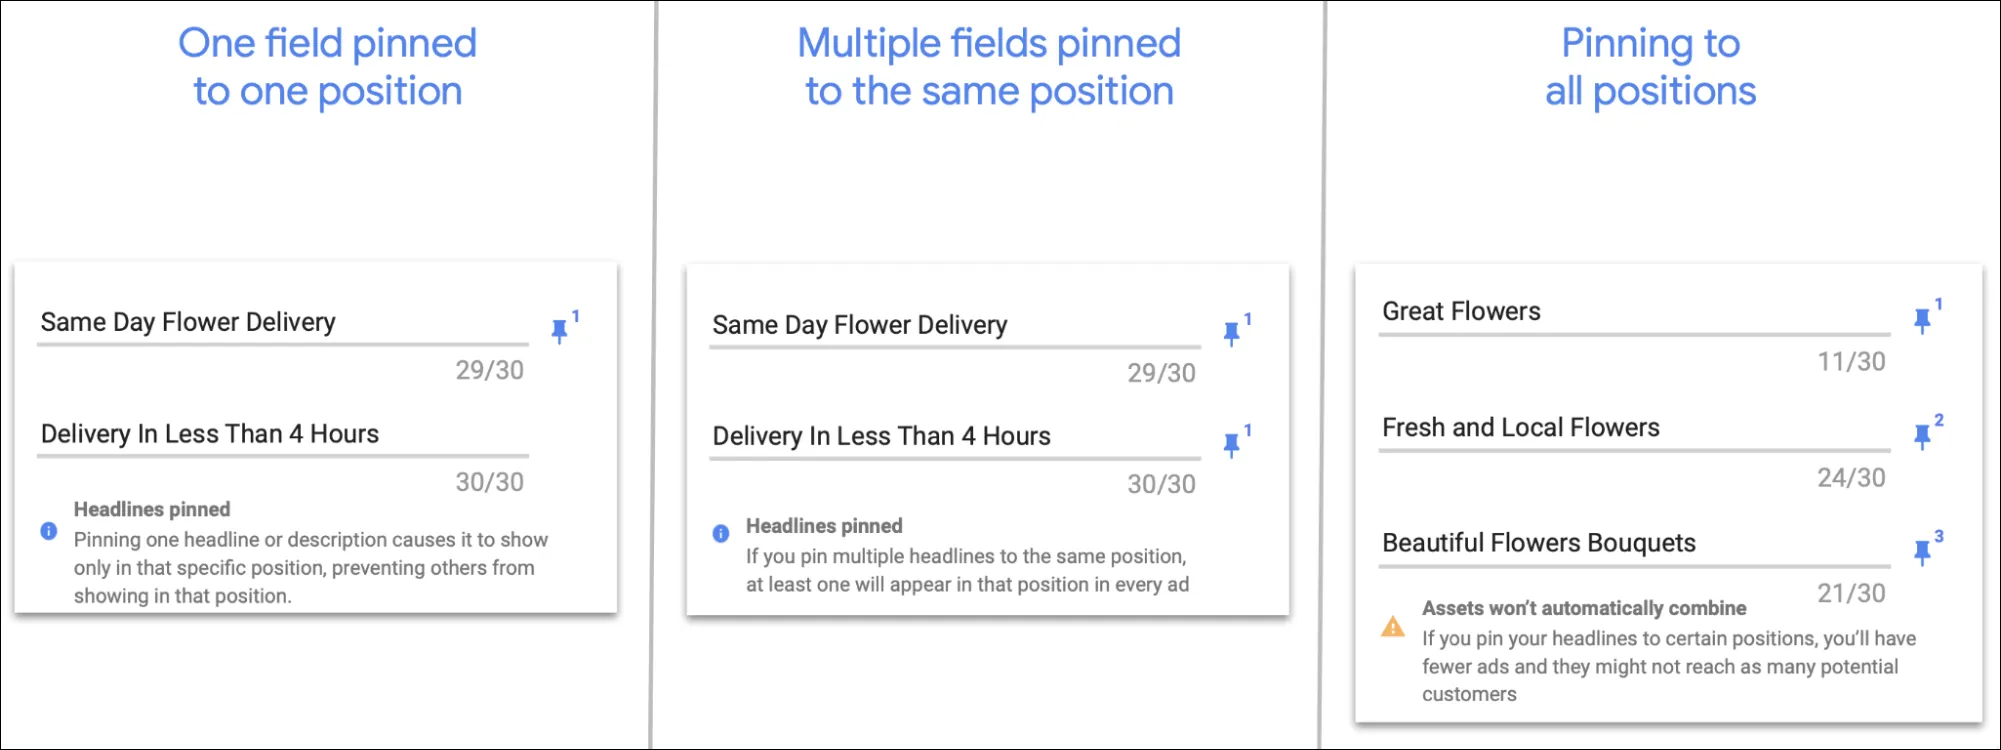
Scenarios 1-3 in the following table illustrate what that prioritization is supposed to look like.
Prioritization of Ad Serving When Search and Performance Max Compete
Scenario
Keyword
Keyword Match Type
Search Term
Which campaign serves the ad?
Why?
1
Flowers
Exact
Flowers
Search campaign is prioritized
The keyword text is the exact same as the search term text
2
Flowers
Phrase
Flowers
Search campaign is prioritized
The keyword text is the exact same as the search term text
3
Flowers
Broad
Flowers
Search campaign is prioritized
The keyword text is the exact same as the search term text
4
Flowers
Phrase
Flowers Near Me
Depends - Campaign with better ad rank wins
The keyword and search term text are different
5
Flowers
Broad
Deliver Roses
Depends - Campaign with better ad rank wins
The keyword and search term text are different
Scenarios 4 and 5 show what happens when a keyword with the same text as the query doesn’t exist in the search campaign, but a broad or phrase match could have triggered the ad. In those scenarios, auction-time signals are used to decide whether to serve an ad from Search or PMax.
But in practice, many advertisers suspect that PMax is crowding out their Search campaigns, even for keywords they specifically target. They suspect that what actually happens is different from what is explained in the table of what is intended to happen.
So we set out to answer key questions like:
How often does the PMax campaign show an ad for a keyword that exists in a search campaign?
Are the same search terms showing up in both PMax and Search?
Does this overlap happen across all match types?
Which campaign delivers better performance when there is an overlap?
How we ran our search term overlap study
For this study, we reviewed data from February 1 to February 28, 2025, across 503 accounts managed in Optmyzr.
Our analysis had two parts:
Part 1: Exact keyword overlap
We looked for keywords in Search campaigns that also appeared in the PMax search terms report, indicating that PMax triggered ads for keywords explicitly targeted in the advertiser’s Search campaign.
Here’s what that looks like in reports we pulled:
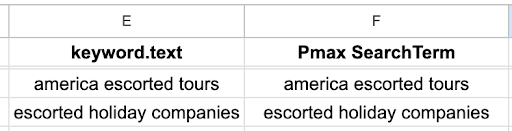
A sample from the data we pulled shows when a search campaign’s keyword text is exactly the same as the search term’s text that triggered a PMax ad.
Note that the text of the keyword is the exact same as the text of the search term that triggered the PMax campaign to show an ad. The keyword match type doesn’t matter; we just check that the text is an exact match.
In our table of scenarios, this would correspond to scenarios 1, 2, or 3.
Part 2: Search term overlap
We checked for search terms that showed up in both PMax and Search campaign reports, and that were not exact matches for an existing search campaign keyword. This indicates that the search campaign contained relevant keywords that could have shown the ad, but sometimes the PMax campaign won the auction and showed the ad for that query.
In our table of scenarios, this would correspond to scenarios 4 or 5.
In both parts, we compared performance for CTR and Conversion Rate. We defined performance differences as “insignificant” if they were under 10% different. We did not include CPC, CPA, and ROAS because Google did not report cost data for PMax search terms at the time of our analysis.
The findings: Keyword overlap is real
When a search campaign contains a keyword whose text matches the search term exactly, Google says the search campaign should be prioritized. What we observed indicates that this prioritization is not what advertisers would expect, and Performance Max frequently cannibalizes the search keyword.
The reason could be that the search campaign was ineligible to show an ad due to targeting or budget constraints. We did not analyze that possibility in this study.
Prevalence of Performance Max cannibalizing search keywords
Accounts: 91.45% of 503 accounts had keyword overlap between Search and PMax.
Campaigns: 56.29% of 5,768 Search campaigns showed this overlap.
Ad Groups: 27.86% of 40,642 ad groups were impacted.
The overlap was identified for all match types, including exact match keywords. So, having a keyword with the exact text of a search term, and making it an exact match keyword, does not guarantee that the overlap won’t happen.
Performance difference when Performance Max cannibalizes search keywords
Ultimately, advertisers care about performance and would likely not complain if Google’s automation did something that led to better financial outcomes for their campaign.
Unfortunately, it’s not possible to measure ROAS differences because PMax campaigns don’t report revenue data at the search term level. So we analyzed two important metrics for which data is available: CTR and conversion rate.
CTR results:
Search campaign performed better: 28.37%
Performance Max campaign performed better: 15.98%
No significant difference: 55.65%
Conversion rate:
Search outperformed PMax: 18.91%
PMax outperformed Search: 6.17%
No significant difference: 74.92%
Takeaway
In most cases, when PMax overlaps with existing search keywords, the performance difference is not significant. However, when the difference exceeded 10%, the search campaign was more often the campaign type with the better performance.
Search term overlap between PMax and search campaigns
This is part 2 of the study. There was also an overlap between Performance Max and Search campaigns when there was no keyword that matched the search query exactly.
This was expected and aligns with Google’s guidance that Ad Rank is the determining factor in these instances. We measured how often this type of overlap exists and how the performance differs.
Accounts: 97.26% of 511 accounts had search term overlap.
Search Campaigns: 76.17% showed overlap with PMax.
PMax Campaigns: 97.40% overlapped with Search campaigns.
Performance difference when Performance Max and search overlap
CTR (424,820 search terms analyzed):
Search won: 32.37%
PMax won: 24.21%
No significant difference: 43.42%
Conversion rate:
Search better: 7.66%
PMax better: 4.32%
No significant difference: 88.03%
Takeaway
Overlap is nearly universal, but performance differences are usually minor. But again, when there is a difference greater than 10%, Search is more likely to be the better-performing campaign type.
Why this matters: Efficiency and control
When PMax runs alongside Search and targets the same queries, it creates internal competition. That means:
You might pay more for clicks that Search could have delivered more efficiently.
You lose control over which creative or audience drove results.
You can’t fine-tune performance as easily because PMax aggregates reporting across channels.
And while PMax is supposed to avoid this overlap, our data shows otherwise.
What advertisers should do
If your Search campaigns are losing impressions to PMax, you’re not alone, and you’re not powerless. The key is to understand that cannibalization isn’t just a function of overlapping keywords. It often happens because your Search campaign becomes ineligible to serve ads in the first place.
That ineligibility can stem from mismatches in location targeting, ad schedules, audience exclusions, or budget constraints. For instance, if your Search campaign doesn’t have enough daily budget to stay active or is limited by a narrower geographic focus, Google won’t even enter it into the auction, leaving PMax to pick up the traffic by default.
To protect your Search performance and regain control:
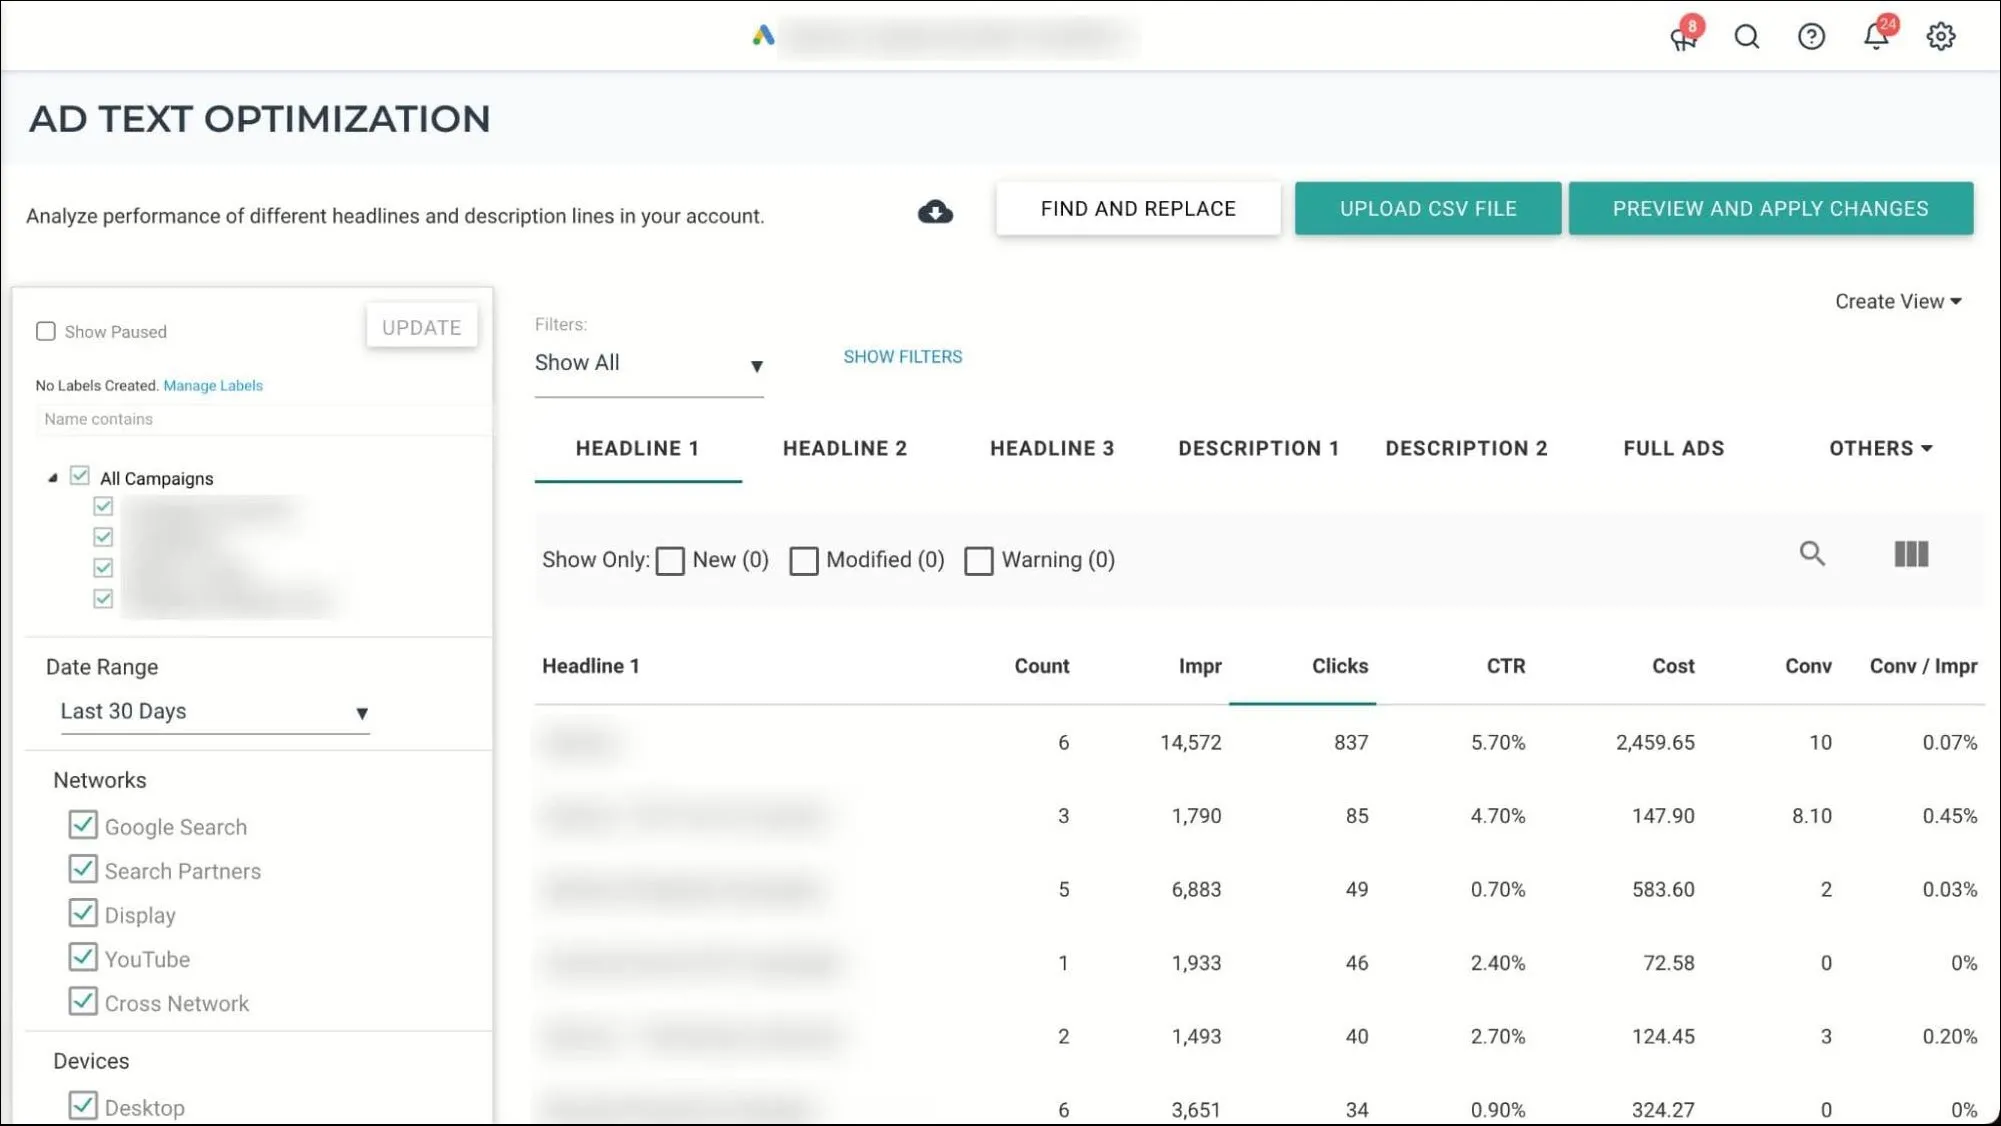
Use Search Term Insights (e.g., from Optmyzr) to identify where PMax overlaps with Search. When you find converting terms in PMax that aren’t in your Search campaigns, add them as exact match keywords to shift priority back to Search.
Align your campaign settings — check your targeting, bids, and budgets — so Search campaigns remain eligible across the full range of impressions you want to capture.
Turn off auto-apply recommendations that remove “redundant” or “non-serving” keywords. These automated changes often strip your campaigns of the very keywords that protect them from PMax encroachment.
Add branded misspellings as exact match keywords to Search. Even with brand exclusions enabled, PMax can still trigger ads for fuzzy matches that dilute your brand’s performance data.
Remember, PMax thrives when there’s a gap, either in eligibility, bid competitiveness, or keyword coverage. Your job is to close those gaps. Use PMax where it performs best: as a complement to your Search campaigns, not a replacement for them.
Final thoughts
Performance Max can be powerful, but only when it complements, not competes with, your Search campaigns. As this study shows, Google automation’s promise still needs human oversight to reach its full potential.
Search campaigns give you control. PMax gives you scale. But only when you manage both thoughtfully can you truly maximize performance.
One of the first things you notice when managing Amazon Ads is that the data doesn’t settle right away. Clicks and costs show up fast, but conversions, sales, and impressions take longer to update. And those are the metrics that drive strategy.
That’s a problem.
Advertisers rely on timely data to make decisions. If you’re managing budgets or evaluating ROAS based on a snapshot that’s still shifting, you could be pausing profitable campaigns or under-crediting what’s actually working.
At Optmyzr, we decided to measure just how delayed Amazon Ads reporting really is. We looked at how much performance data changed over time, how often that change was significant, and what marketers can do to avoid making the wrong call too soon.
Here’s what we found.
What is Data Delay on Amazon ads?
Amazon Ads data delay refers to the lag between when an event (like an ad click or sale) occurs and when it gets fully reported in the Amazon Ads console or API. According to Amazon, it can take up to 14 days for conversion and sales data to settle, while metrics like impressions can also take time to complete.
Why is this important to understand?
Advertisers rely on timely data to:
Optimize budgets
Adjust bids
Evaluate ROAS and profitability
If that data is still in flux, there’s a risk of making decisions based on a faulty snapshot, like turning off a high-performing campaign or under-crediting a successful tactic. For advertisers managing across platforms, Amazon’s delay creates a blind spot that’s easy to overlook but hard to ignore.
What we analyzed in our study
We ran a deep dive analysis using internal platform data from campaigns running on February 10, 2025. We pulled Amazon Ads performance data for that day repeatedly over the next 17 days, assuming the snapshot on February 27 was the most complete.
Our analysis included:
302 Amazon Ads accounts
14 global marketplaces
14,991 campaigns
79 unique users
Metrics tracked:
Impressions
Clicks
Cost
Attributed Conversions (14-day window)
Attributed Sales (14-day window)
What we learned from the data
The results were eye-opening, especially when you zoom in on the campaigns most affected by Amazon’s reporting delays.
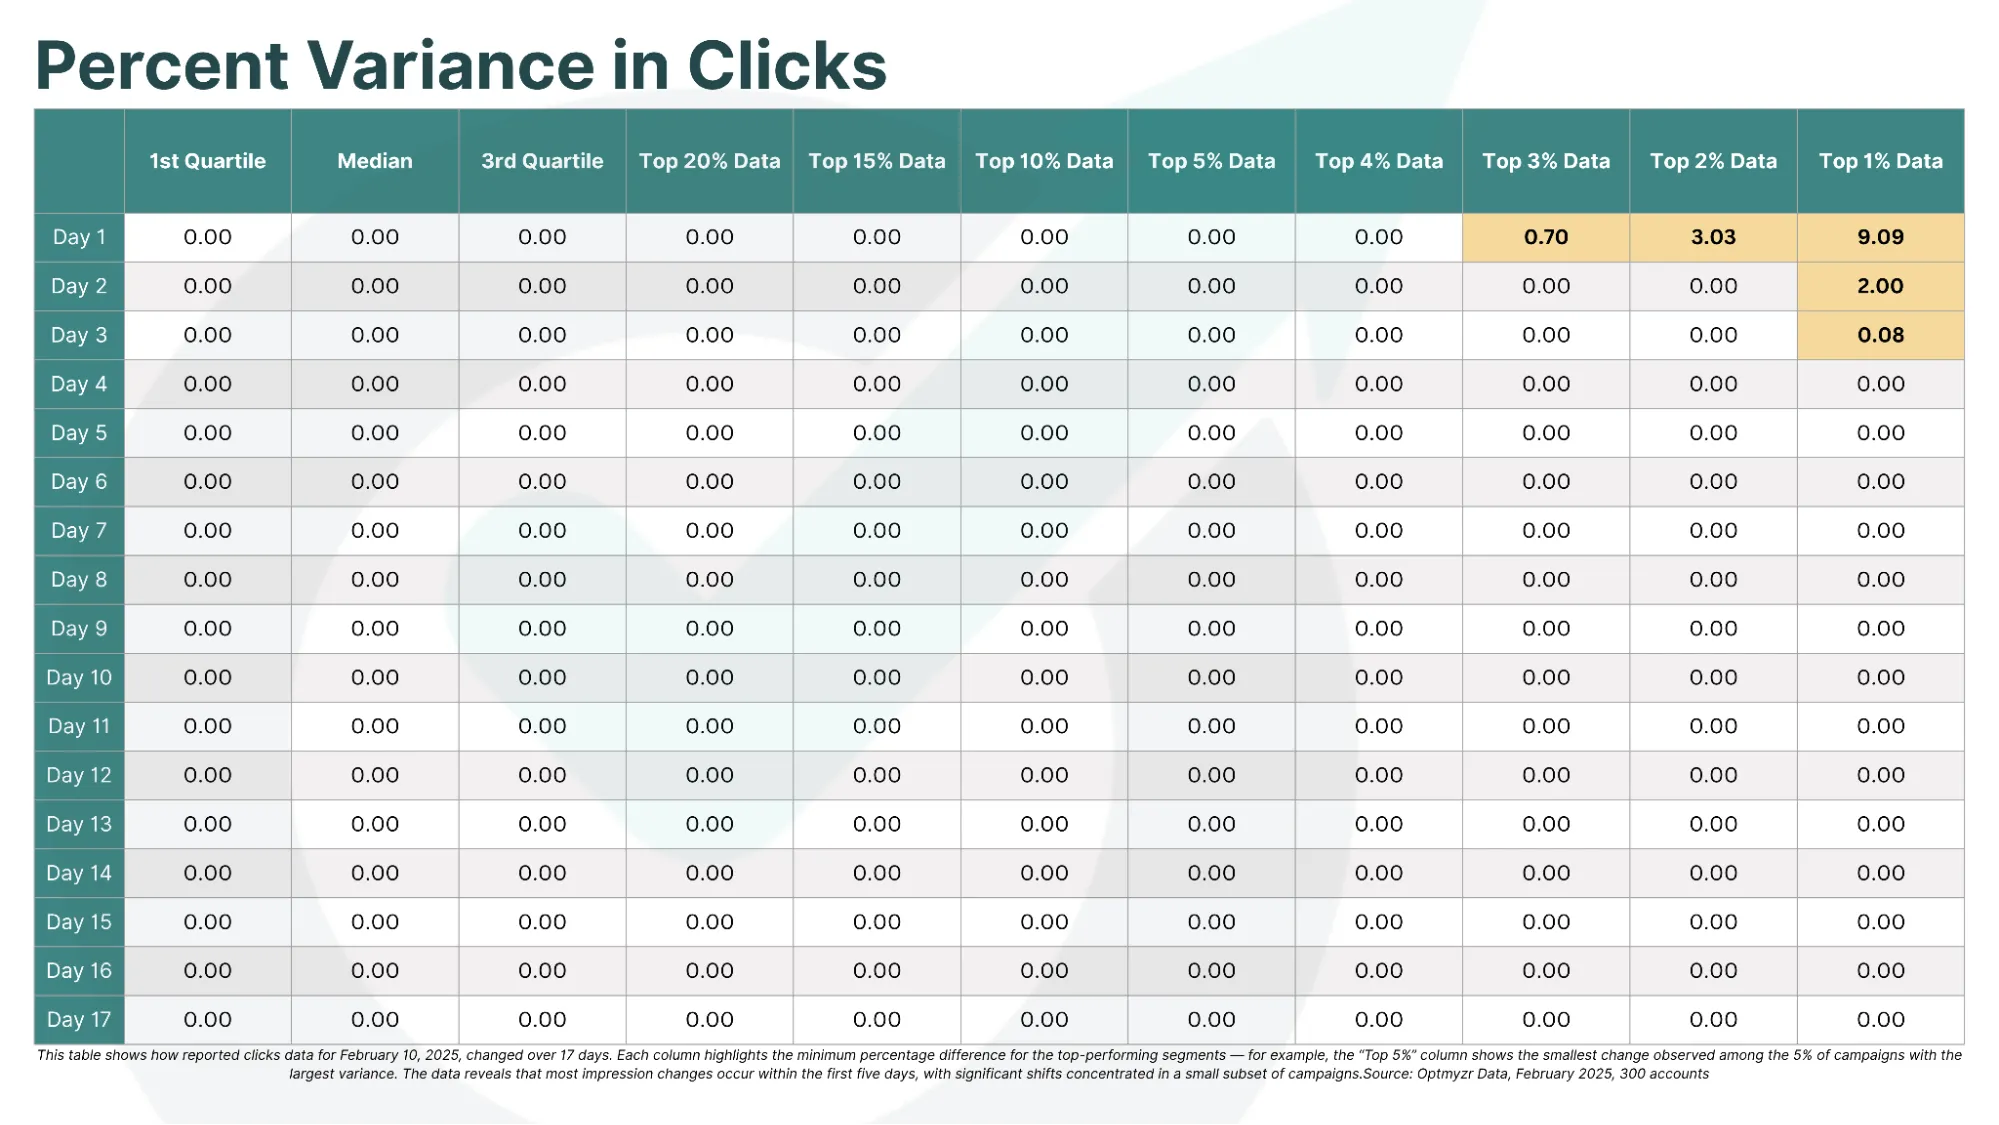
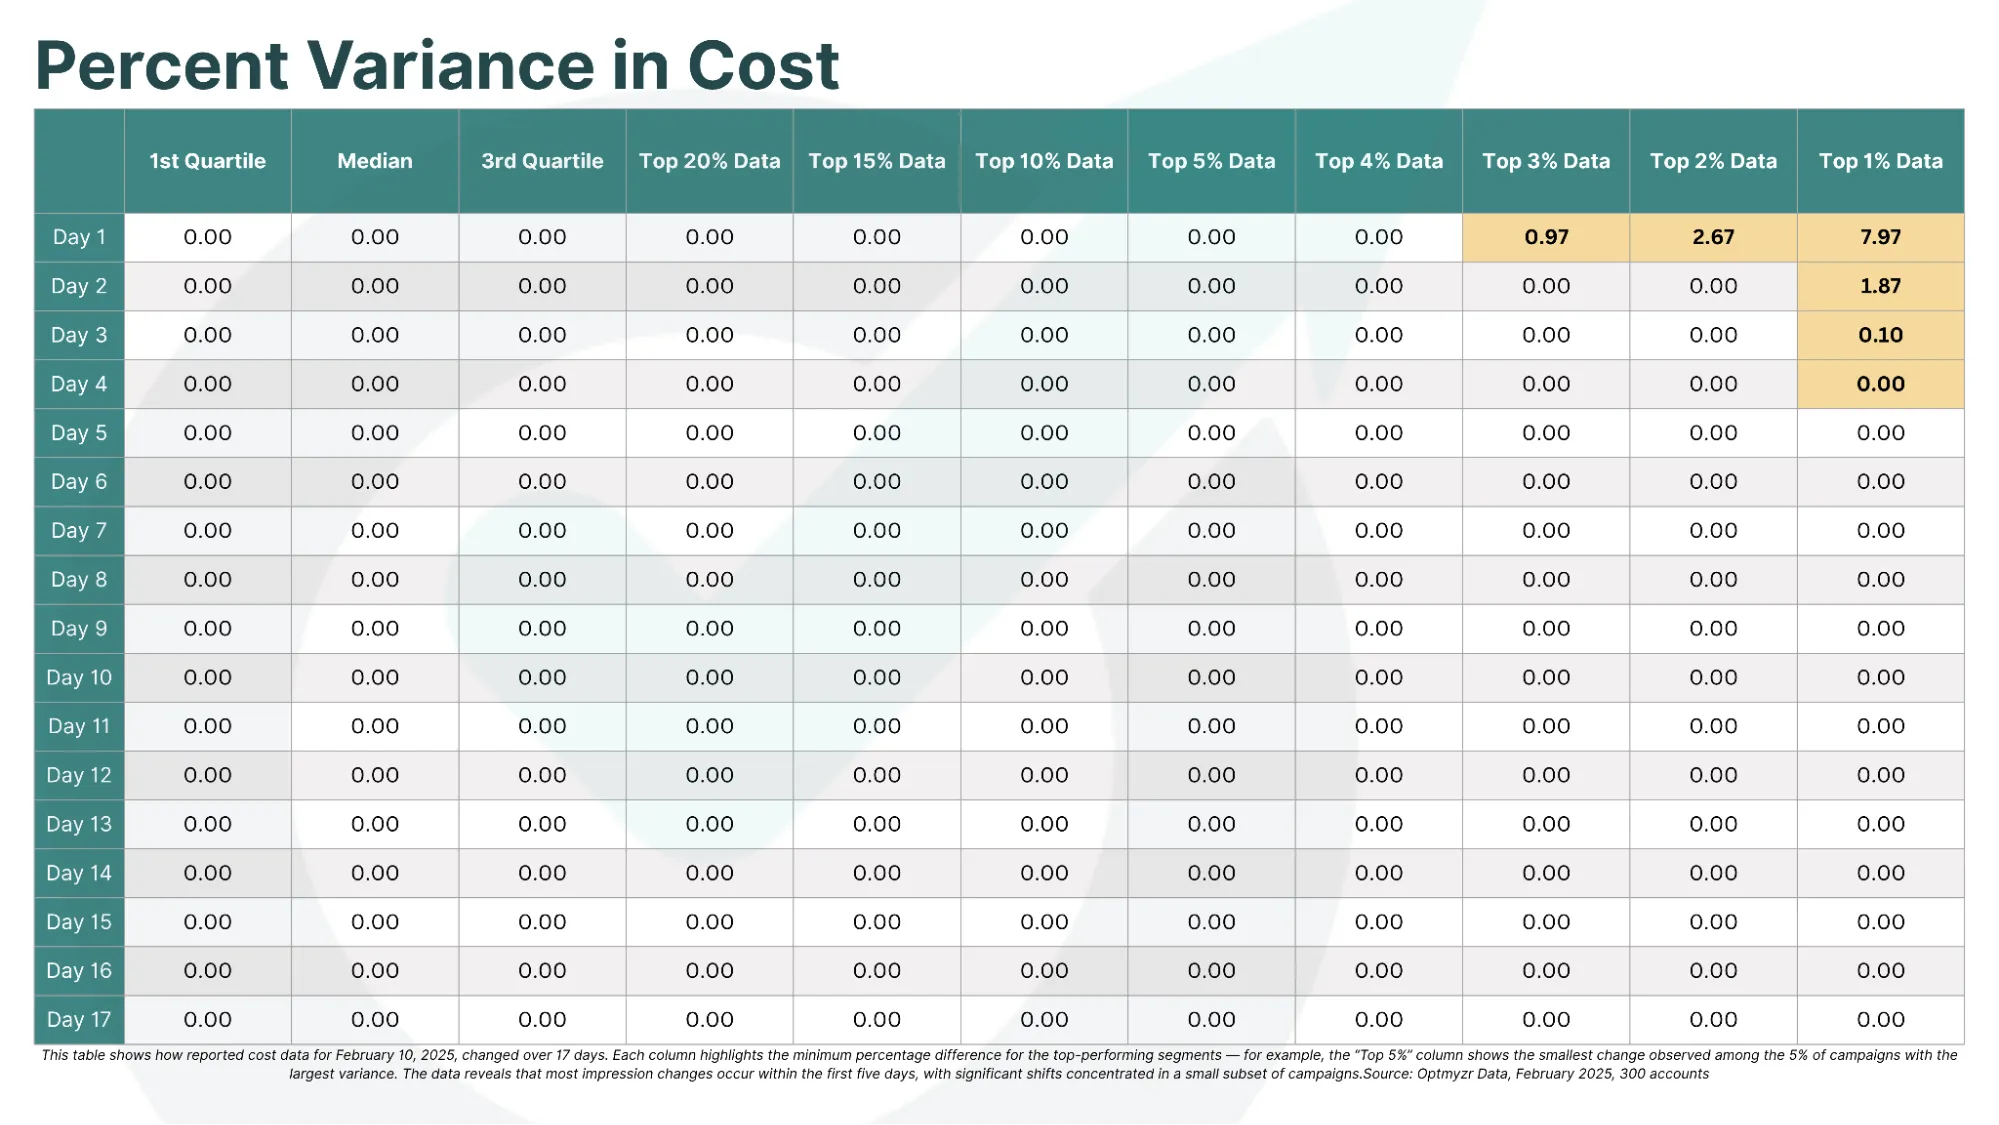
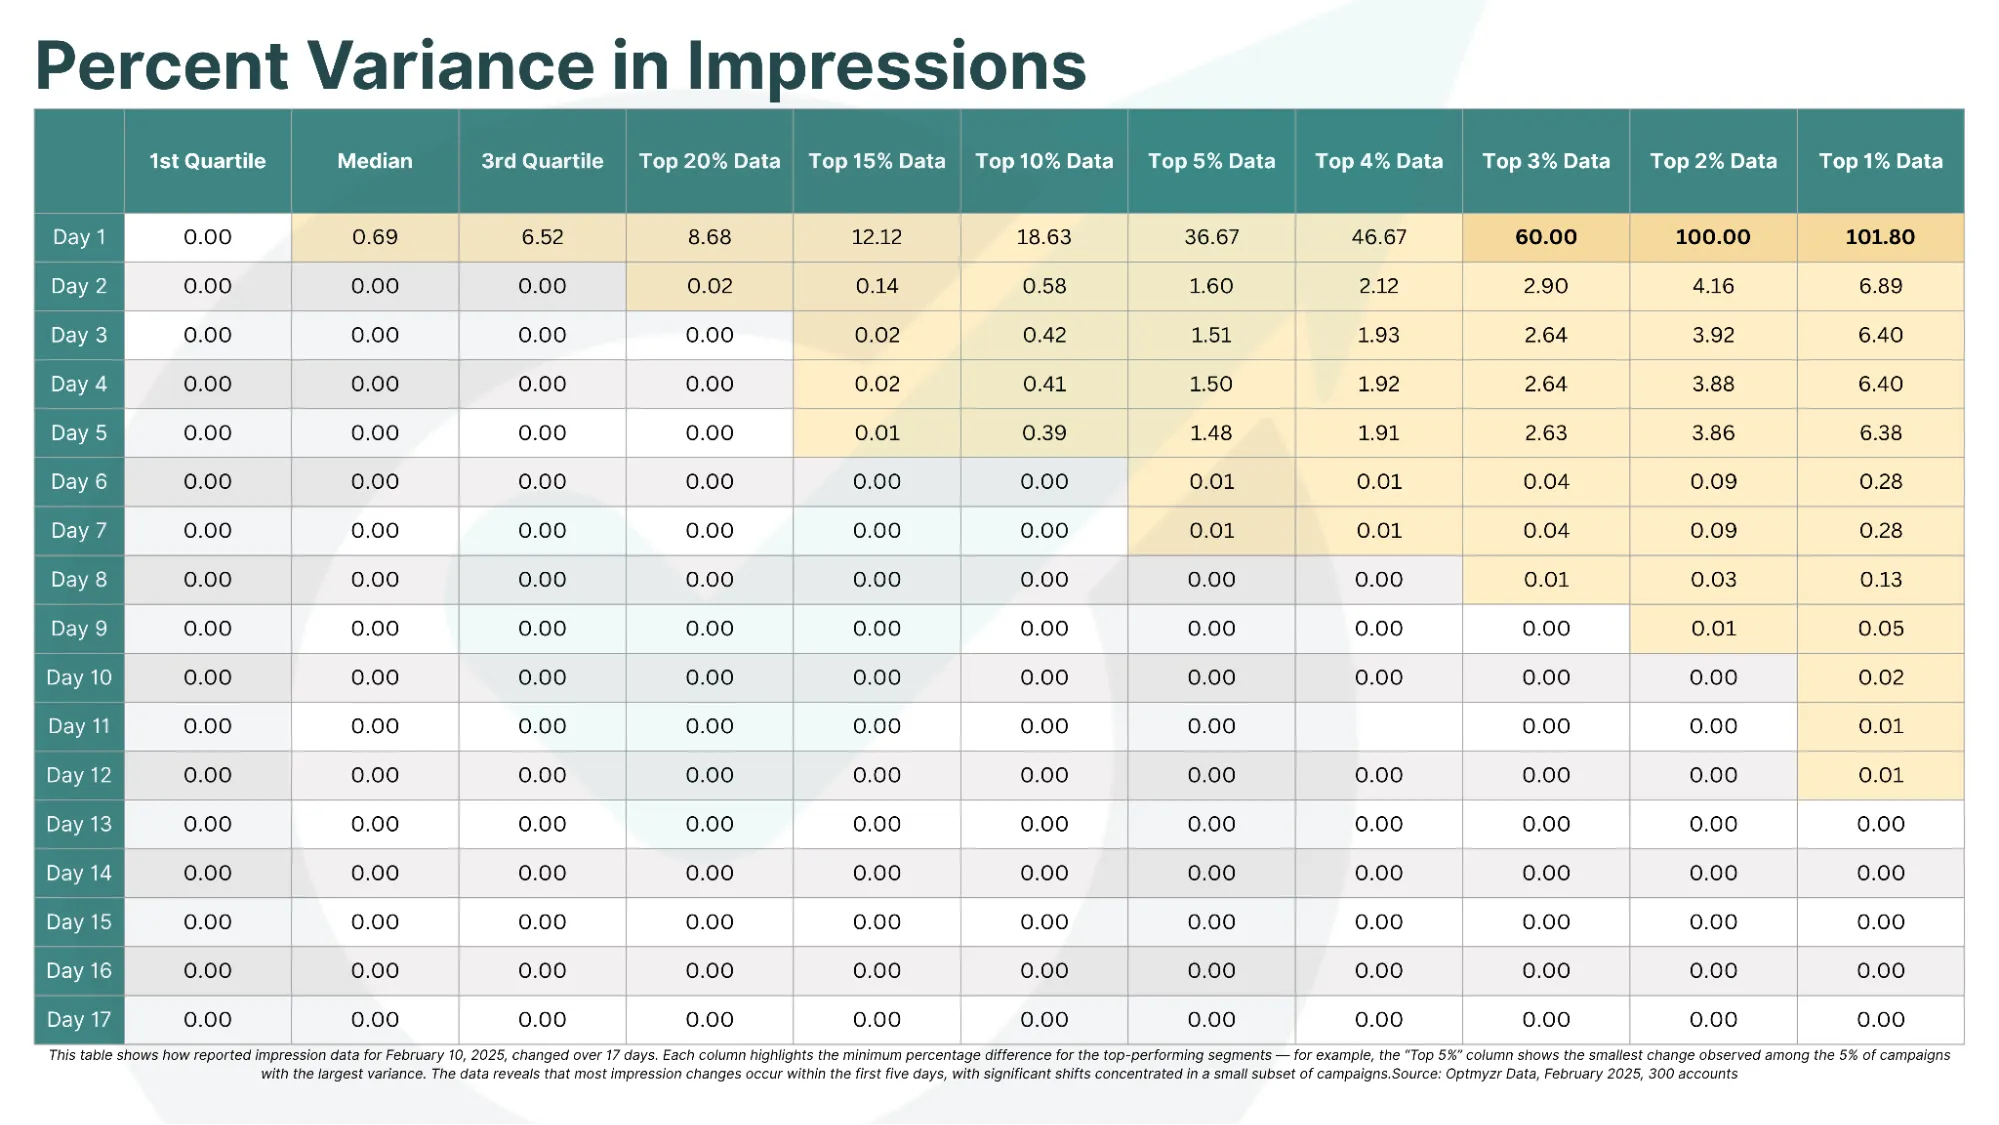
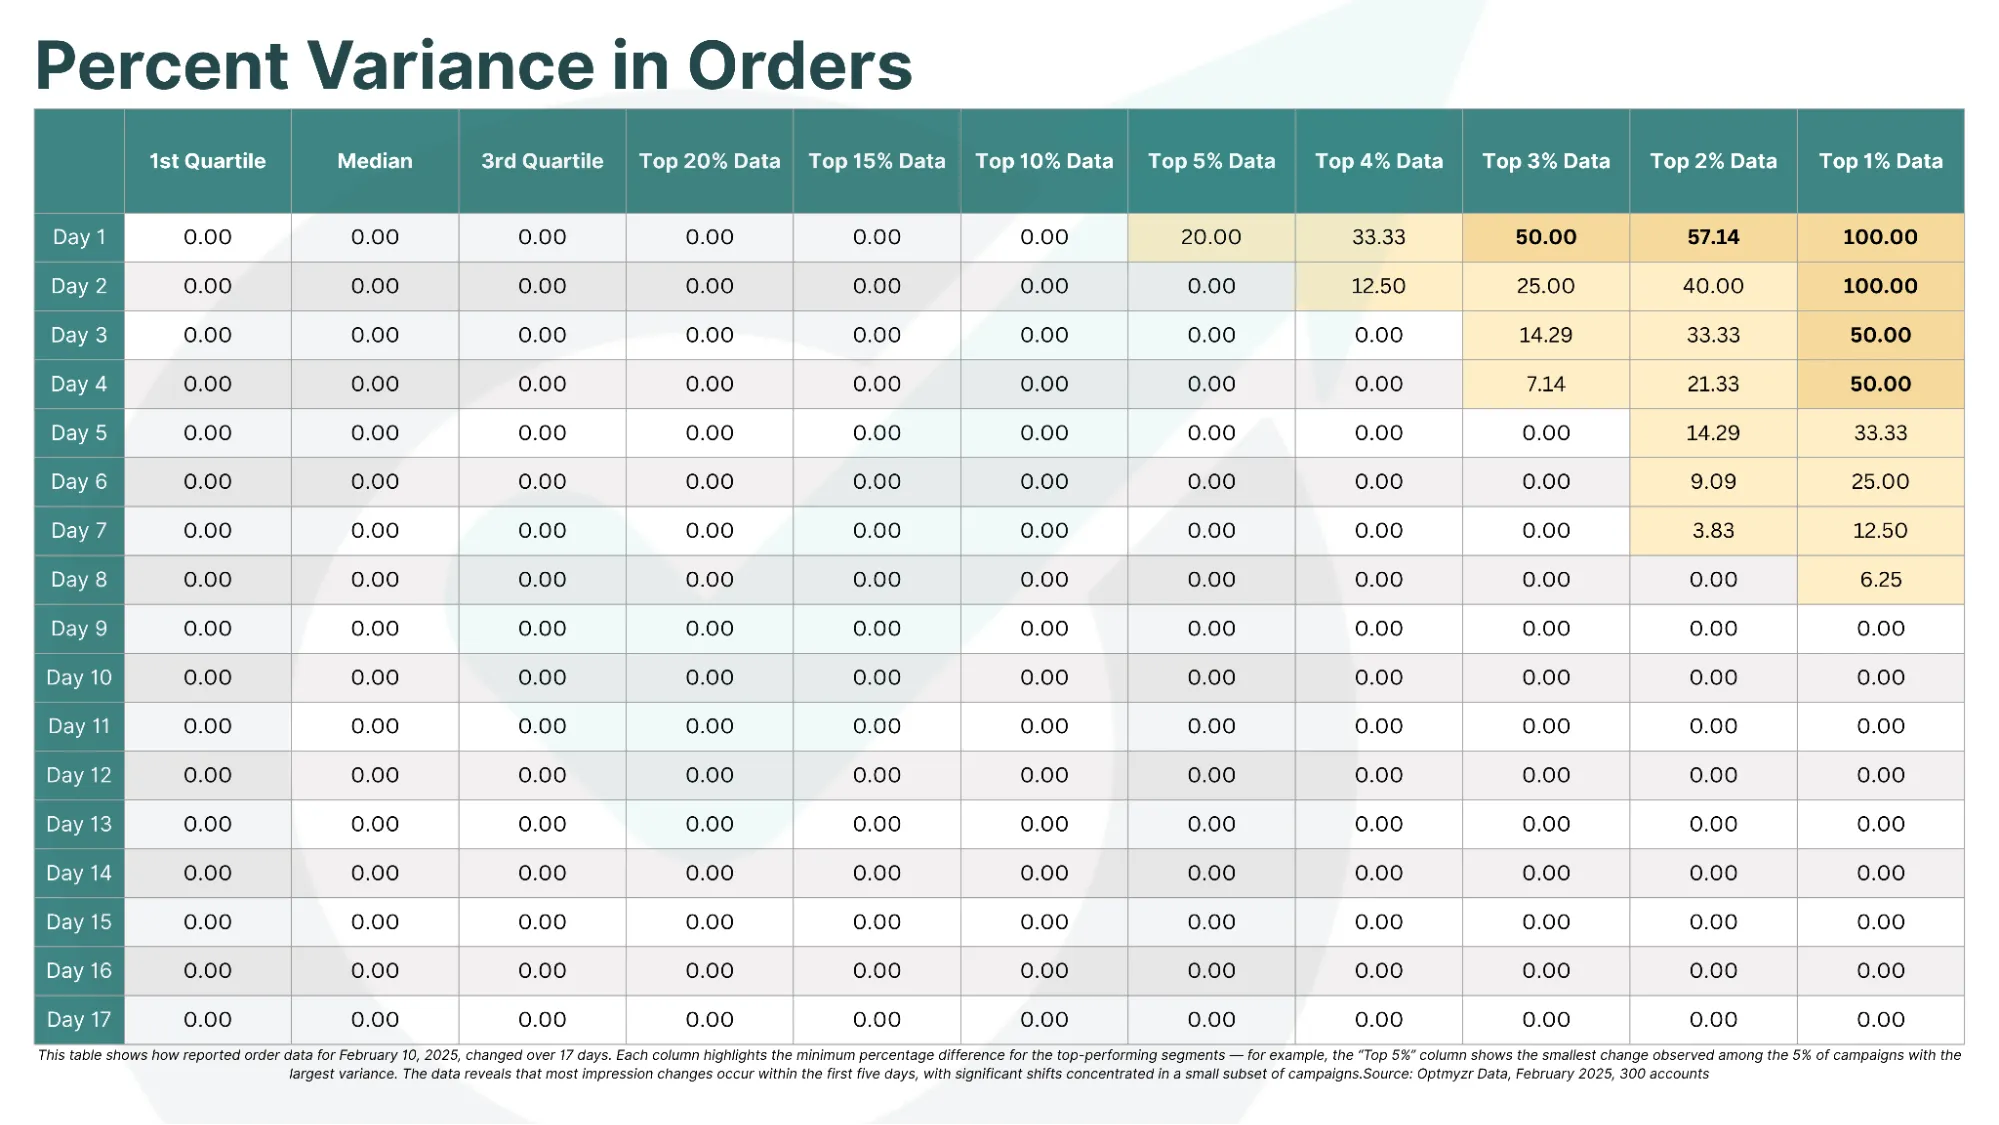
In the top 5% of campaigns, impression counts changed by at least 36.67% from Day 1 to Day 17. That’s a significant swing in visibility data that could affect everything from pacing to optimization logic.
For attributed sales, the top 5% of campaigns saw their revenue figures grow by at least 18.75% after the initial report. That’s enough to shift decisions about profitability and campaign continuation.
These aren’t fringe anomalies. These are real, measurable discrepancies that occurred in 1 out of every 20 campaigns in our dataset — a meaningful share for any large-scale advertiser.
Not all metrics are equally delayed
A key insight from the study: not every metric is equally delayed.
Clicks and Cost data are reported relatively quickly and are much more stable.
In contrast, Impressions, Conversions, and Sales take longer to finalize and are more susceptible to change.
For advertisers, this distinction matters:
You can usually trust spend and click data right away.
But metrics that reflect your business outcomes (like conversions or sales) require more patience.
Here’s a look at the delays for each of the analyzed metrics. Cells highlighted in yellow reflect delays between this day and the final data on day 17. I will explain below how to interpret the charts in more detail.
How should you interpret the “top X%” data?
You’ll notice we’ve included values like “Top 10%,” “Top 5%,” and “Top 1%” in our metrics. Here’s what those numbers mean:
Let’s take top 10% as an example:
We measured how much each campaign’s data changed between Day 1 and Day 17.
Then, we ranked all campaigns by that change.
The Top 10% includes the campaigns with the biggest changes.
The value we show is the smallest change within that group, so if your campaign is in the worst 10%, you’ll see at least that level of discrepancy.
This method helps quantify how bad things can get in edge cases, even if the average looks stable.
What can advertisers do based on our findings?
Be patient with conversion data. Avoid making ROAS decisions in the first 3 days after a campaign runs.
Educate clients or teams. Not everyone knows Amazon reporting is this delayed. Set expectations.
Align reporting windows. If you’re generating weekly reports, exclude recent days where data hasn’t stabilized.
Automate with caution. Don’t train bidding systems or make rules that act on unstable data.
Flag volatile campaigns. Watch for accounts or products that fall in the top 10% for delayed metrics.
The bottom line
Amazon Ads offers an enormous opportunity, but if you’re making decisions based on yesterday’s data, you could be misjudging performance by 100% or more.
Smart advertisers know that it’s not just about what the data says, but also when it says it. By understanding how long it takes for Amazon Ads data to settle, you’ll avoid premature decisions and unlock better optimization strategies.
For years, Cyber Monday has held the title of the biggest online shopping day, and recent reports like Adobe’s 2024 study confirm this with $13.3 billion in total e-commerce sales, compared to Black Friday’s $10.8 billion.
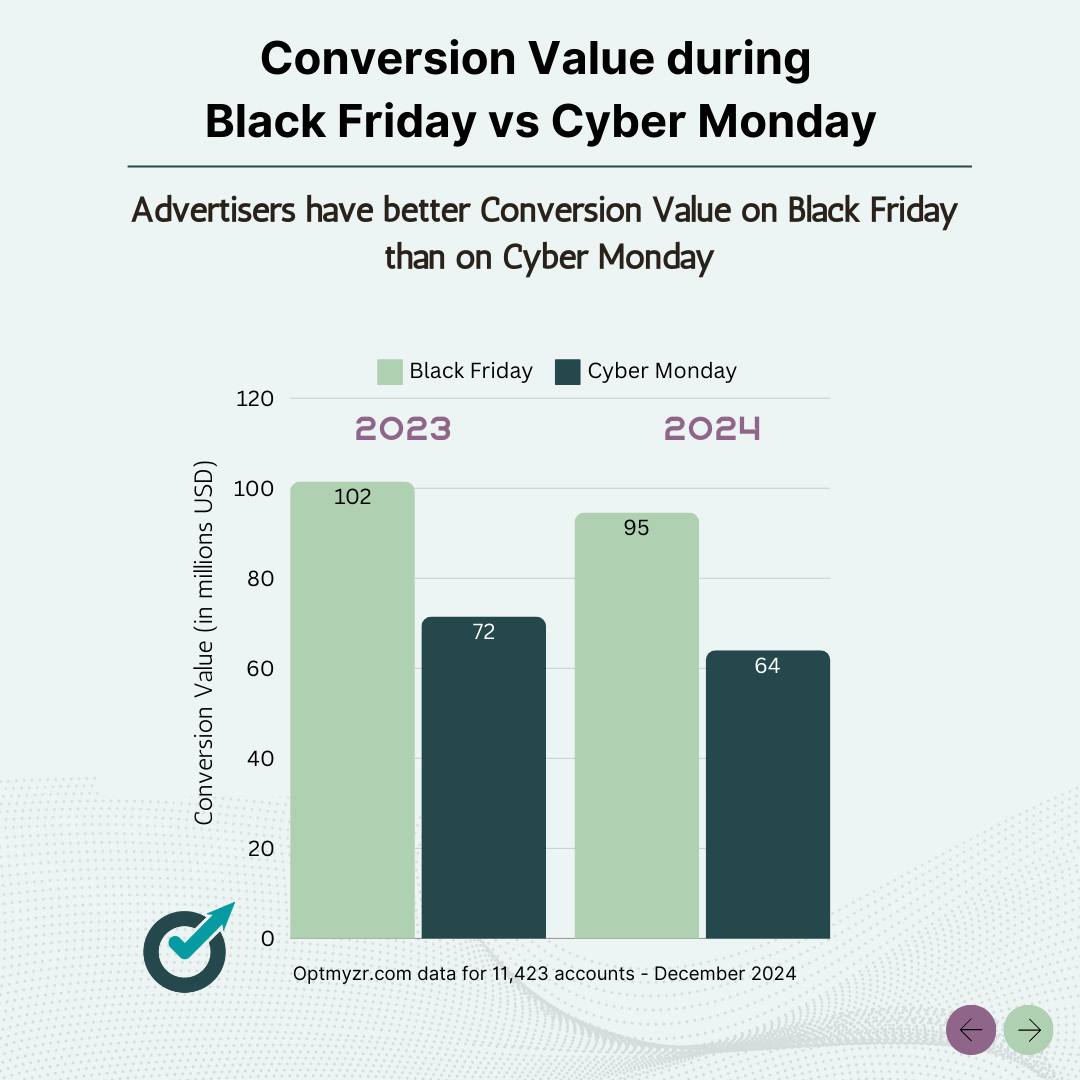
But here’s where things get interesting: when we narrow the focus to Google Ads-driven sales, the narrative flips. Optmyzr’s analysis of 11,423 accounts found that Black Friday consistently outperforms Cyber Monday in ad-driven conversion value.
Does this mean advertisers may be focused on the wrong day to drive most of their sales? Let’s dig into the findings and see what they mean for marketers.
The data that flips the script
From Optmyzr’s perspective based on a subset of accounts:
Black Friday 2024 (Nov 29) drove $94.62 million in Google Ads-attributed conversion value, eclipsing Cyber Monday’s $64.07 million.
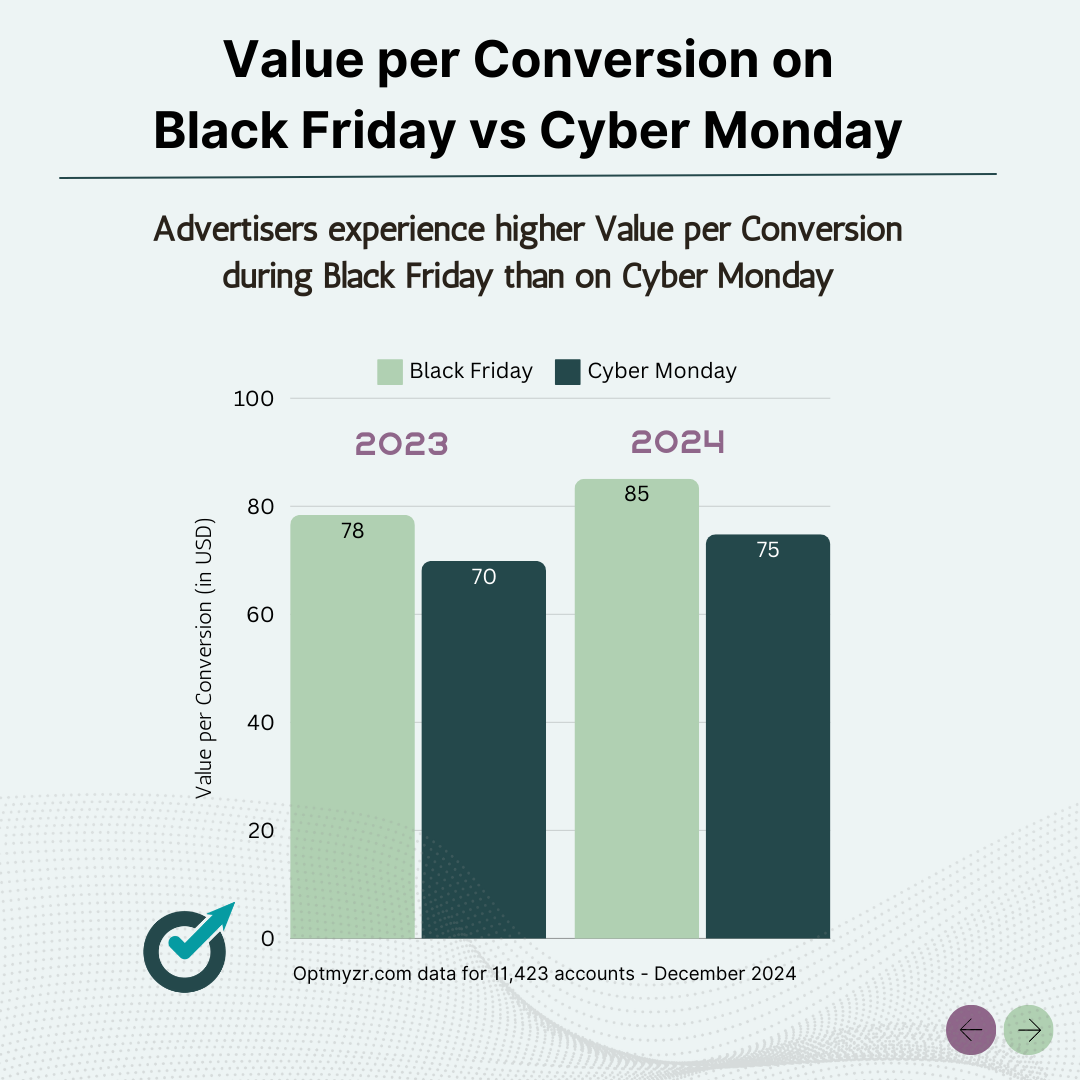
The average value per conversion on Black Friday was $85.09, significantly higher than Cyber Monday’s $74.82.
These findings reveal that for advertisers leveraging paid media, Black Friday is the clear leader—not Cyber Monday.
Optmyzr’s study about Black Friday vs. Cyber Monday
Ad Spend
Conversion Value
Value per Conversion
ROAS
2024
Black Friday
$15,321,664
$94,624,043
$85.09
617.58%
Cyber Monday
$14,121,621
$64,070,399
$74.82
453.70%
Ad Spend
Conversion Value
Value per Conversion
ROAS
2023
Black Friday
$13,990,189
$101,574,600
$78.37
726.04%
Cyber Monday
$13,250,633
$71,587,342
$69.88
540.26%
This Optmyzr data is as of Dec 7, 2024 for 11,423 accounts that advertised on Google Ads on Black Friday and Cyber Monday this year and last year. Note that conversion values are self-reported by advertisers, and that the 2024 conversion value numbers are likely going to be higher than what is shown here due to conversion delays.
Why Cyber Monday isn’t always the clear winner for ecommerce
So, why does Adobe’s data crown Cyber Monday the overall e-commerce champion, while Optmyzr’s data gives the edge to Black Friday? The answer lies in segmentation and shopping behavior:
1. Broader ecommerce vs. paid media attribution
Adobe tracks all e-commerce sales, regardless of traffic source. Cyber Monday’s strength comes from organic and direct channels like email marketing, bookmarked deals, and returning visitors. Optmyzr focuses specifically on sales attributed to Google Ads, where Black Friday’s urgency and high-ticket deals drive stronger ad-driven performance.
2. The role of urgency in Black Friday ads
Black Friday is a high-advertising day, with retailers flooding paid media with aggressive promotions for big-ticket items. Shoppers are primed to click and convert, leading to higher ad-attributed sales.
3. Cyber Monday’s organic advantage
By the time Cyber Monday arrives, many shoppers have bookmarked deals or received email reminders, reducing reliance on ads. The day’s strength lies in smaller, follow-up purchases driven by organic and direct traffic.
Why should you care
For advertisers, understanding the segmentation between total e-commerce sales and ad-driven performance isn’t just an exercise in analytics—it’s the key to making smarter budget decisions. If you rely on Google Ads to drive your holiday sales, the conventional wisdom that Cyber Monday is the biggest online shopping day might lead you to misallocate resources.
Optmyzr’s data shows that Black Friday drives more value for paid media campaigns, suggesting that ad budgets and strategies should align with the day’s urgency and consumer behavior. Recognizing these nuances enables advertisers to optimize their campaigns for maximum return, standing out in a crowded holiday marketplace.
What you should take away
Advertisers should rethink how they approach Black Friday and Cyber Monday 2025 in their holiday strategies. Here’s how to act on these insights:
1. Double down on Black Friday ads
If you’re running Google Ads, Black Friday offers unparalleled opportunities for high-value conversions. Allocate larger budgets to capture the wave of motivated shoppers and focus on premium products and bundled deals.
2. Leverage Cyber Monday’s organic strength
Cyber Monday remains vital, but its strength lies outside of paid channels. Use retargeting and email campaigns to re-engage shoppers who browsed during Black Friday.
3. Reevaluate attribution models
The segmentation between total sales and ad-attributed sales underscores the importance of understanding your channel performance. A broader e-commerce win for Cyber Monday doesn’t diminish the fact that Black Friday delivers better results for paid media campaigns.
Tailor your campaigns based on data
The holiday shopping narrative has long been dominated by Cyber Monday’s total sales supremacy. But Optmyzr’s data suggests that for advertisers using paid media, Black Friday is the real champion.
This insight challenges conventional wisdom and opens up new possibilities for advertisers looking to make the most of their holiday budgets. By recognizing the strengths of both days and tailoring campaigns accordingly, you can drive performance that outpaces competitors who stick to the old playbook.
And after what you read here, if you think Optmyzr is the tool for you to drive higher performance, sign up for a 14-day free trial today.
Thousands of advertisers — from small agencies to big brands — worldwide use Optmyzr to manage over $5 billion in ad spend every year. Plus, if you want to know how Optmyzr’s various features help you in detail, talk to one of our experts today for a consultation call.
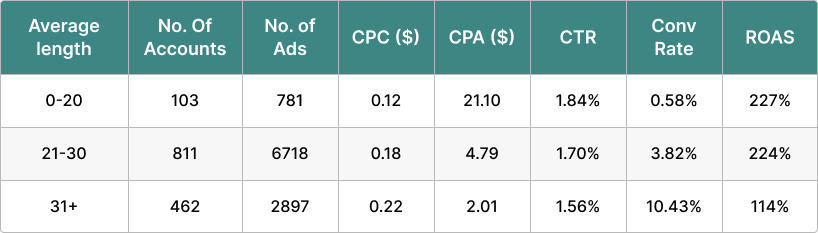
In Google Ads, attracting the right traffic isn’t just about selecting keywords—it’s about aligning those keywords with user intent. Understanding when to use exact match, phrase match, broad match, or negative keywords is crucial for maximizing ad spend and targeting effectively.
The stakes are high: the wrong match type can waste budgets on irrelevant clicks, while the right choice can drive higher click-through rates, return on ad spend, and quality leads.
This guide provides a clear, practical breakdown of each match type. You’ll learn the strengths and weaknesses of exact, phrase, and broad match, along with the best use cases and key findings from our latest match type study which analyzes data from Q3 2024 (July to September) on advertiser preferences and performance.
What are the different keyword match types in Google Ads?
Google Ads offers three main keyword match types, each with unique targeting criteria:
Exact Match (EM): Targets searches that closely match the keyword, delivering high precision with limited reach.
Phrase Match (PM): Matches ads to searches that align with the keyword’s meaning, even if wording or order varies.
Broad Match (BM): Provides the widest reach, allowing ads to show for a broad array of related searches.
These match types suit different campaign goals. Understanding their individual advantages allows advertisers to structure campaigns for the best performance.
When to use each match type?
Exact match: Best for precision
Ideal for branded keywords or high-intent searches where relevance is key
Ensures minimal wasted clicks and higher engagement from users who search for the exact keyword meaning
Works best in campaigns targeting specific product terms or high-value, bottom-of-funnel audiences
Phrase match: Balance between reach and control
Useful for competitive markets and thematic keyword groupings
Helps broaden reach to intent-aligned searches while maintaining relevance
Effective for capturing closely related search queries without overly restricting traffic
Broad match: Maximizing reach with Smart Bidding
Ideal for top-of-funnel campaigns or discovering new audiences at scale.
Works well when paired with Smart Bidding to improve relevance by analyzing user intent in real-time.
Requires careful monitoring and the use of negative keywords to avoid irrelevant clicks.
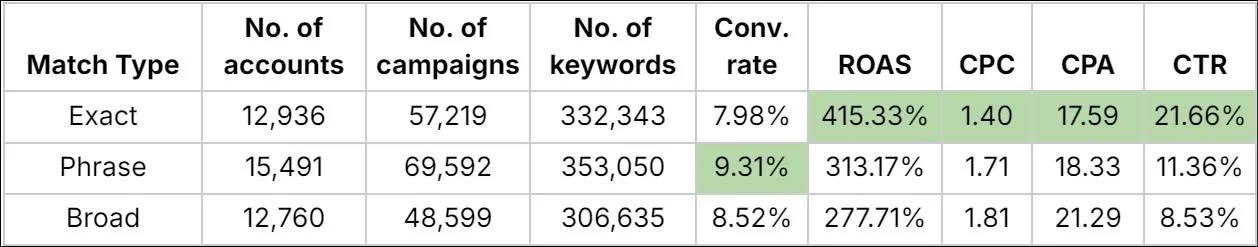
Performance insights from our study
Strategic Data: Our November 2024 analysis of 992,028 keywords across 15,491 ad accounts highlights the unique strengths of each match type:
Source: Optmyzr Keyword Study - November 2024
Key Takeaways:
Exact Match achieves the highest ROAS (415%) and CTR (21.66%), proving its value for high-intent campaigns.
Phrase Match shows a strong balance with a high conversion rate (9.31%) and solid ROAS (313%), making it ideal for advertisers needing both control and reach.
Broad Match delivers high volume at a lower ROAS (277%) and CTR (8.5%), making it suitable for large-scale or exploratory campaigns where volume outweighs precision.
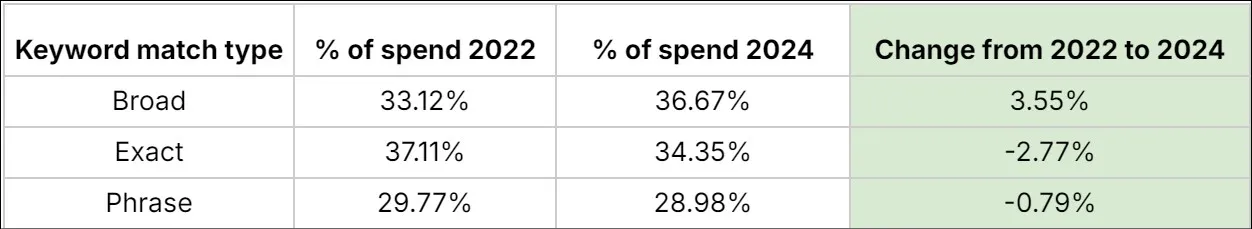
Our analysis of keyword match types from 2022 to 2024 reveals consistent patterns in how advertisers allocate their keywords across broad, exact, and phrase match types. The distribution of match types has remained largely stable over the past two years, with only minor shifts in usage:
Broad Match: Increased from 33.12% in 2022 to 36.67% in 2024 (+3.55%).
Exact Match: Declined slightly from 37.11% in 2022 to 34.35% in 2024 (-2.77%).
Phrase Match: Marginally decreased from 29.77% in 2022 to 28.98% in 2024 (-0.79%).
This consistency highlights that advertisers continue to use match types in similar proportions, suggesting their strategic value has not significantly changed over time.
Phrase match still dominates in terms of usage, followed by exact match, with broad match showing the most growth—likely due to advancements in Smart Bidding and Google’s improved intent-matching algorithms.
So what does this data say?
The relatively static distribution reflects how each match type serves distinct campaign goals:
Phrase Match remains a popular choice for balancing reach and relevance, particularly in competitive markets.
Exact Match continues to serve as the go-to for precision targeting, despite a slight decline in usage.
Broad Match shows steady growth, indicating more advertisers are willing to leverage it for discovery and scale, particularly with the support of Google’s AI-driven bidding strategies.
These findings reinforce the importance of understanding when and how to use each match type effectively, as their roles in campaign strategy remain crucial even amidst changes in Google Ads’ algorithms and AI capabilities.
To maximize results, you need to optimize campaigns regularly by analyzing keyword performance, adjusting bids, and refining negative keywords. Brand exclusions and inclusions are also useful tools, particularly when working with phrase and broad match, to control the quality and relevance of ad placements.
Best practices for each match type
Exact match tips
Stick to specific keywords: Limit exact match to precise, high-intent terms, such as brand names or product-specific keywords.
Monitor regularly: Adjust keywords based on performance to ensure that you’re not missing out on potential traffic due to overly narrow targeting.
Phrase match tips
Organize thematically: Group keywords by related themes to improve relevance.
Use brand exclusions: Prevent ads from appearing on searches for your brand terms that you already have in branded campaigns.
Add negative keywords: Continuously refine your negative keyword list to filter out less relevant searches.
Broad match tips
Leverage smart bidding: Broad match works best with Smart Bidding, which adjusts bids based on Google’s analysis of search intent.
Track search terms: Regularly review search terms and add irrelevant queries as negative keywords.
Use brand inclusions: For increased precision (but lower volume), consider allowing ads only on queries related to your brand.
Capture the right clicks with precise targeting
In Google Ads, your choice of keyword match type is more than just a technical detail.
But no match type is a magic bullet. Success requires a hands-on approach—analyzing performance, adjusting bids, adding negative keywords, and refining your strategy as the data comes in.
If you need help with that from a proven set of tools, try Optmyzr.
Performance Max revolutionized the way marketers advertise on Google, allowing them to advertise across Search, Youtube, display, Discover, Gmail, and local with a single budget and different creatives. Some have fallen in love with the ad type because it removes the bias from budget allocation, while others distrust it because PMax doesn’t allow for as much control and reporting as conventional Google campaigns.
However, the biggest reason PMax is such a polarizing campaign type is because there are no concrete best practices on what makes a successful PMax structure. So, we decided to investigate the most common PMax trends and shine a light on the ones that perform best as well as the tactics that underperform.
In this study, we’ll assess:
Whether what the majority of advertisers are doing is profitable
The impact of other campaigns on PMax
Whether human bias affects performance
How creative and targeting choices impact PMax
What a ‘healthy’ PMax campaign looks like
Methodology
Before we dive into the data, it is worth noting that there is a mix of ecommerce and lead gen campaigns in the cohort.
A total of 9,199 accounts and 24,702 campaigns are included in the data.
Accounts had to be at least 90 days old and have conversions.
Accounts had to have at least $1,000 monthly budget and could not exceed a $5 million monthly budget
We did our best to account for different structure and creative choices, however data at this scope cannot perfectly segment out each use case. We dug into a random assortment of accounts in each question (below) to confirm trends we’re seeing.
Data Questions & Observations
Below, you’ll find the raw data from the study. We’ve also organized the findings in the sections that follow.
Raw Data
Typical structure:
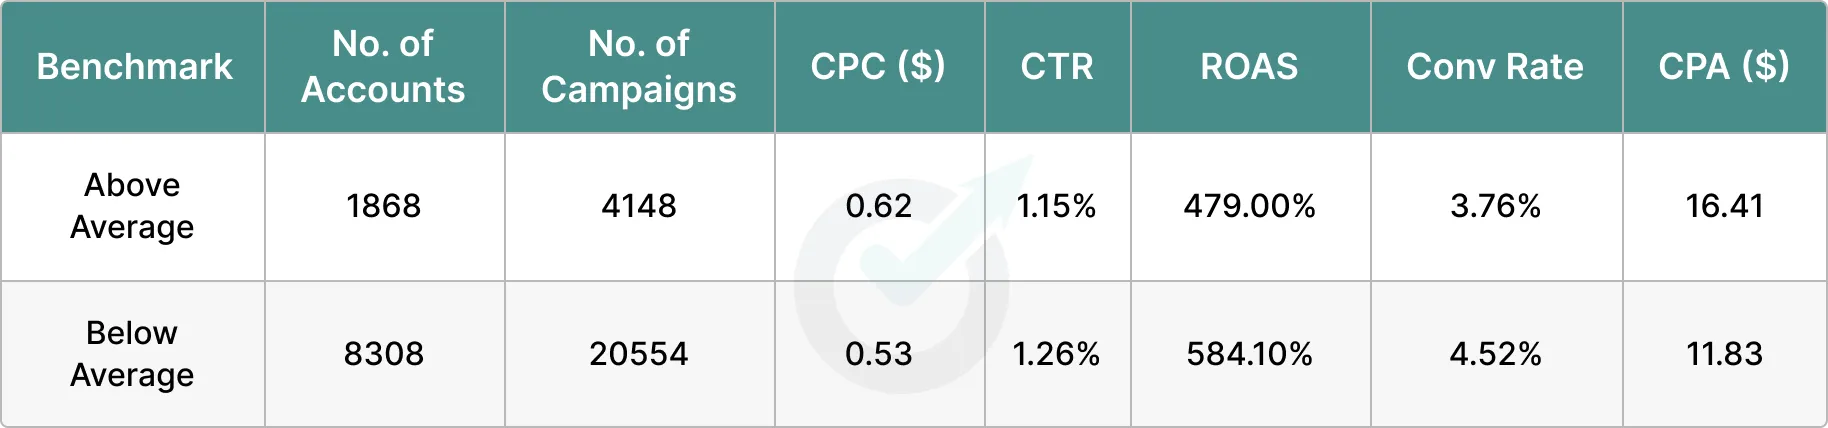
Impact on performance when an account was below or above the average for typical structure:
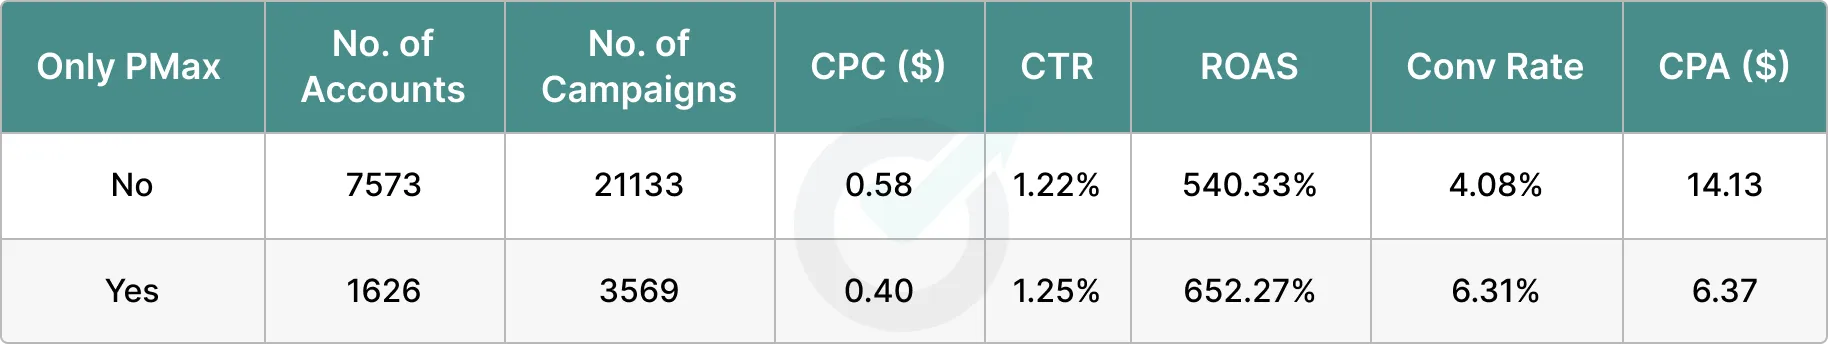
Only PMax or Media Mix:
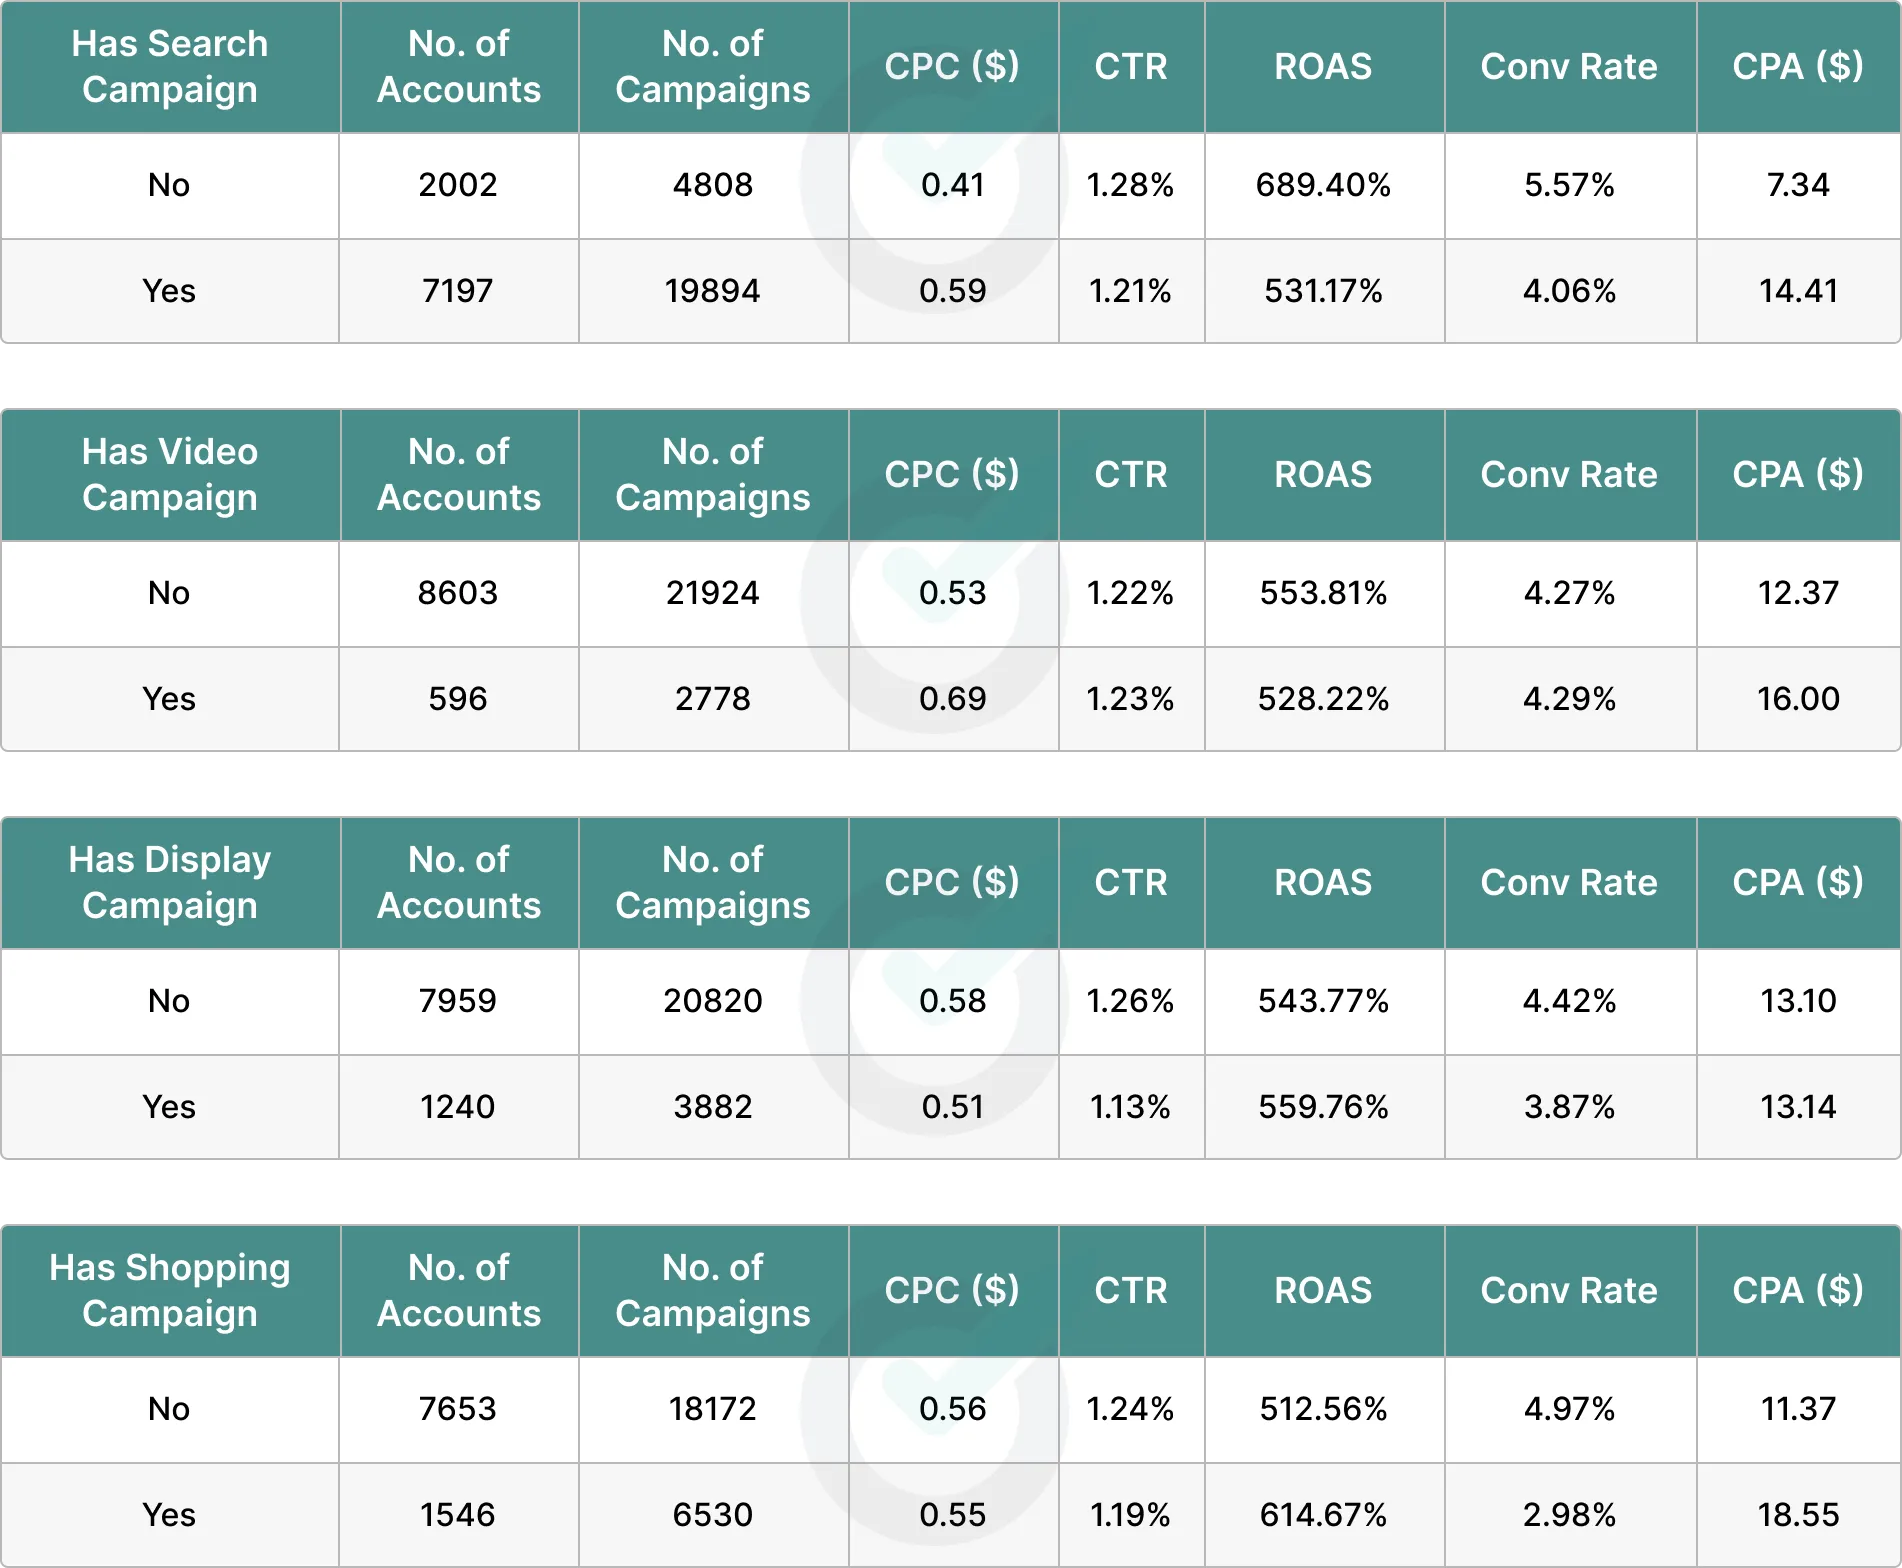
Other Campaign Types Present:
This table shows the performance of the PMax campaigns when an account did or did not have the specified campaign type.
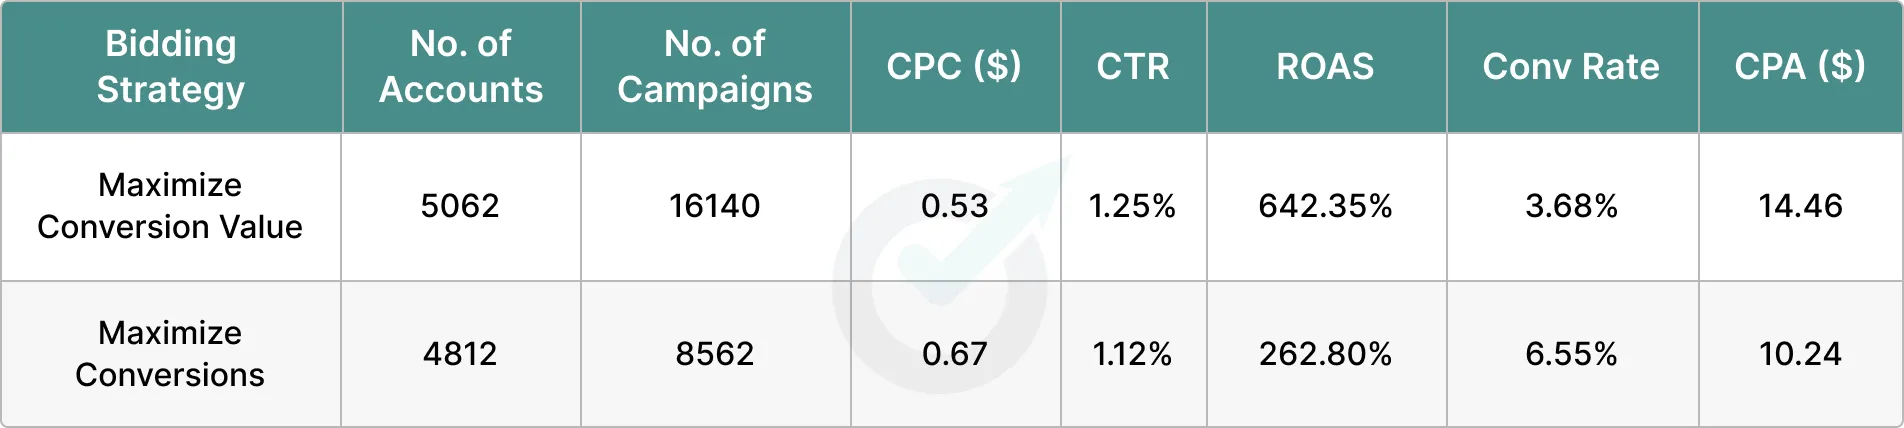
Bidding Strategies Used:
This is the breakdown of how each bidding strategy in PMax performs.
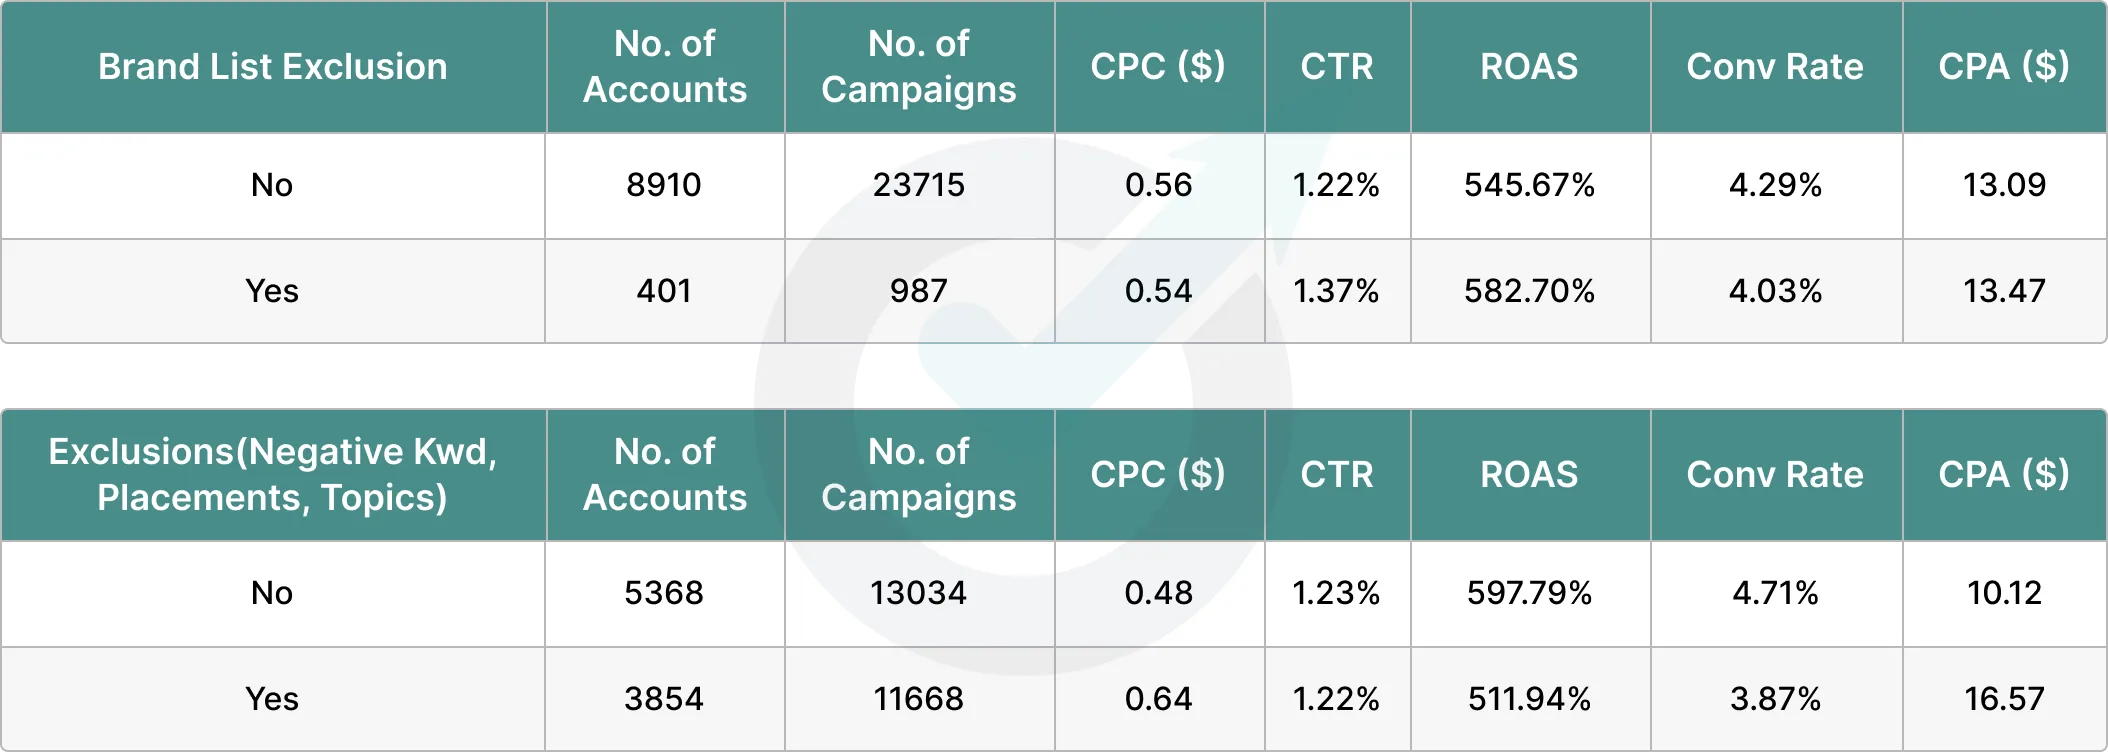
Impact of Using Exclusions:
This data shows the impact of using brand exclusion lists and other types of exclusions (negative keywords, placements, and topics).
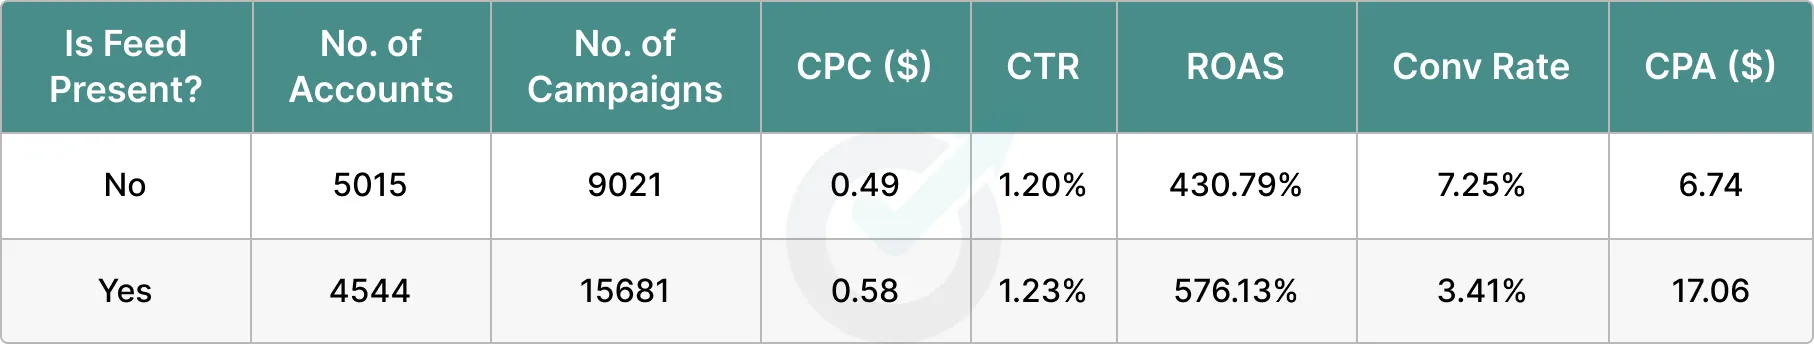
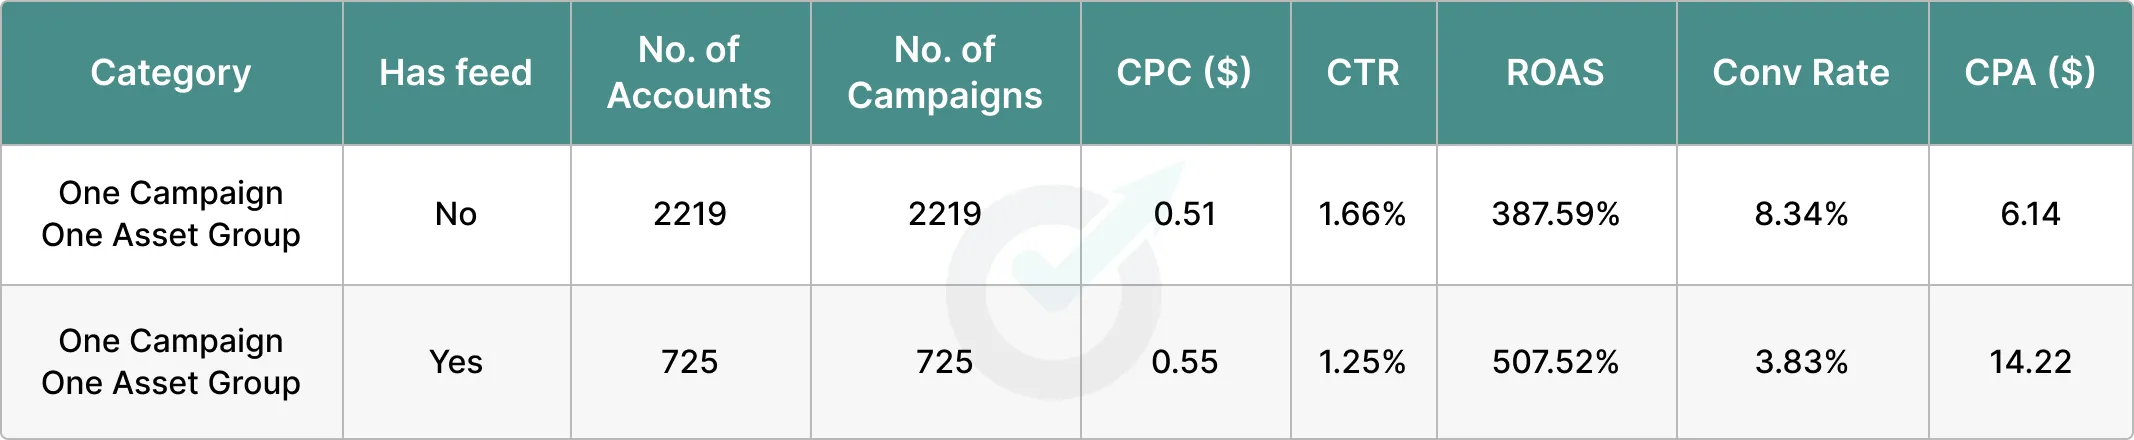
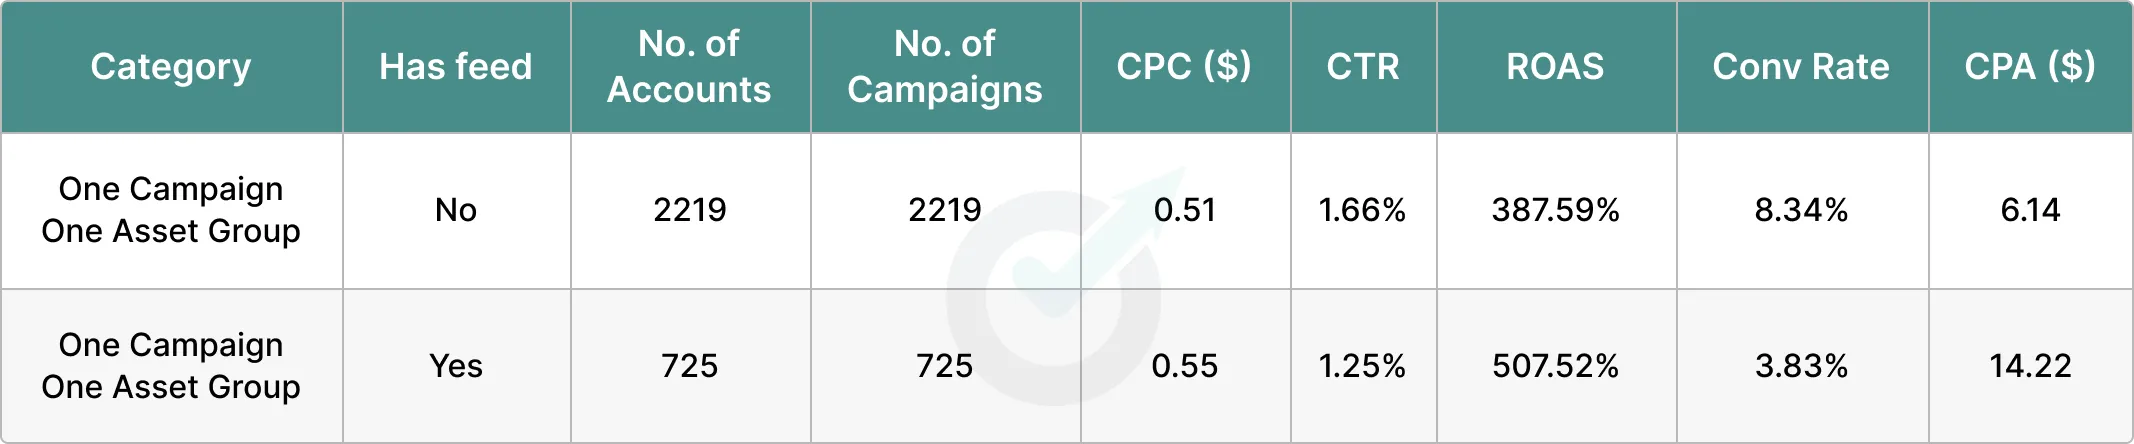
Is Feed Present:
This data highlights whether there’s a feed in the PMax campaign.
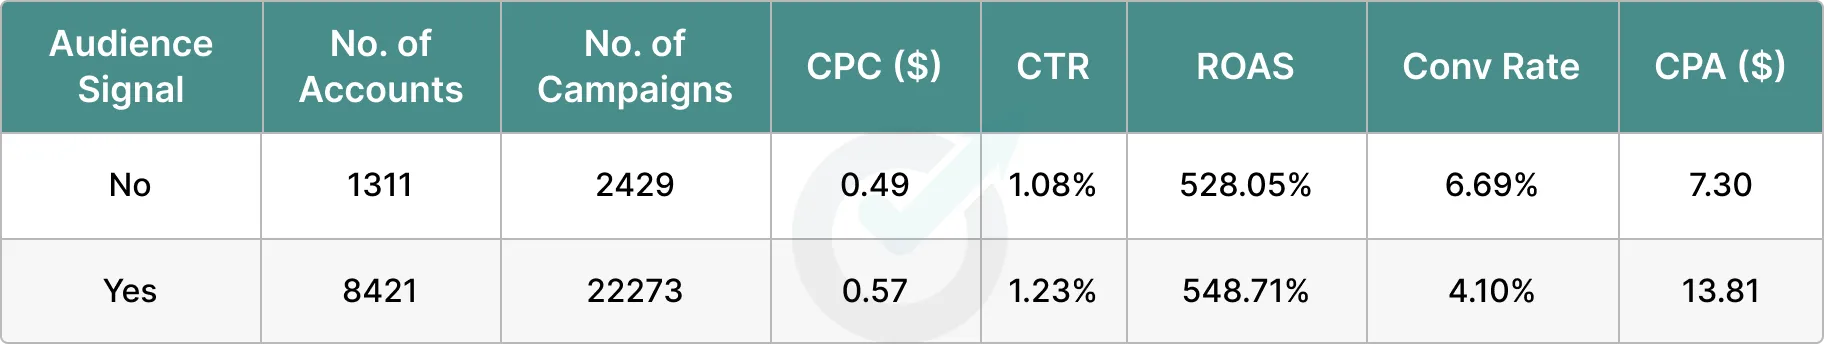
Impact of Audience Signals:
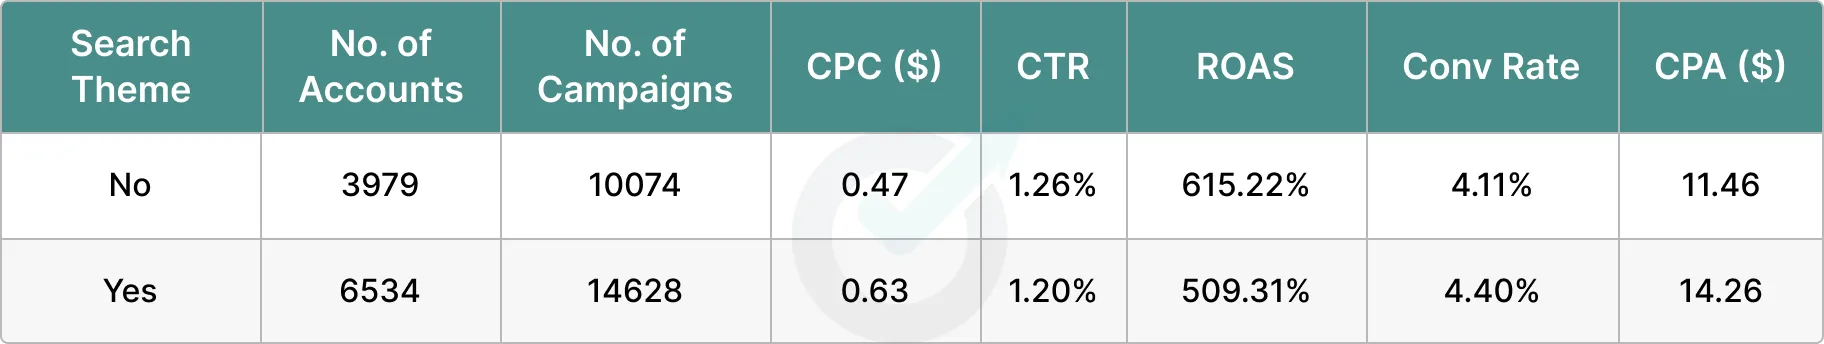
Impact of Search Themes:
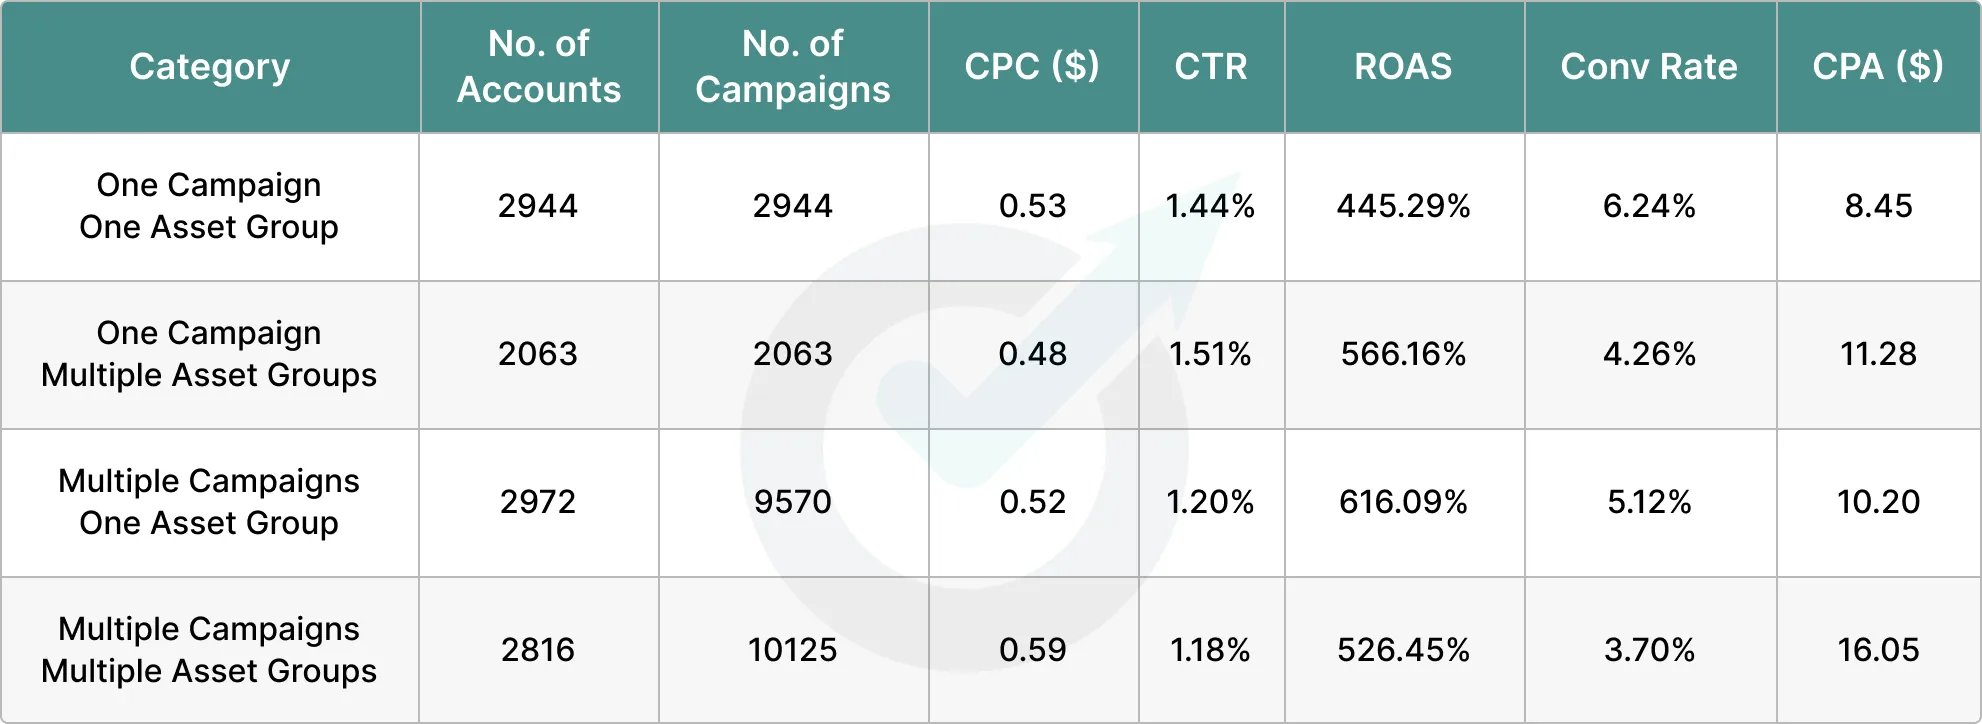
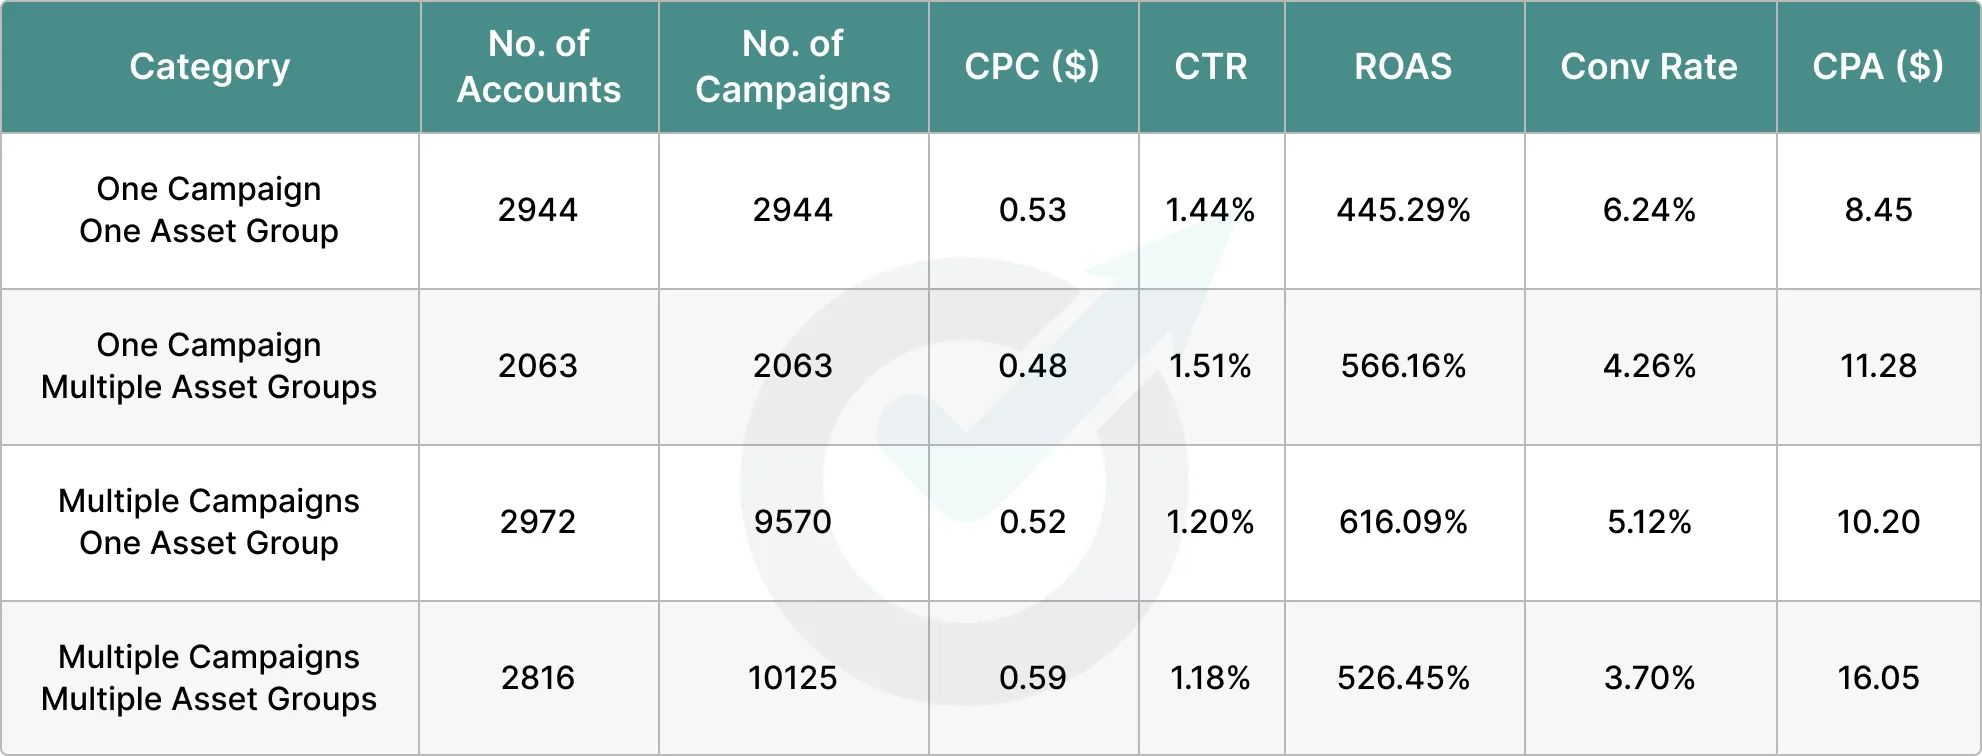
PMax Structure:
In the interest of making it easier to understand each Pmax campaign type, we’re applying labels to them:
Starter Campaigns: one campaign/one asset group
Focused Campaigns: multiple campaigns/one asset group
Conversion Hungry Campaigns: one campaign/multiple asset groups
Mixed Campaigns: multiple campaigns/multiple asset groups
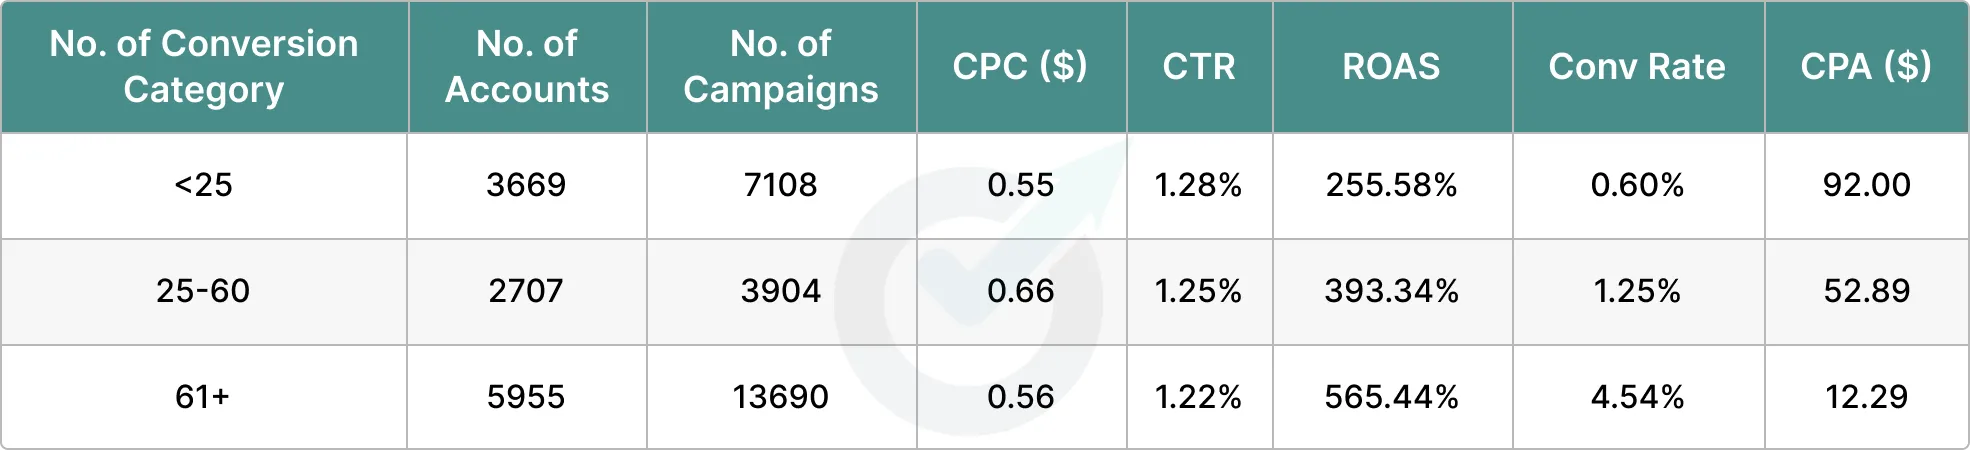
How Many Conversions Does PMax Need?
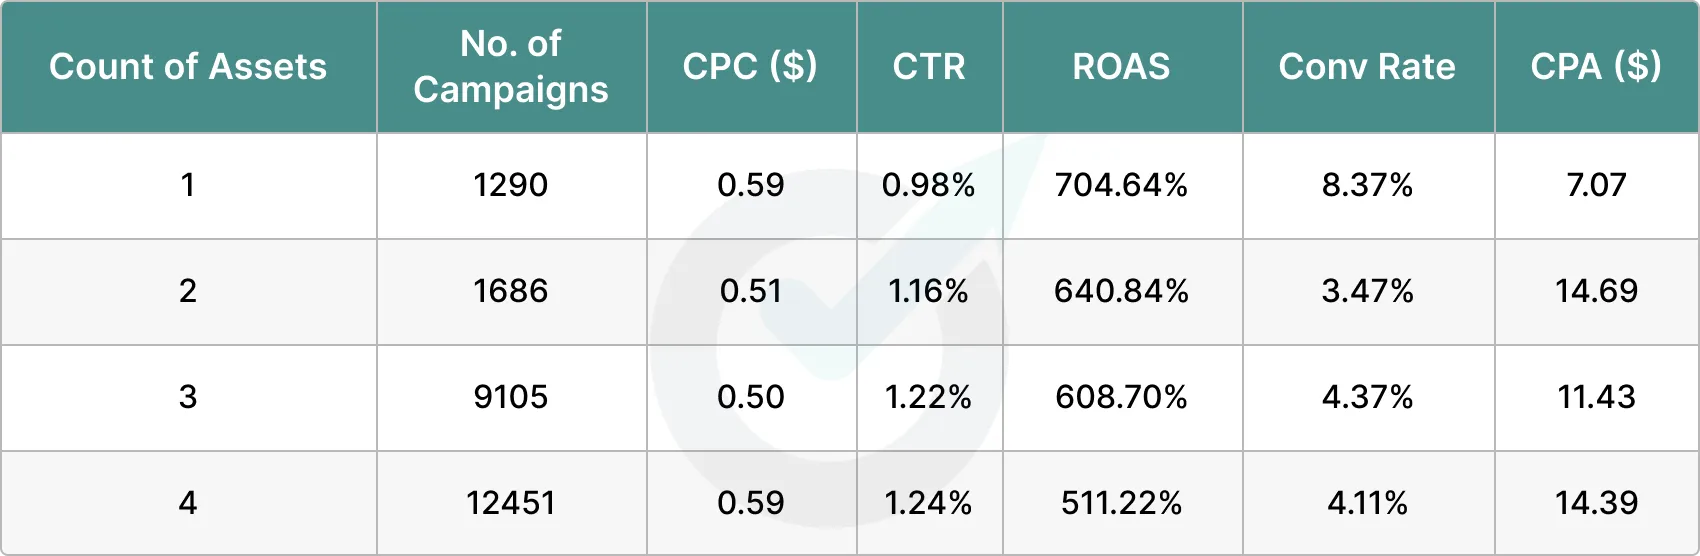
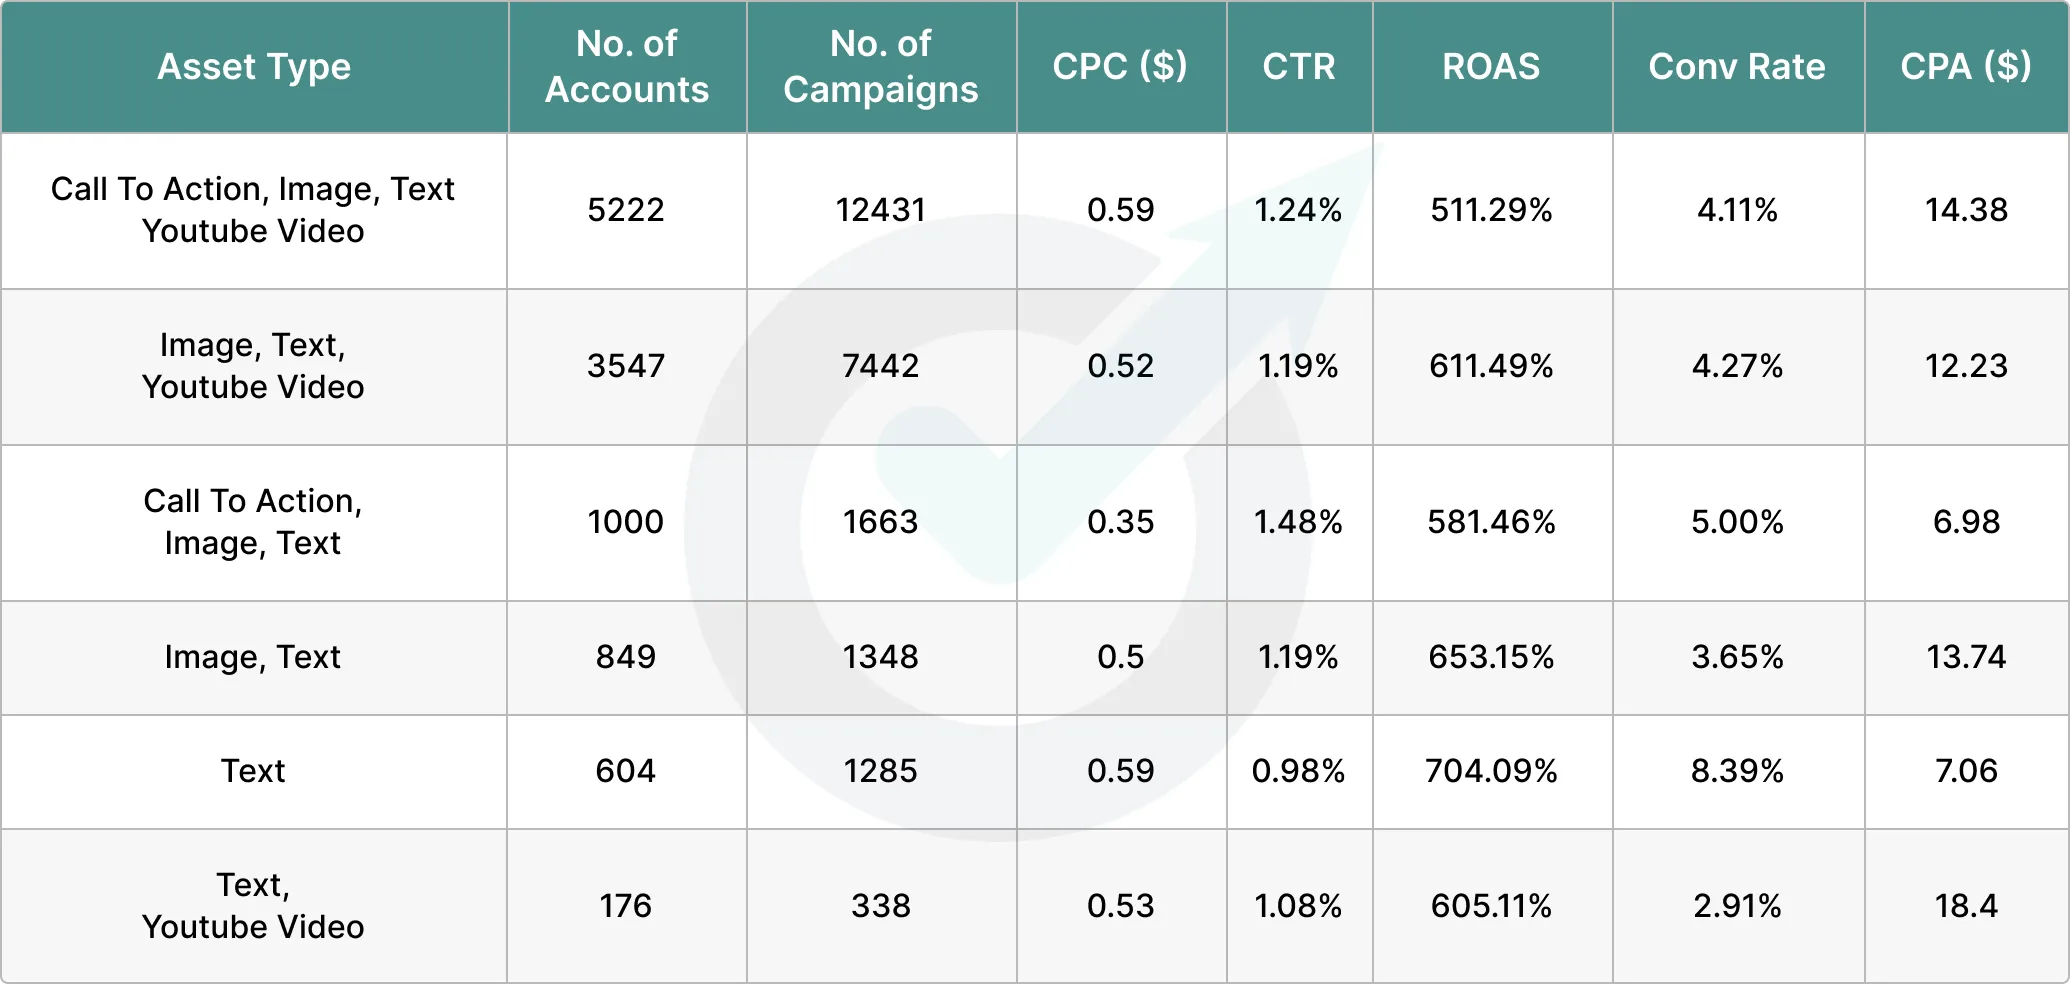
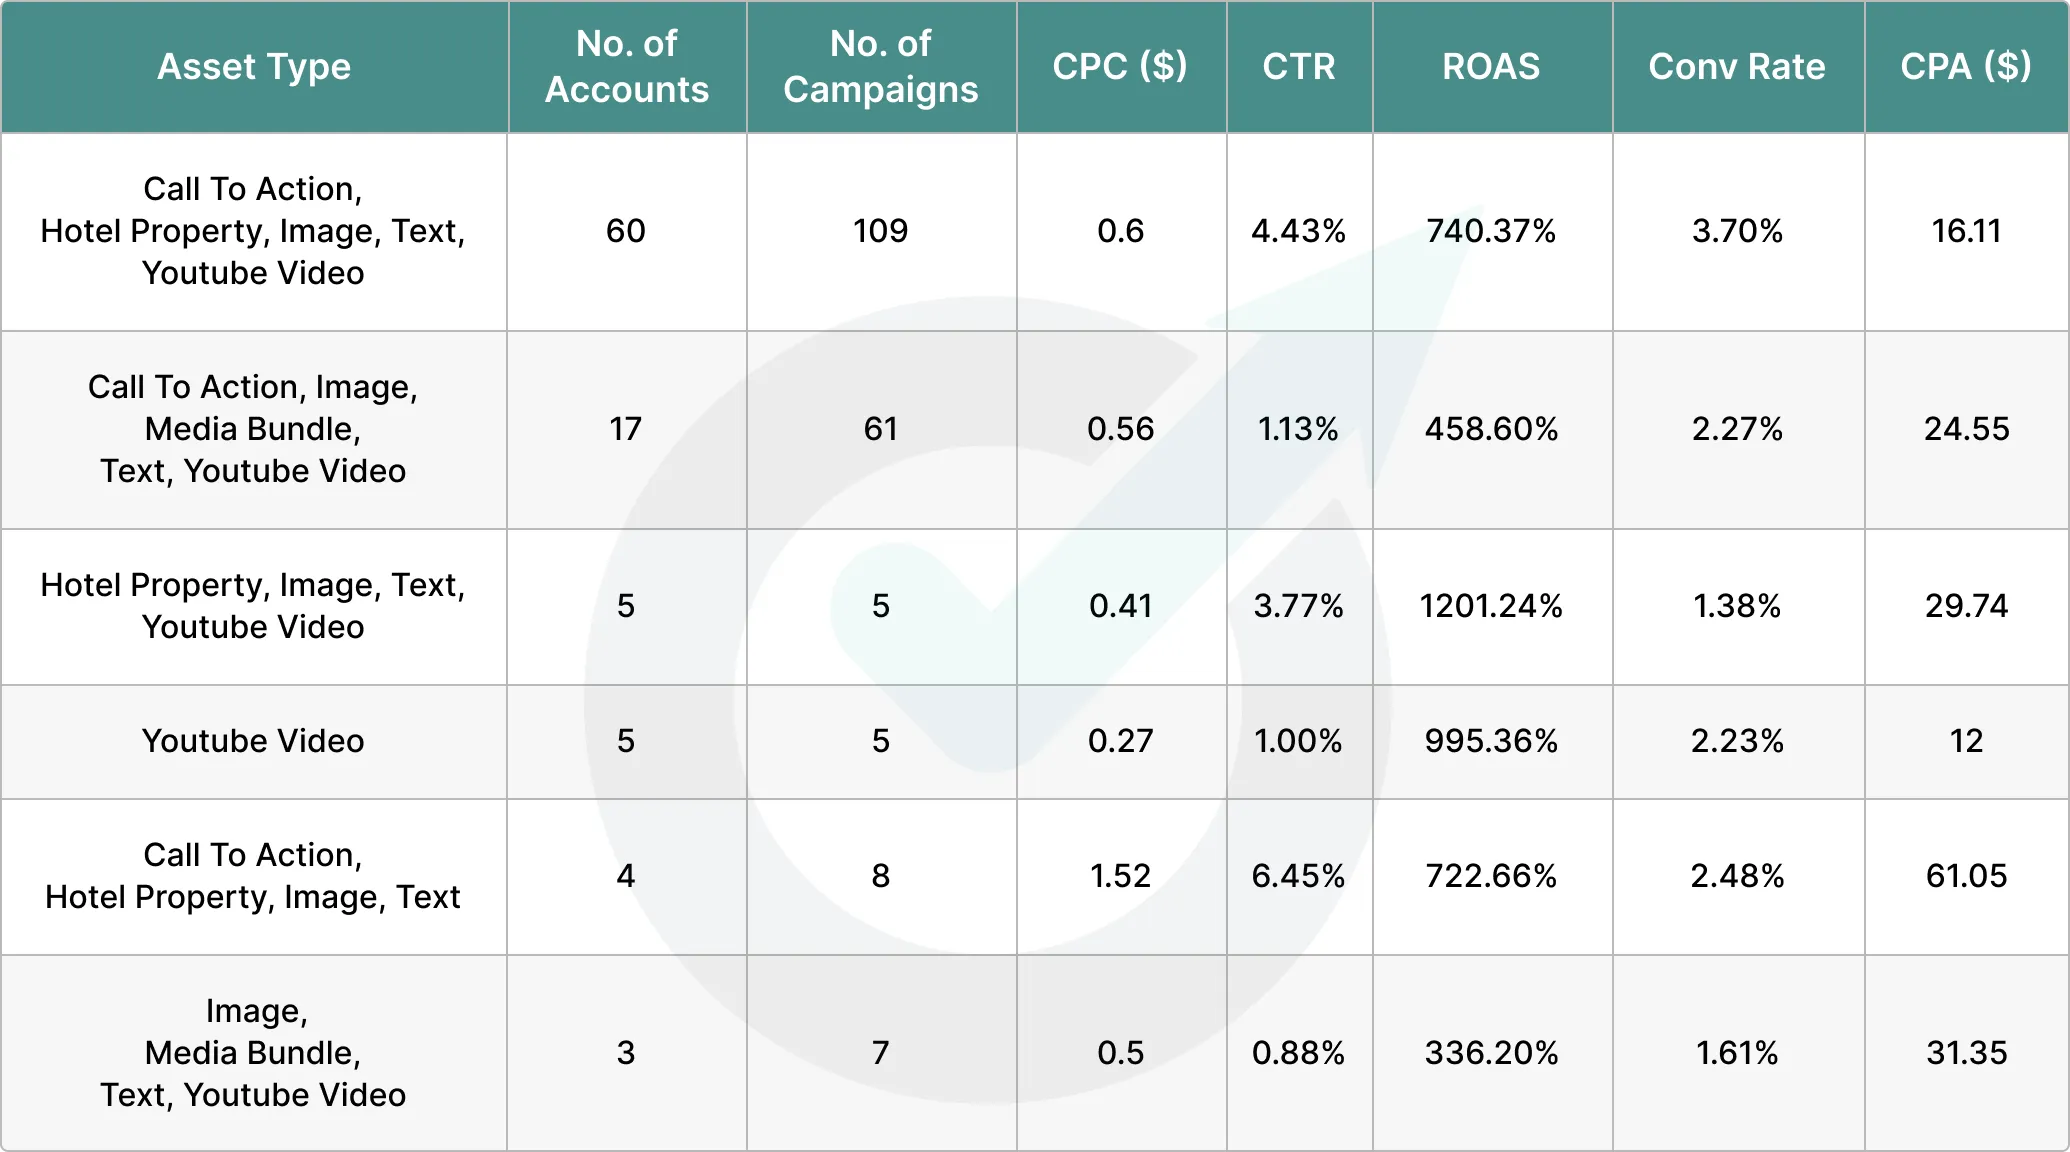
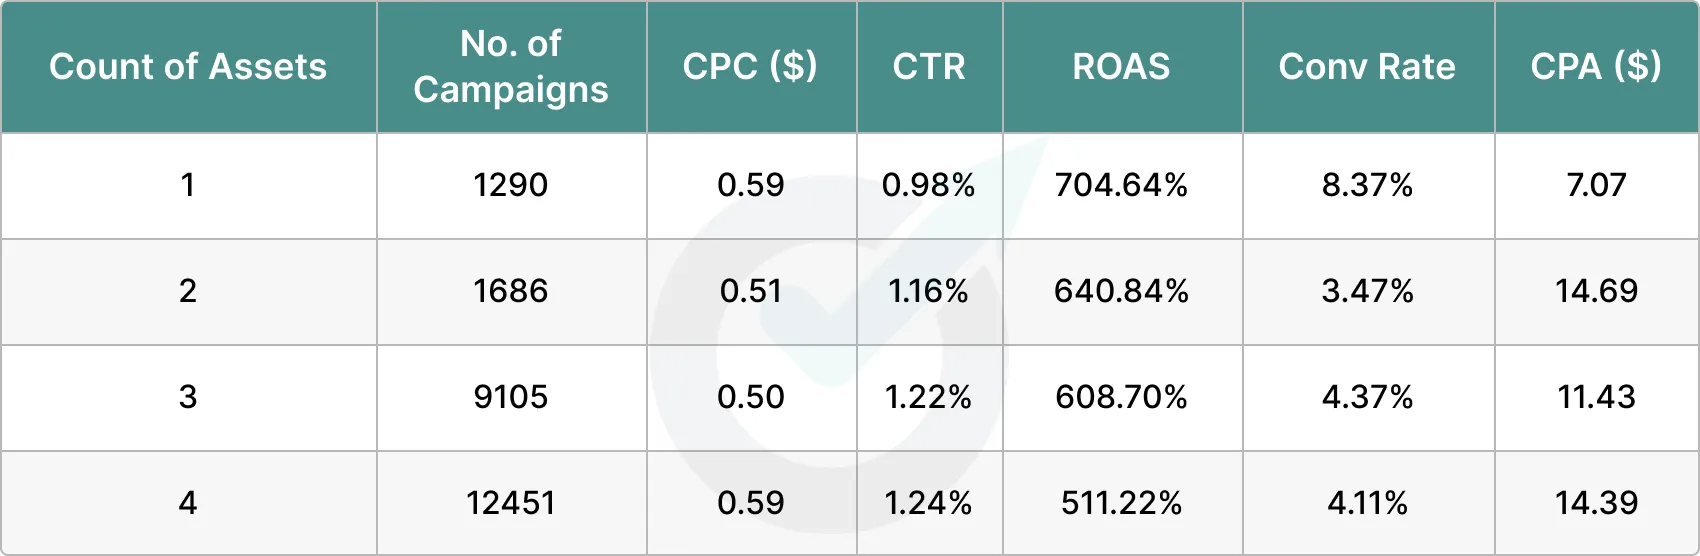
Number of Assets and Types of Assets:
*note there aren’t enough statistically significant amount of advertisers using hotel ads, but we wanted to share the data for those who do use that format.
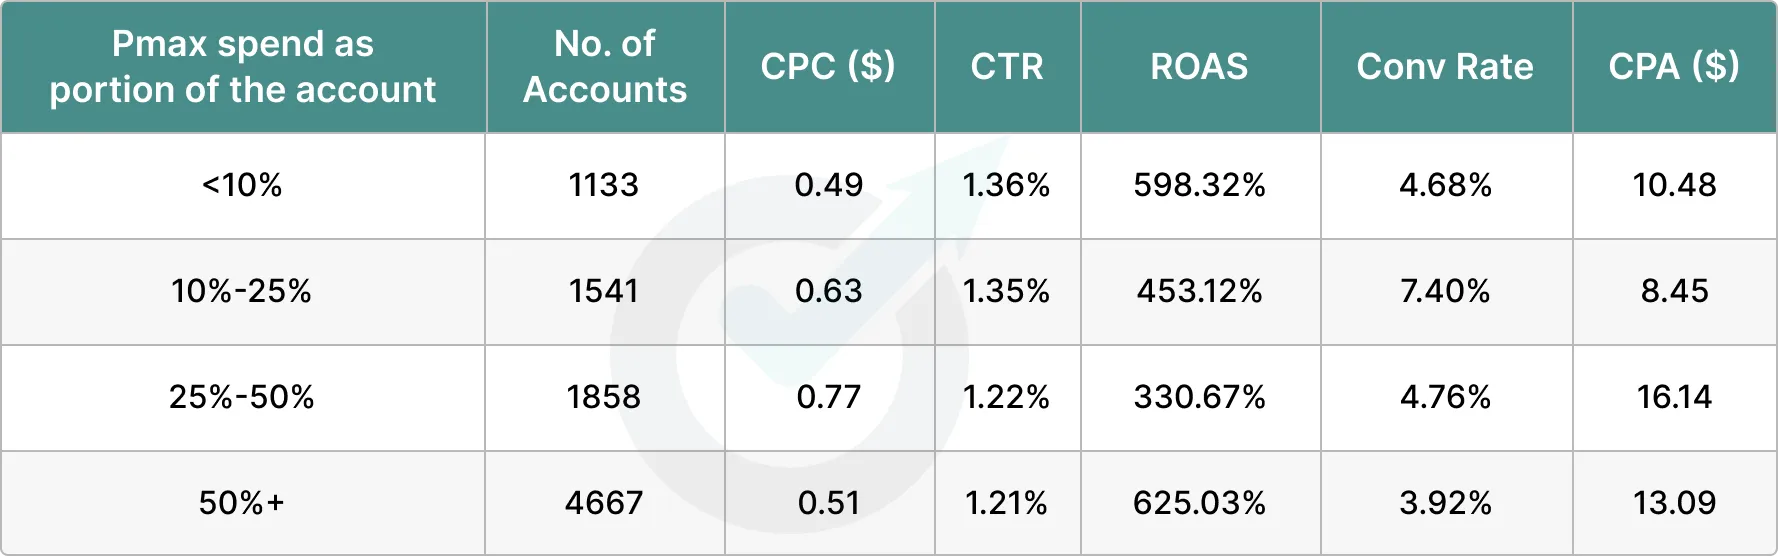
Percentage of Spend Going To PMax:
What Are Most Advertisers Doing & Is It Profitable?
We organized the findings by major category.
PMax Structural Choices
Most advertisers (82%) in the study run Performance Max alongside other campaign types. The data shows PMax campaigns struggle when paired with other campaign types, which lends credibility to Google’s claims that other campaigns will take priority over PMax.
In addition, there is no clear majority on PMax structure. With that in mind, multiple campaigns with a single asset groups have the best ROAS, second highest conversion rate, and CPA. A single campaign with one asset group might win on CPA and conversion rate, but has the weakest ROAS.
A slight majority of advertisers (55%) don’t use feeds in their PMax campaigns, and see better conversion rates and CPAs, with weaker ROAS. One can infer accounts with feeds are ecommerce and using Max Conversion Value.
Most accounts meet the 60+ conversion threshold needed for success with PMax. Those who didn’t saw worse performance across the board (save CTR).
Pmax Strategy Choices
A slight majority (55%) use the Max Conversion Value bid strategy. 45% use thes Max Conversions bid strategy. Predictably, Max Conversion Value does better with ROAS, while Max Conversions does better with CPA and conversion rate. CPCs and CTR are slightly better for Max Conversion Value.
Surprisingly, the majority of advertisers don’t use exclusions (brand lists, negatives, topics, and placements). Most advertisers (58%) saw a slight improvement in performance when they had no exclusions, but it was ultimately flat. It’s worth noting almost no advertisers use the brand list exclusions (97%) and it was even flatter.
Ninety-two percent of advertisers use audience signals and their accounts struggled on all metrics, save for CTR and ROAS (which were essentially flat). This puts in question whether it’s worth the effort to add in audience signals and if the data seeding the signals can be trusted.
Seventy-one percent of advertisers use search themes and results are mixed, but mostly favor NOT using them.
Most marketers (57%) use all assets available (call to action, text, video, and image). They achieved ‘average’ performance across the board. Interestingly, the ‘best’ performance belonged to PMax campaigns using only text assets. However, this defeats the purpose of PMax, which is designed to help budget go where it can do the most good (visual content and text content). It also illustrates that our perception of ‘best’ is skewed by a search bias.
Perhaps the most surprising insight is how much budget advertisers allocate to PMax—51% of advertisers allocate more than 50% of their budget to this campaign type. Campaigns in these accounts have the strongest ROAS, however every other metric is mixed.
What Impact Do Other Campaigns Have on PMax?
I was not expecting other types of campaigns to ‘triumph’ over PMax campaigns in the same account: Many advertisers assume that PMax will cannibalize branded search and will get preferential treatment in the auction. However, the data seems to suggest that PMax almost always takes a backseat to siloed campaigns.
While the most common other campaign type (Search) had the most obvious wins over Pmax, Shopping had fairly impressive wins as well.
It’s worth noting that visual content (Video and Display) is fairly flat on ROAS, and Display is flat on CPA. This suggests that these campaigns are not as focused on conversion.
Percentage of Spend Going to PMax:
As I mentioned above, there are a surprising number of marketers putting more than 50% of their budgets towards PMax. While these marketers saw the strongest ROAS in their PMax campaigns (625.03%), there are also potential conversion rate and CPA advantages when keeping PMax limited to 10%–25% of the budget.
Does Human Bias Help or Hurt PMax Performance?
PMax’s core guiding logic is ‘profit without bias.’ However, this is also a source of friction for advertisers who are used to having near-complete control. Based on the data, it seems like adding exclusions hurts performance.
This could be for a few reasons:
Branded traffic is cheaper and has better conversion rates. That said, performance was fairly flat between brands that excluded branded terms and those that left them in.
The exclusions were too strict and caused performance issues due to missed placements.
While we can’t say that the exclusions were inherently a bad idea, they represent clear bias around what we think has value. Based on the data, there may be value in loosening exclusions, leaning into content safety settings instead.
The relatively flat performance between these differing tactics is interesting, but not conclusive.
How Do Creative & Targeting Choices Impact PMax?
There’s a common assumption that doing more work on a campaign should lead to better results. Taking the time to teach the algorithm what you value should lead to better results.
However, the data seems to contradict this assumption.
Impact of Audience Signals:
Impact of Search Themes:
As we can see, performance is flat (or worse) when Audience Signals and Search Themes are included. This seems to indicate that investing the effort on these tasks isn’t worth the ROI.
However, it’s also worth remembering PMax will take a back seat to siloed campaigns. Search Themes remain one of the most powerful ways to ‘mark’ traffic for PMax (over siloed campaigns). This is because Google prioritizes exact search terms going to exact match.
Brands should be intentional with audience signals and search themes, treating them as guidelines instead of hard targets.
With regard to creative, while the majority of advertisers lean into all assets, there seems to be a decided benefit to just including the assets you can reasonably support. There is no denying the text-only asset cohort skews the numbers for including one asset, however the correlation on ROAS supports not including creative just for the sake of it.
It’s also important to remember the wide ranges of CPAs reflect a wide range of industries, and there are some categories with statistically insignificant data.
Number of Assets and Types of Assets:
If there’s one ‘magic’ creative button for PMax, it’s video. While text-only had the best overall metrics, those are limited exclusively to Google Search. Video’s strength is that it keeps up with text while accounting for lack of focused transactional intent.
From these two datasets, you can see that it’s best not to mindlessly fill out all the fields. Be intentional about your targeting and creative choices, honoring the point of the ad channel you’re using to reach customers.
What Does a Healthy PMax Campaign Look Like?
Now that we’ve investigated what the majority of advertisers are doing, let’s look at some directional queues we can take from the data.
PMax Structure:
The metrics seem to favor running multiple campaigns with one asset group per campaign, allowing brands to utilize unique budgets and negatives. However, there are also CPA and conversion rate gains associated with one campaign-one asset group.
This inspired us to investigate whether the latter group were ecommerce advertisers building on the habit of Smart Shopping (which didn’t require as much segmentation). However, most marketers in this category didn’t attach a feed and had better results. So, there is something to the single campaign and asset group strategy.
These findings run counter to the data that we pulled last time and shows Google has significantly improved how it understands user queries. That said, if you can find the conversions, multiple campaigns with a single asset group are the way to go because they guarantee budget access for the parts of your business you care about.
We took some benchmarks on how most of the 9,199 accounts are structured and found the following averages:
3 PMax campaigns per account
4 asset groups per campaign
34 assets per asset group
We explored accounts that fell below and exceeded these numbers:
These figures are mostly impacted by the number of asset groups and assets. The data seems to indicate fewer and more thoughtful entities have a higher chance of success than loading up on all the assets and asset groups.
Finally, we couldn’t have a complete conversation about healthy campaigns without diving into conversion thresholds.
How Many Conversions Does PMax Need?
It shouldn’t surprise anyone that PMax needs more conversions to be useful, but what is surprising is how flat CTR is compared to conversion rate. I would have expected CTR to have more volatility at lower conversion rates, (due to Google trying to figure out which traffic is valuable).
This data supports the idea of limiting campaigns if you won’t be able to hit 60+ conversions in a 30-day period.
Tactics from the Data
As we stated previously, we’re not going to declare one path as correct or incorrect. However, based on the data, we feel confident sharing the tactics below:
Multiple asset groups in the same campaign don’t work as well as ad groups in a campaign because there aren’t asset group-level negatives. Depending on your budget and ability to meet conversion thresholds, you can decide to run a single PMax campaign with a single asset group or multiple campaigns with a single asset group.
Be careful about biases on where ads should serve and how many negatives to include. While some exclusions are necessary for brand safety, the data is clear that PMax needs fewer limitations on its learning. Consider using account-wide exclusions over campaign-level ones.
PMax is designed to work in concert with your other campaigns, and brands that rely solely on PMax (as well as brands that run Pmax on auto-pilot) will struggle to achieve sustainable results. Brands that use PMax as a testing ground for keyword concepts, placements, and other insights will get more out of this campaign type because they are allowing the bias-free traffic to add incremental gains.
Experts React
“It was super exciting to dive into research that explores such a dynamic and evolving campaign type as Performance Max (PMax). This study offers valuable insights that both confirm and challenge established PPC strategies.
One of the standout findings is the critical importance of conversion volume. The data reinforces the idea that achieving an optimal level of conversions is essential for campaign performance. This makes it a key consideration when planning or restructuring campaigns - ensuring enough conversion data is present to enable effective machine learning and optimization.
I also found the analysis of campaign and asset group configurations intriguing. While it would be useful to further explore how these configurations differ across ecommerce and lead generation accounts, the findings can serve as a solid foundation for further experimentation and optimization.
Moreover, the study challenges some widely accepted beliefs about audience signals and search themes. The findings suggest that adding more signals doesn’t always result in significant performance gains, which prompts a re-evaluation of the resources invested in these areas. This invites a fresh perspective on how we approach campaign management - focusing less on volume of inputs and more on the quality of core components like conversion data and asset structure.”
Julia Riml, Director of New Business, Peak Ace
“The most important finding to me (and further confirming what we already knew) is the importance of sufficient conversion volume which is important for machine learning to work to it’s full potential and which also guides our optimization steps.
The aspects I found most surprising were how many advertisers seem to be running PMAX as a standalone campaign (without search, video and display campaigns accompanying it) and that PMAX campaigns that didn’t utilize a feed (lead generation?) on average tend to perform better with regards to CVR and CPA.
Lastly, it shows the importance of diversifying your spend - the more you spend on PMAX in relation to other campaign types, the worse your CVR and CPA tend to be.
Super intriguing stuff and a must read for everyone working with Google Ads."
Boris Becceric, Google Ads Consultant, BorisBecceric.com
“I am a PMax skeptic, however this analysis presented me with a few surprises, in among what we already know to be true. It is not a surprise that PMax performs better with max conversion value and with more conversion data. However, I am surprised at the amount of advertisers spending the bulk of their budget on PMax, and at the impact (or lack thereof) of exclusions.
As with anything in the PPC world, it remains important to assess your individual business context. What metrics are most important to you? At the very least, I’d argue PMax now deserves to be tested by everyone who can accurately assess/import conversion value.”
Amalia Fowler, Owner, Good AF Consulting
“This Performance Max study provides valuable insights into the strengths and weaknesses of this Google campaign type. The most striking finding I noticed is that PMax often plays a secondary role compared to other campaign types like Search and Shopping, indicating that PMax does not always receive preferential treatment in the auction process.
The data suggests that multiple campaigns with a single asset group yield the best ROAS, and that limiting exclusions and avoiding the indiscriminate addition of assets are key to success. Despite the growing adoption of PMax, human bias can sometimes hinder performance by imposing too many restrictions. From my experience and knowledge I would highly recommend to make sure to test best practices and always be aware that it’s not a one-size fits all campaign type.”
Lars Maat, Owner, Maatwek Online
“One of my biggest takeaways from this study is that PMax seems to perform better when it’s targeted well and not used more broadly. For example, multiple campaigns with one asset group being one of the highest performers stood out to me. PMax learns at the campaign level so, perhaps these campaigns are more highly targeted allowing the campaign to learn exactly who to target. While the one PMax with multiple asset group set up more than likely has variation by product or service type meaning multiple types of customers need to be targeted. As mentioned, PMax lacks the ability to have asset group level exclusions or asset group level ROAS/CPA targets to help control for variations in users or goals. Additionally, that campaigns with fewer assets seemed to perform better suggests that more targeted creative is a better option than generic or broad assets.
Based on this study, with the data and signals that PMax has access to, it seems that focusing it on targeting one customer type with plenty of data can be a successful strategy. This would allow you to keep your creative narrow and use only very specific signals.
As always, this is another excellent thought provoking study into Google Ads from Optmyzr!”
Harrison Jack Hepp, Owner, Industrious Marketing LLC
“Another insightful case study by Optmyzr. Some of the results are consistent with the finding of the previous one on bid strategies - Max. Conv. and Max. Conv. value again deliver what is expected from them.
An important finding for me is the benchmark of 61 conversions, which can explain why sometimes single PMax campaigns can be the better option. Still, some of the results suggest that multiple campaigns with a single asset group are a great option too. For E-Commerce, I have a clear preference for Performance-Based-Bucketing and in my experience multiple campaigns deliver better performance than a single consolidated campaign.
The case study undoubtedly demonstrates that human bias can hurt performance. I was aware that Search themes have negative effects on other campaigns, but now I am surprised that they might be having them on PMax too. The most surprising results regard the use of Audience signals (associated with negative performance effects) and the efficiency of PMax for Lead Gen accounts. I am ready to adjust my strategy and leave out Search themes and Audience signals behind (probably except for Customer match and Remarketing lists) and give more chances to PMax for LeadGen.”
Georgi Zayakov, Senior Consultant Digital Advertising, Huttler Consult
“The fact that Performance Max (PMax)-only campaigns show higher ROAS doesn’t surprise me, as PMax often behaves like a bottom-of-funnel conversion campaign. When other campaigns, such as non-brand search, are run alongside PMax, I expect metrics like ROAS and CPA to be worse, since these campaigns target different stages of the funnel and often require more consideration from consumers.
One particularly interesting finding is the limited use of PMax alongside YouTube video campaigns. Despite the control YouTube offers, PMax seems to underutilize video, reinforcing its role as a bottom-of-funnel tool, however I would have expected the ROAS difference to be higher.
I’ve also found that standard shopping campaigns often conflict with PMax, so seeing higher ROAS in these cases is surprising—though I’d handle this on a case-by-case basis.
The study’s insight into a single asset group driving higher ROAS is fascinating. I typically run different creatives for seasonal campaigns or separate product lines with similar margins in their own asset groups under one Pmax campaign. However, this data suggests that brands can simplify their approach, running a multi-product photoshoot with a branded YouTube video and still see success. This significantly lowers the creative burden for advertisers.”
Sarah Stemen, Owner, Sarah Stemen LLC
“My team found this report immensely helpful and illuminating. We have heard conflicting things from Google on Search themes, for instance. It was helpful to confirm our suspicions that they don’t have much impact on PMax performance so we can invest our energy elsewhere. We are still pondering the study in general as to how it will practically impact the way we segment campaigns, but there are certain things we gained immediately from it. We always create Standard Shopping campaigns in accounts, even if they are PMax heavy, so it was encouraging to see this supported in the study and we have more confidence in the energy we invest in that effort now that we have read the study. I also was particularly intrigued by another study (similar to the one Mike Ryan and SMEC did awhile back) looking at conversion volume. Without a doubt now after these two studies, a significant amount of conversions are needed to increase confidence levels in PMax success. Overall, I found this study thought-provoking and practical, thanks Optmyzr team!”
Kirk Williams, Owner, Zato PPC Marketing
Final Takeaways
PMax’s evolution invites us to evaluate our previous strategies. Where exclusions and specific human control used to be key to success, we seem to be entering an era where we won’t have enough data to make those choices ourselves.
However, key business info (conversion value/efficacy, removing existing customers/users who won’t be a good fit, and creative) still require human involvement.
If you’re looking for ways to achieve better automation layering, Optmyzr can help! Between our tools to help with PMax search term analysis, budget allocation, and removing bad placements, there’s a whole world of innovations and optimizations to explore.
One of the most critical parts of advertising is choosing the right bidding strategy for your campaign. However, with so many conflicting viewpoints (usually data backed and/or voiced by experts), it can be hard to understand what the right strategy for your client(s) should be.
To that end, we wanted to examine two key questions:
Which bidding strategy performs best over the most accounts?
When advertisers use more than one bidding strategy, what percentage of ad spend goes to which strategy?
Methodology: Data Framework and Key Questions
First, let’s look at how this study is organized. We divided the data and questions into the following sub-questions:
Which is the best overall bidding strategy: Smart, Auto, or Manual bidding?
Do bidding strategy targets help improve campaign efficiency?
Do bid caps help improve campaign efficiency?
What are the real conversion thresholds for optimal performance?
Does spend influence the success of a bidding strategy?
What percentage of advertisers use more than one bidding strategy?
Does The Data Translate To Lead Gen & Ecommerce?
Criteria and Definitions
To answer these questions, we did a deep dive into the international Optmyzr customer base. This study looks at all Google bidding strategies (with some inferences applicable to Microsoft Ads) across 14,584 accounts. We applied the following criteria:
Accounts must be at least 90 days old.
Accounts had to have conversion tracking configured.
Accounts must spend at least $1,500 and could not spend more than $5 million per month.
Before we dive into the data, it’s important we clarify a few key terms:
Smart bidding — Bidding managed by an ad platform based on conversion data
Auto bidding — Bidding managed by an ad platform based on clicks or impressions
Manual bidding — Bid and bid adjustments managed by a human
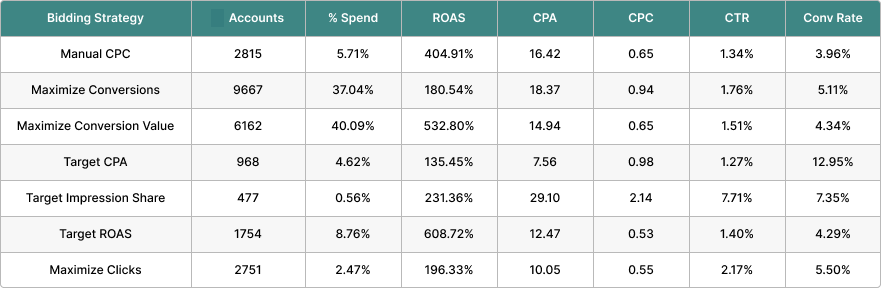
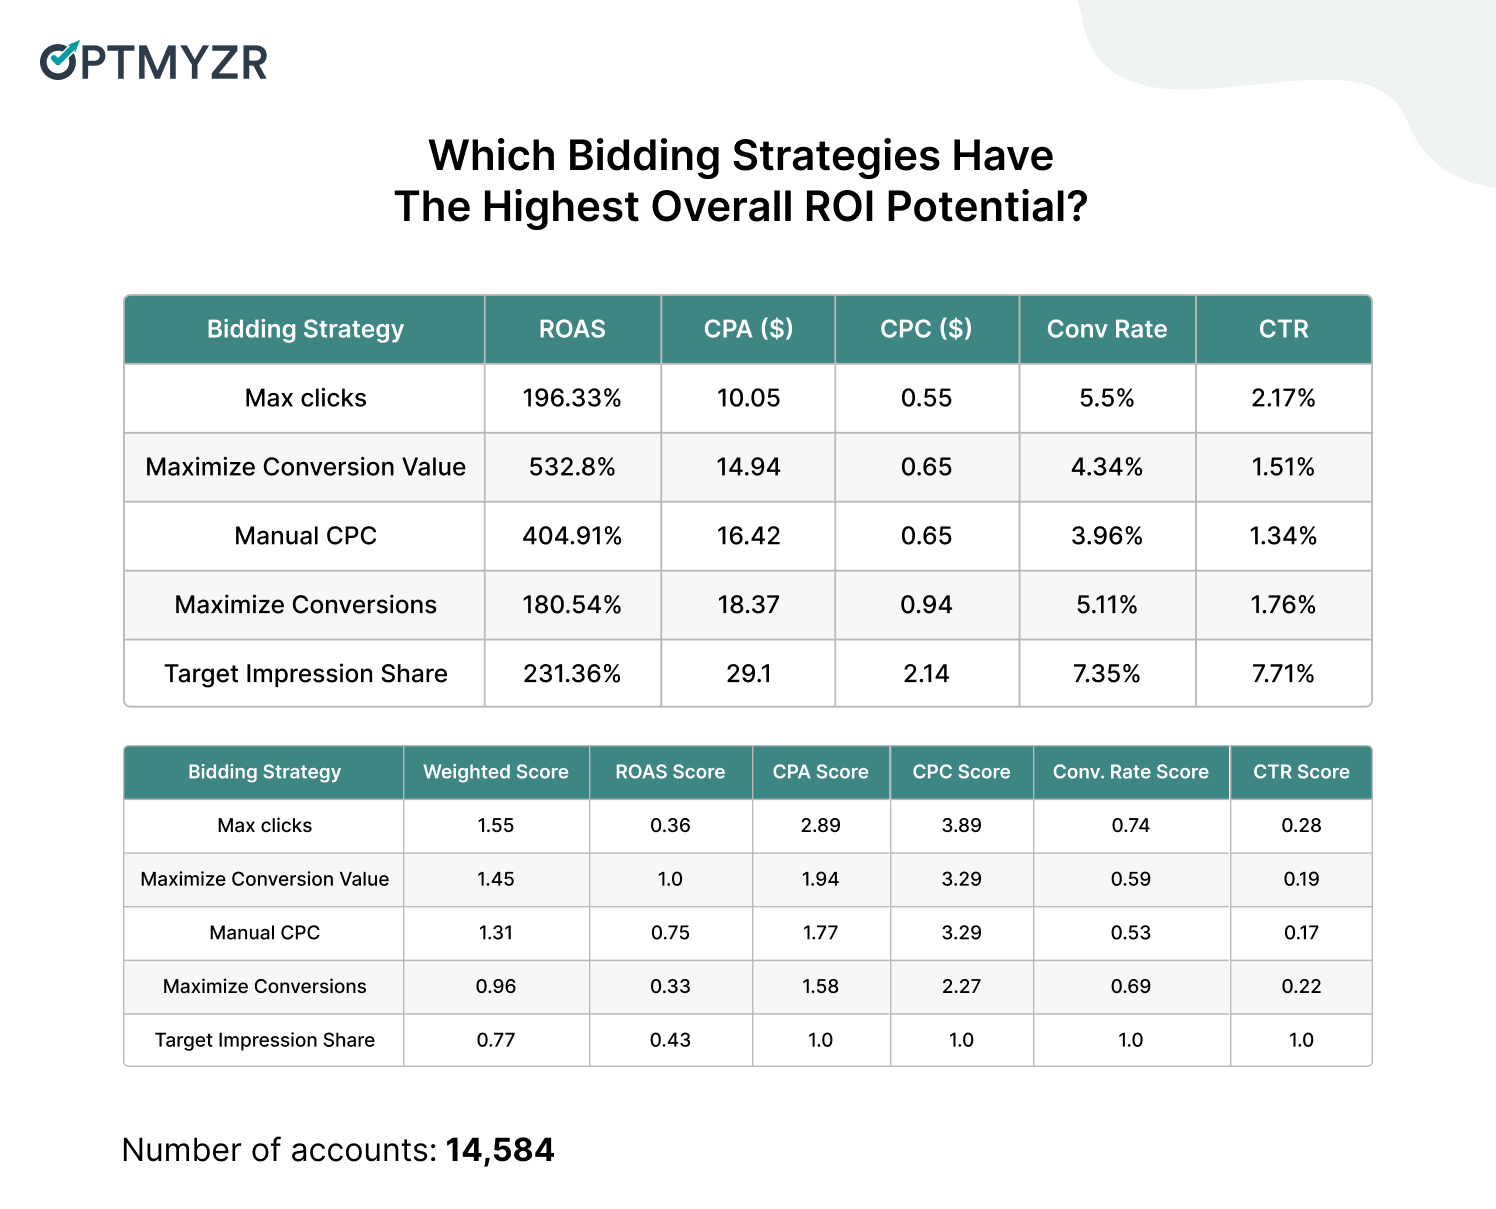
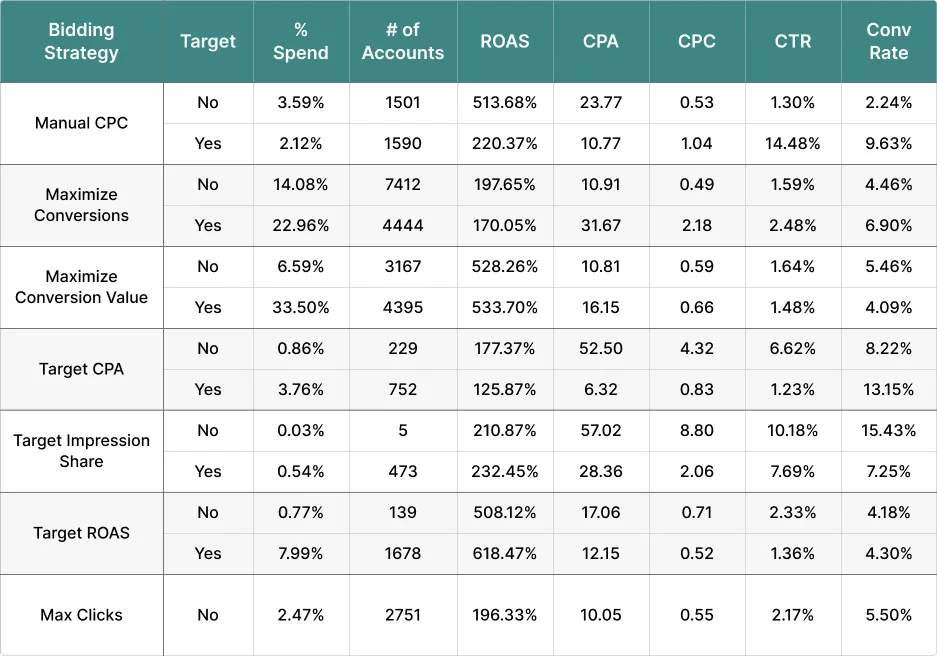
1. Which Is the Best Overall Bidding Strategy: Smart, Auto, or Manual Bidding?
Before we go over observations and takeaways, it’s really important to understand that the data may point to a ‘winning’ strategy that may not work for you and your business. Always factor in your own business conditions before making bidding decisions.
We’ll first share with you the raw data, then we’ll share the ranking based on weighting the following metrics in descending order:
ROAS: 40%
CPA: 25%
CPC: 15%
Conversion Rate: 10%
CTR: 10%
Observations:
Max Conversion Values continues to beat Max Conversions with a significantly better ROAS, CPA, CPC. While conversion rate and CTR are slightly better for Max Conversions, Max Conversion Value wins where it matters (ROAS).
Max Clicks delivers acceptable performance and is an underutilized bidding strategy.
Manual CPC is not the outright winner in any category, but delivers strong performance. The caveat to this is it’s not as efficient for CPA, CTR, or conversion rate.
Target Impression Share’s metrics indicate top-of-page placement helps CTR and conversion rate, but won’t actually help with profit metrics (CPA, ROAS).
Takeaways:
There is no clear winner between Smart, Auto, and Manual bidding. All three types have strong and weak metrics.
Max Conversion Value is the most efficient Smart bidding strategy.
Maximize Clicks is the most efficient Auto bidding strategy.
Manual bidding has the third highest ROAS, but really struggles in other categories. As such, you should only use it when you can actively manage the bids (more on this in the tactics section).
There is room for testing as the stronger bidding strategies have less adoption than their weaker counterparts.
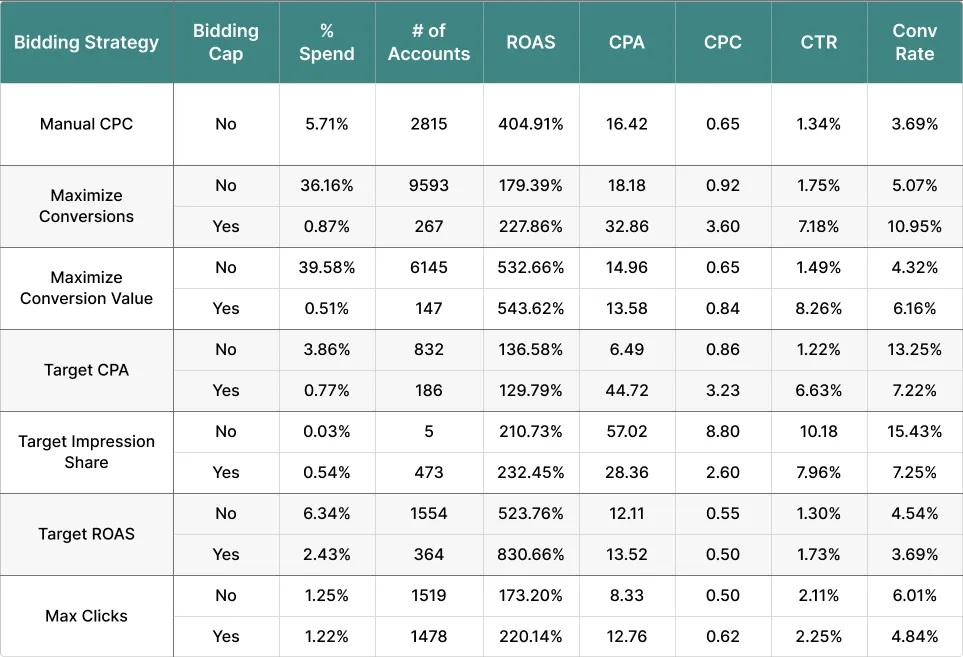
2. Do Bidding Strategy Targets Help Improve Campaign Efficiency?
With regard to targets, there are essentially two schools of thought: they’re either useful to help guide the algorithm or they represent risk due to human error.
Here’s what the data says:
Observations:
The majority of advertisers using Max Conversions do not set a target and see better performance on the most important KPIs like ROAS and CPA than those who do.
It’s a similar story for Max Conversion Value; advertisers who do not define a target see improved results for all metrics except ROAS which has a slight dip but is essentially flat. However, the majority of advertisers do set a goal.
There doesn’t appear to be a bidding strategy that significantly benefits from adding a goal, which is unfortunate because adding goals is tied to bid caps and floors. It’s unclear if this is due to human error or the nature of goals themselves.
This is where we get to see the real impact of eCPC (retiring March 2025). While conversion rates and CPA are great, the ROAS doesn’t meet expectations. However it is worth noting that eCPC beat Max Conversions
Takeaways:
Setting targets for bidding strategies has a higher likelihood of hurting accounts than helping them.
The only bidding strategies where targets appear to help are Manual bidding and Target ROAS. It seems reasonable to assume that if an advertiser is willing to take on the work of bid adjustments and accurate revenue/profit sharing, they will set accurate bidding goals.
3. Do Bid Caps Help Improve Campaign Efficiency?
One of the biggest reasons to opt into bidding goals is to access bid caps (and floors). A bid cap is the most you’re willing to let Google bid, while the floor forces Google to use a minimum bid for all auctions. You can access these settings through portfolio bidding strategies for Smart bidding and Max Clicks/Target Impression Share.
Observations:
Whether or not bid caps are used has no consistent impact on performance, which explains why most advertisers don’t use them. This also explains why some advertisers avoid bidding goals (given that bid cap access is one of the big benefits of goals).
ROAS-oriented bidding strategies seem to benefit the most from bid caps. CPA-oriented bidding strategies are mixed (decent ROAS, but weak CPA and CPC). CTR and conversion rates are strong but not strong enough to make up for almost double the CPA.
While Max Clicks appears to have mixed results with bid caps, Target Impression Share clearly needs them (note: there wasn’t a statistically significant sample size for non-bid cap Target Impression Share).
Takeaways:
Most advertisers don’t use bid caps. Whether this is a good or bad thing depends on the bidding strategy.
Bid caps are not inherently good or bad, however they do introduce the potential for human error.
Bid caps (and floors) only make sense to use if you also apply intelligent bid caps and floors.
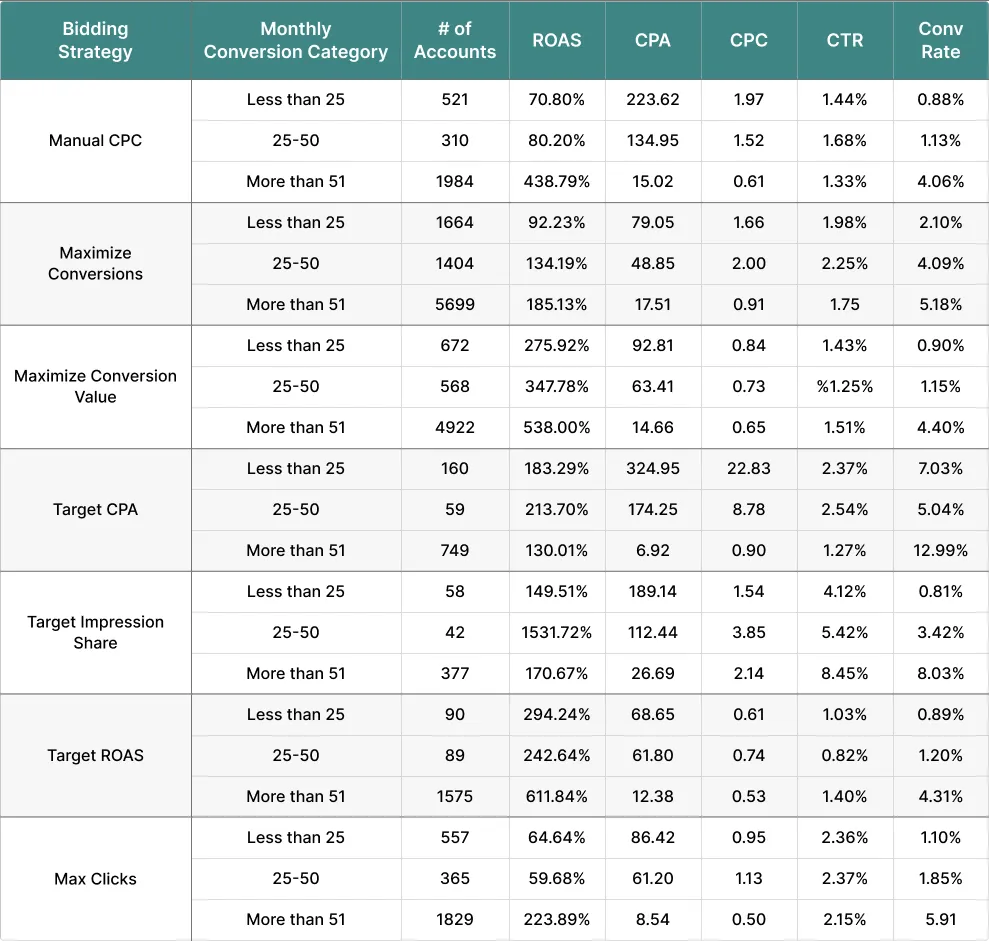
4. What Are the Real Conversion Thresholds for Optimal Performance?
We’ve long since passed the ‘15 conversions in 30 days’ era of Smart bidding. Ad platforms recommend that we meet minimum thresholds to see success. However, we weren’t sure what the threshold actually is for different types of bidding strategies…enter the data!
Observations:
Most advertisers clear 50+ conversions in a 30-day period and see better performance compared to accounts with fewer conversions.
The jump from under 25 conversions to 25–50 conversions doesn’t always result in a performance improvement. This may explain why some advertisers don’t trust Smart bidding at lower conversion volumes.
Manual bidding also benefits from high conversion volume.
Max Conversion Value has a slight edge over Max Conversions at all conversion volumes, indicating that Google has an easier time working with conversion values than stand alone conversions.
Takeaways:
The threshold for any bidding strategy to be predictably successful is 50+ conversions.
Some success can happen at lower thresholds, but there’s more volatility.
Manual bidding also benefits from higher conversion volumes, so if your only reason for choosing manual bidding is your lack of conversion data, we recommend finding ways to increase conversion volume.
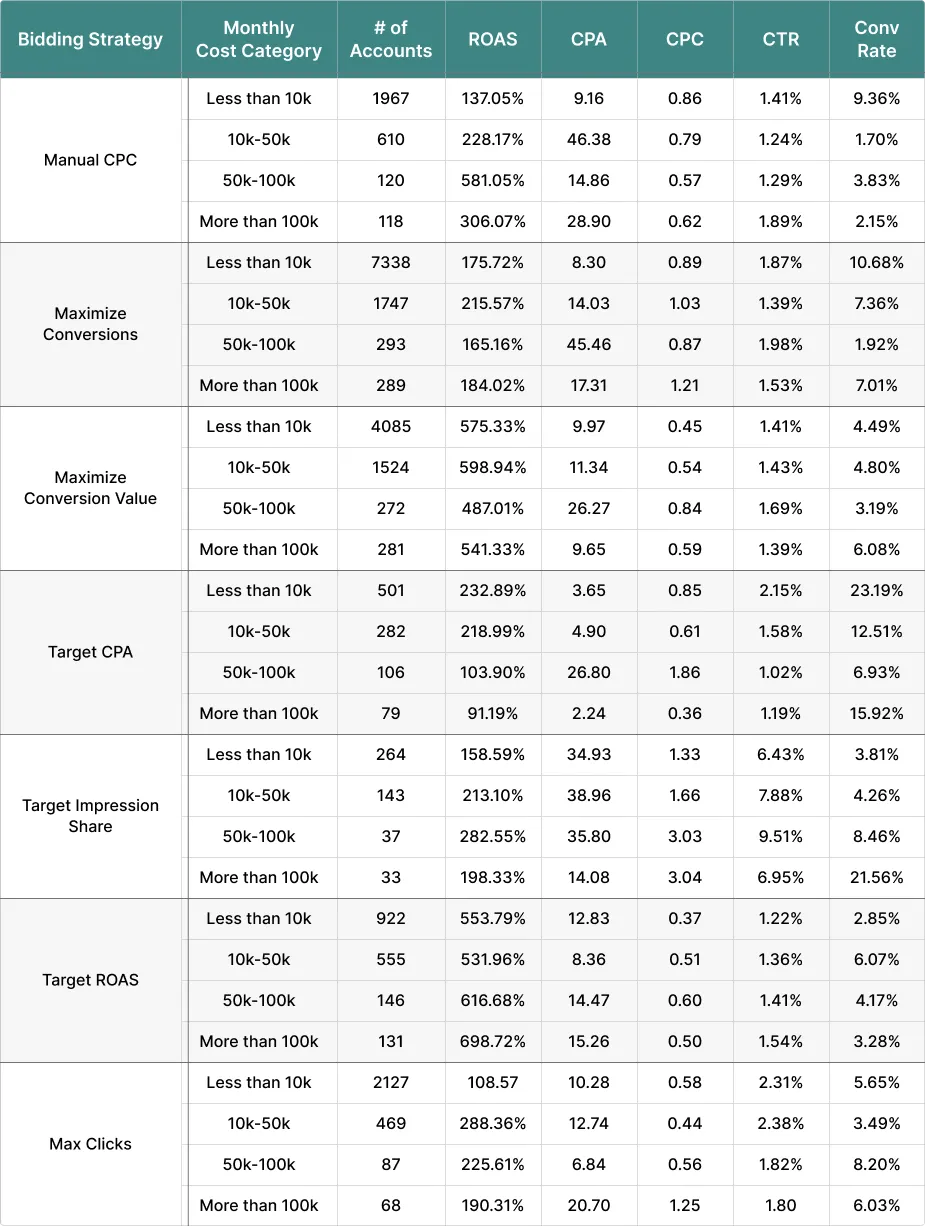
5. Does Spend Influence the Success of a Bidding Strategy?
One of the most common assumptions around Smart bidding is that it requires big budgets to be successful. We were curious if this held up across all bidding strategies.
We ranked the bidding strategies by their probability to achieve profitability at lower spend levels (using the same criteria as before) from highest to lowest:
Observations:
The only bidding strategy where performance consistently improves as spend increases is Manual bidding.
The sweet spot for Smart bidding appears to be $10K–$50K (focusing on ROAS and CPA). Conversion rate and CTR seem to favor higher spend, but those aren’t profit metrics, which might explain why some brands tank their campaigns with large budget shifts if/when they move to Auto or Smart bidding).
Most advertisers using Max Clicks are low budget accounts, which makes sense given the conventional wisdom that ad accounts need big budgets for conversion-based strategies.
Takeaways:
As long as you have the conversions, low spend shouldn’t get in the way of Smart bidding.
The only bidding strategy that seems to handle big changes to budgets consistently is manual. Every other bidding strategy does best with specific spend brackets.
6. What Percentage of Advertisers Use More than One Bidding Strategy?
An interesting finding that came out of the data is exactly how many advertisers use multiple bidding strategies in the same account.
Category
COUNT of accounts
% of accounts
Multiple bidding strategies
7,061
48.42%
Single bidding strategies
7,523
51.58%
Observations:
Most advertisers use the same bidding strategy throughout their account.
Those using multiple bidding strategies seem to have a ‘starter’ bidding strategy as campaigns ramp up, and then transition to others.
Those sticking with one bidding strategy seem to have ‘loyalty’ to one. They stick with the same bidding strategy regardless of performance fluctuations.
Takeaways:
Testing bidding strategies is healthy but it’s not mandatory for success. Clinging to one bidding strategy may be comfortable, but it’s not as risk averse as it seems.
7. Does The Data Translate To Lead Gen & Ecommerce?
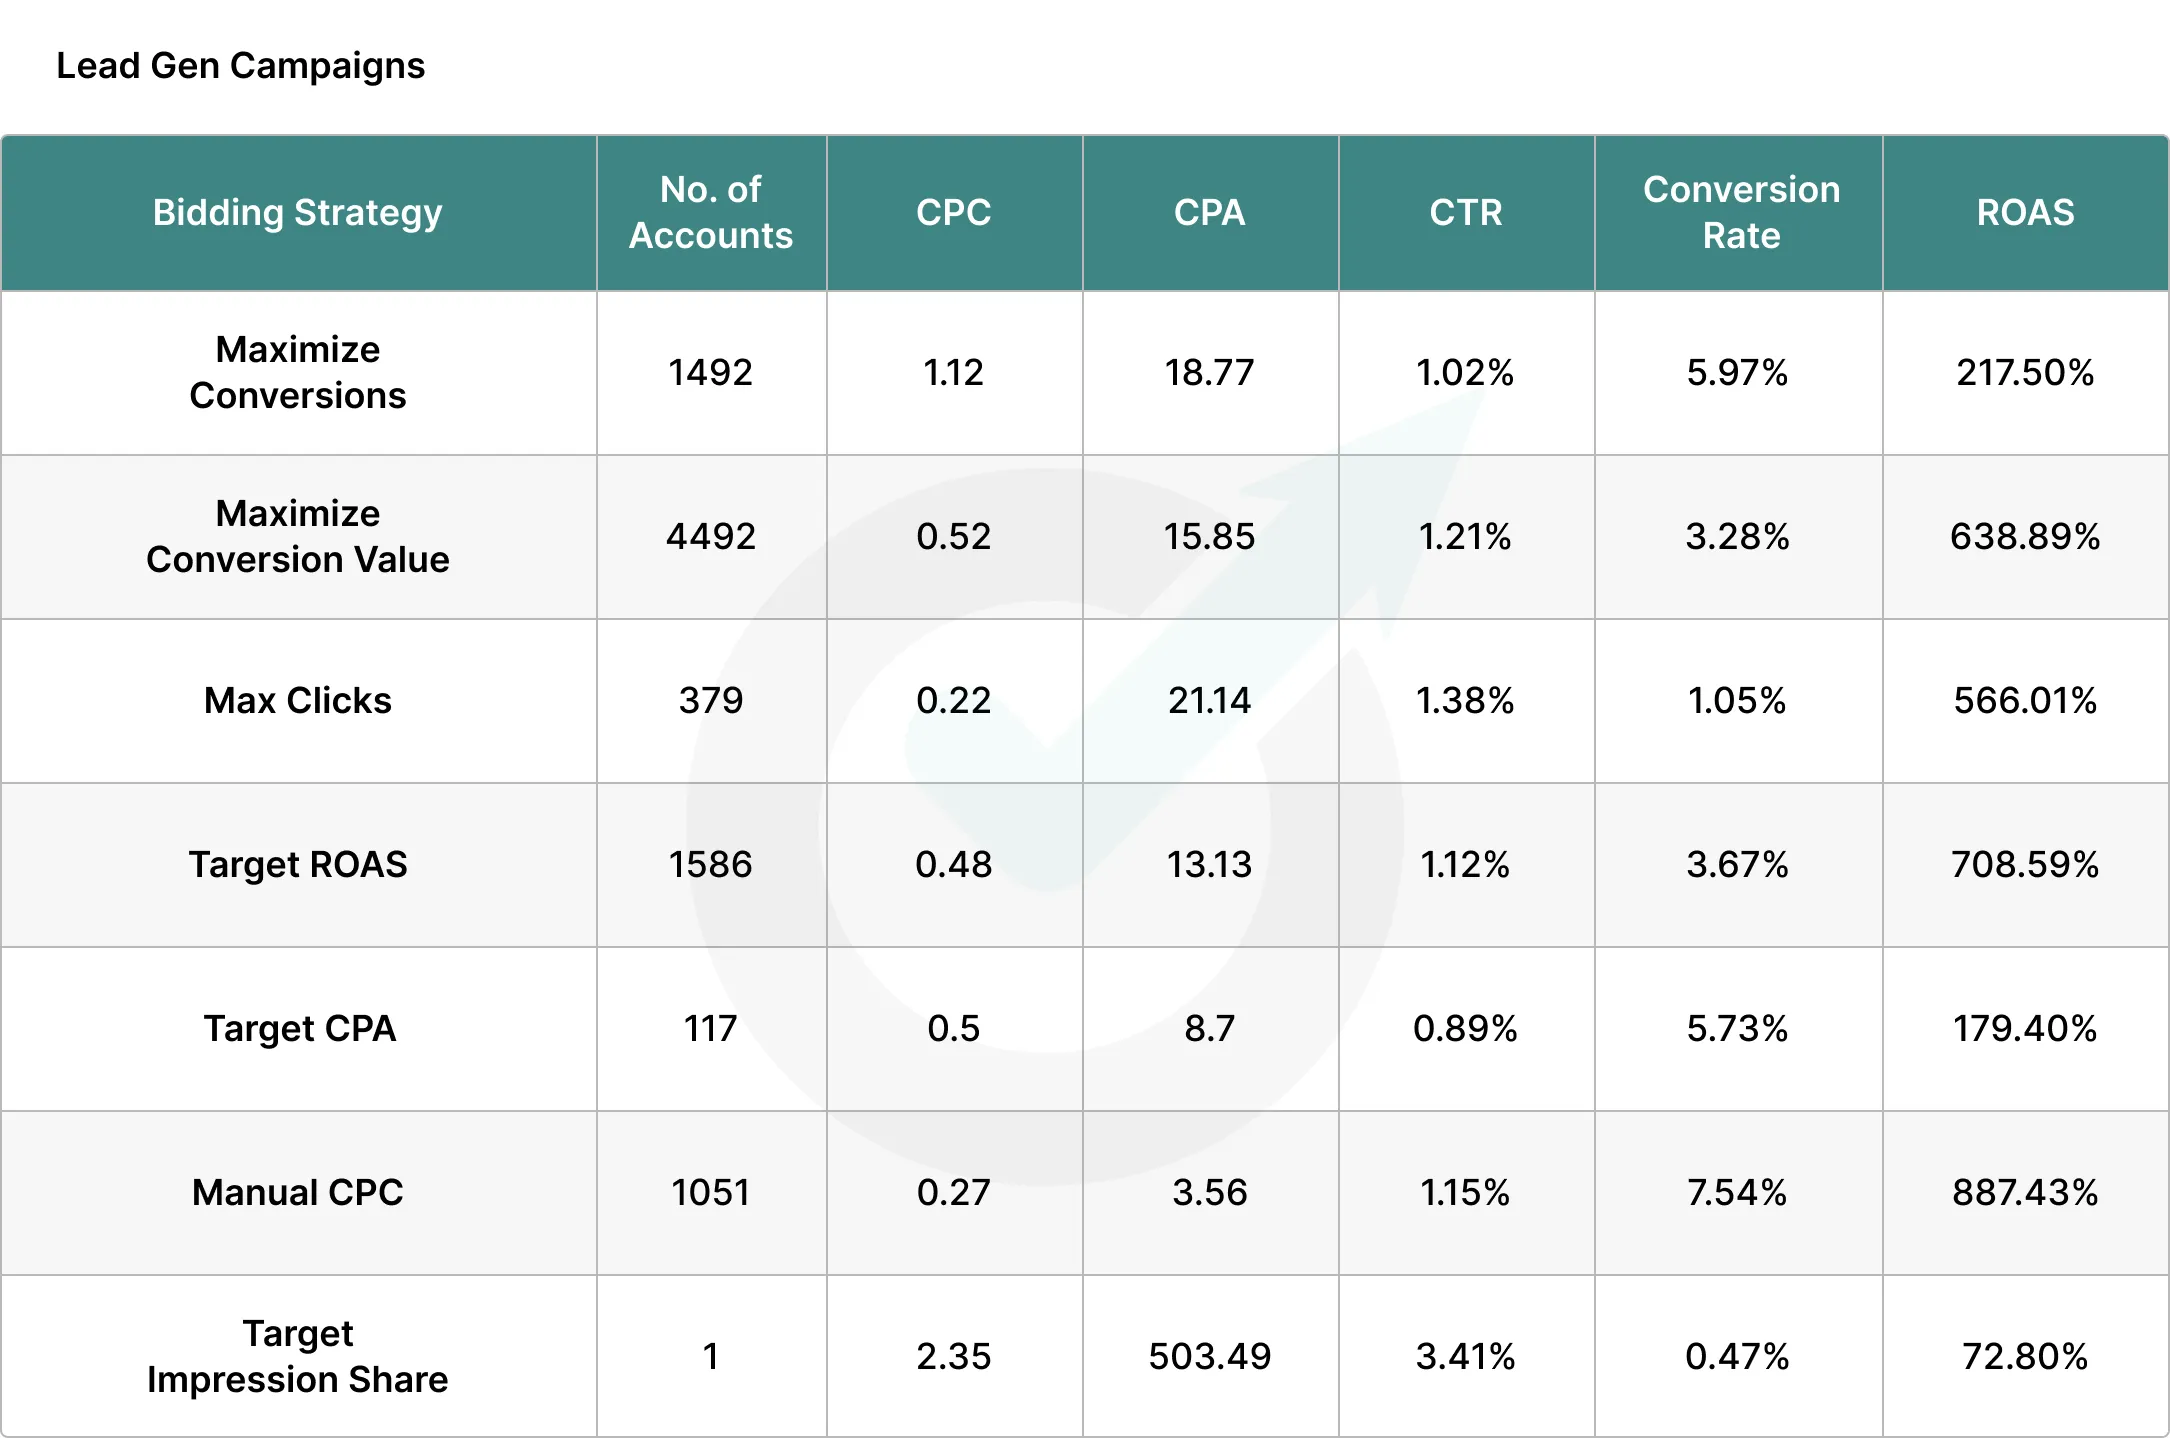
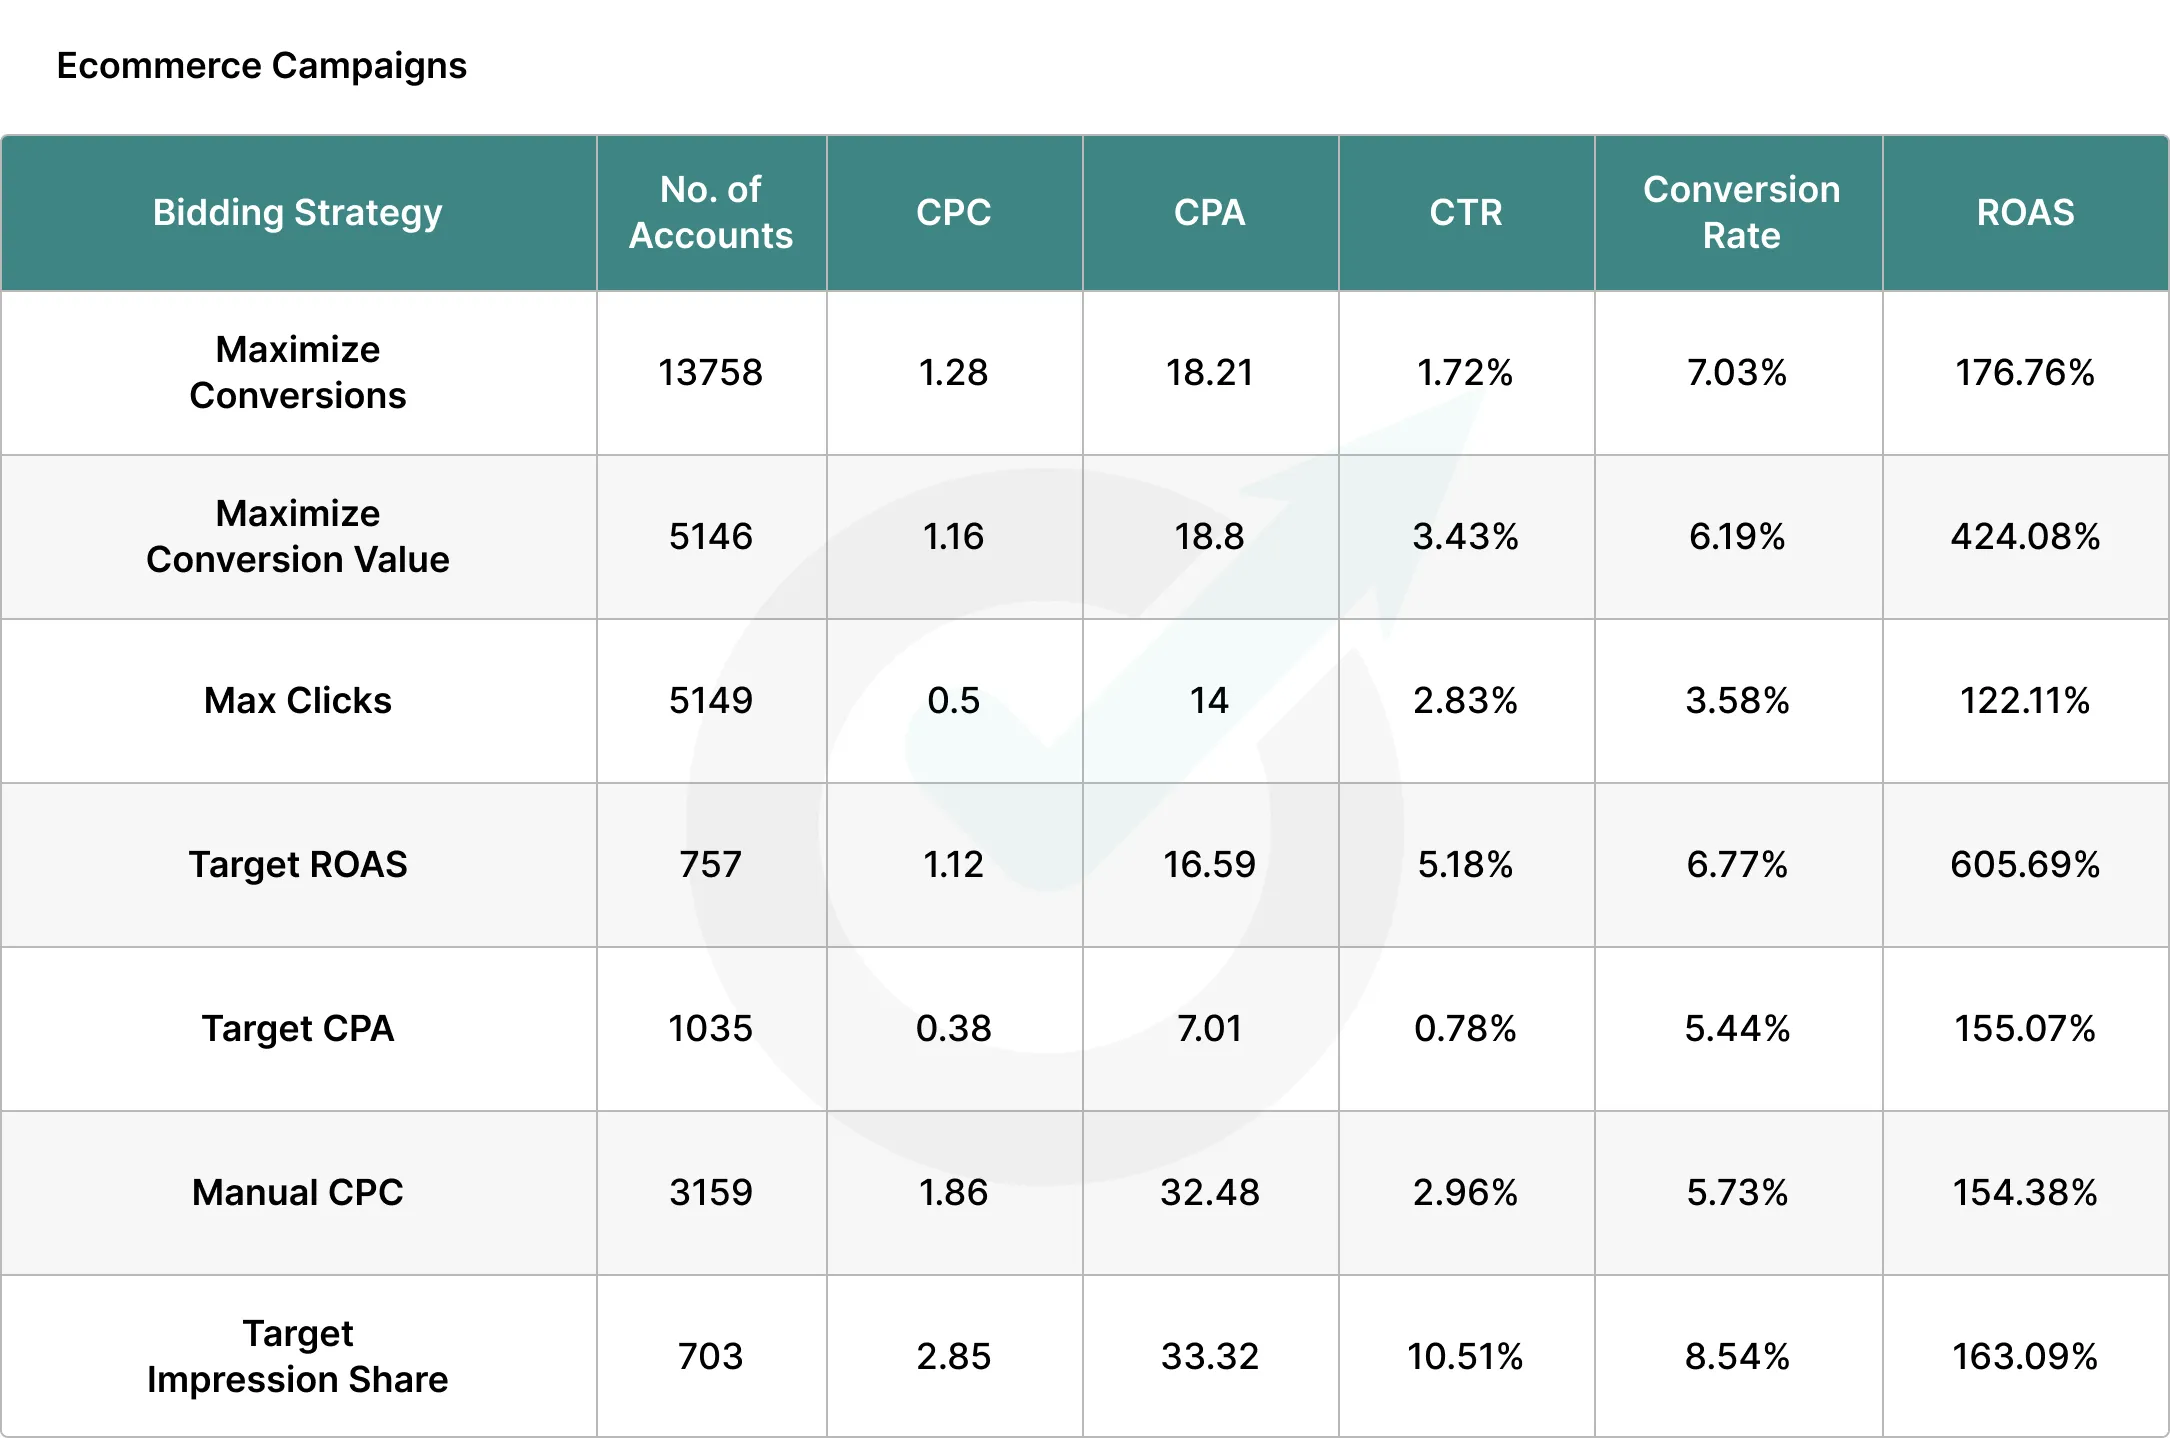
There is no denying lead gen and ecommerce strategies are different. As such we wanted to share the data of how bidding strategies fared with each account type.
Observations:
Max Conversion Value continues to dominate in lead gen. While CTR and Conversion Rate are lower than ecommerce, all metrics beat out Max Conversions.
Ecommerce advertisers seem to struggle with Manual CPC and Max Conversion bidding. I find it odd how many ecommerce advertisers are using Max Conversions instead of Max Conversion Value.
While more ecommerce use Max Clicks, lead gen advertisers seem to do better with it. Manual CPC seems to be the safer “early stage” campaign bet (despite it being a weaker bidding strategy overall for ecommerce).
The most popular bidding strategy for the studied ecommerce cohort is Max Conversions. The most popular bidding strategy for the studied lead gen cohort is Maximize Conversion Value. This was a shocker, because
Some of the cheapest Lead Gen CPCs and strongest ROAS was with Max clicks and manual CPC.
Takeaways:
Lead Gen Max Conversion Value outperforms Max Conversions by almost 300% on ROAS. This supports advertisers using Max Conversion values regardless of whether they are lead gen or ecommerce.
Tactics from the Data
There are a lot of tactics that come out of the bidding strategy data, but the biggest one is not to fall into the trap of thinking that Smart or Auto or Manual are inherently better or worse than the other. It all comes down to execution and where your account is on the conversion volume/efficacy front. Many accounts use mixed bidding strategies, which speaks to the value of leveraging all the bidding strategies at each stage in the account.
As a general rule, Manual and Auto bidding are favorable in early stage accounts. This is because these bidding strategies aren’t reliant on conversions and represent learning opportunities around auction price. As an account ramps up, it’s reasonable to start testing Smart bidding (provided that you have at least 50 conversions in a 30 day period).
However, just because an account is low-budget doesn’t mean that it can’t see success with a Smart or Auto bidding strategy:
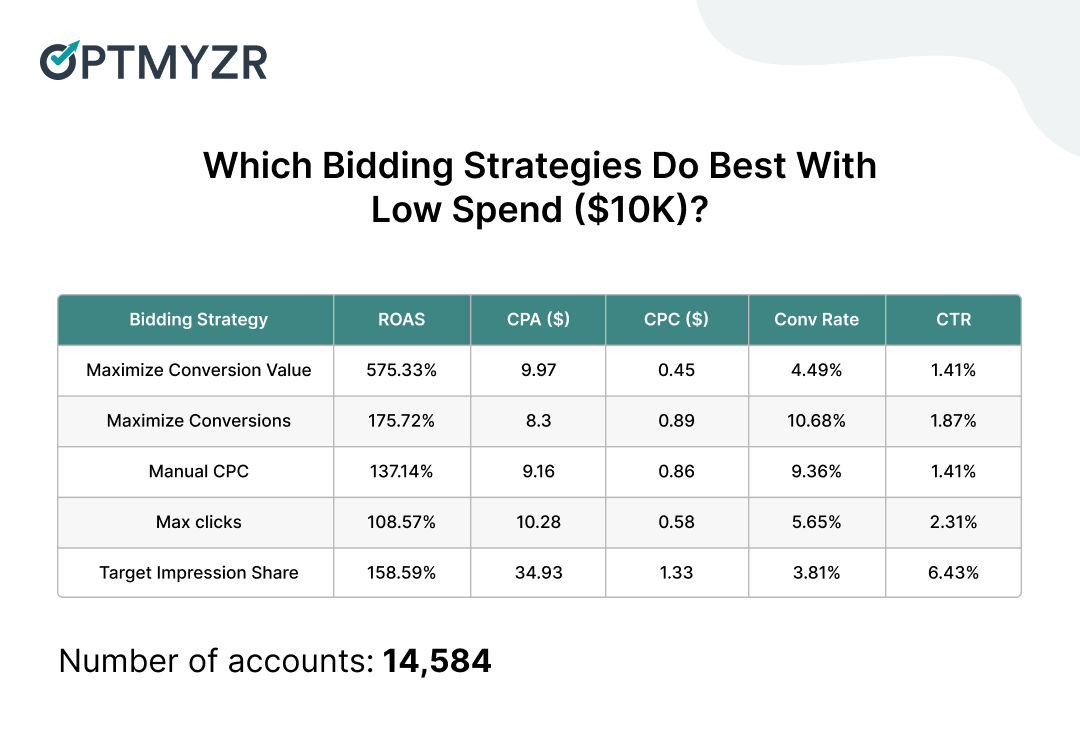
High-spend accounts ($100K+) didn’t always fare better than lower-spending accounts (i.e., less than $10K).
Maximize Conversions had a median conversion rate of 10.68% on low-spending accounts, while high-spending accounts had a conversion rate 7.01%.
While it’s true that the ROAS was slightly better (at 184% versus 175%) with higher spend, it doesn’t change the fact that the CPAs, CPCs, and click-through rates were better at less than $10K spend.
However, conversion thresholds still matter. There is no account that performed better at less than 25 conversions than those that had more than 50. In fact, even Manual bidding did demonstrably better on cost per acquisition, ROAS, click-through rate, CPC, and conversion rate when there were more conversions.
The big takeaway here is that just because your spend is low doesn’t mean you have to shy away from Smart bidding, but it does mean that you need to be honest about your conversion actions. In terms of which conversion actions you include, you can consider using micro conversions if you want to avail yourself of Smart bidding, but it’s really important that you actually put in the different conversion values for each action so that Google can get the data it needs to efficiently allocate your budget.
The other major optimization opportunity within the account is thinking about how you allocate your budget. Of all the bidding strategies, only Manual bidding had a linear correlation between budget size and bid performance. However, when you look at all the other bidding strategies, big spikes or decreases in budget did cause performance issues.
As a general rule, when you’re increasing or decreasing a budget in a Smart bidding campaign, you’ll want to make sure that you allocate somewhere between two to three weeks for that budget to settle.
In regards to bid caps and floors, as well as setting targets, I was surprised that targets seemed to hurt performance more than help it. And while I have my suspicions that human error (seting caps/goals that don’t align with the budget and targets) is part of the issue, there is no denying that applying a target represents risk.
If you’re going to use targets, which unlock the path to bid caps and floors (that can lead to performance improvements in certain cases), ensure that you apply the right targets (and bid caps and floors).
The first thing to consider is what a reasonable target for your campaign might be. So if you historically hit a $50 cost per acquisition or a 200X ROAS with no goal, it is reasonable to set a cost per acquisition goal of $45 to $55 not see any major change (i.e., you are keeping the goal +/-10% of the original performance). The moment you go beyond that 10%, you invite risk. And so the only reason to do this is if you know that the historical performance doesn’t reflect the actual results you are seeing.
For example, if you know that your conversion tracking isn’t set correctly, or if you don’t trust your data, you can play a little bit faster and looser with the settings, because the information that’s currently fed to Google isn’t accurate. And as a reminder, you may decide that you want to exclude certain data that you know you don’t trust.
When it comes to bid caps and floors, I have always endorsed keeping bids to 10% (or less) of your daily budget, so you can fit at least 10 clicks per day.
If you choose to go beyond that 10%, there’s a very real chance that you will not get enough clicks per day, and Google will either under serve your budget, or your bid floors will be too low, you’ll over serve in the wrong auctions, and you will have misguided your budget.
When setting up your bid floors and caps, be mindful that you’re doing so as corrections, not as a control lever. If you see that your impression share is historically lost due to rank, you may decide that you want to set a higher bid floor (while not including a cap) to force Google to invest your budget in the way that will serve you.
If you’re struggling on quality, you may decide that you want your bid cap to be 10% or even 15% of your daily budget, but acknowledge that you’ll get fewer clicks per day. So, you just have to account for that in your conversion rates. It’s really critical that you’re honest about the quality of your leads and what those bid caps and floors can do for them, as well as making sure that your targets are reasonable based on your historical performance.
Experts React
“This study challenges many misconceptions about Google Ads, which is thrilling! Seeing that campaigns using Target CPA achieve the lowest CPA of all bid strategies, and that campaigns using Target ROAS achieve the highest ROAS of all bid strategies, confirms the effectiveness of target-based Smart Bidding.
The most important takeaway from this study for me, however, is that budget is not the most important factor in Smart Bidding success; conversion volume and values are. Increasing your budget does not mean you’ll achieve better efficiency, but increasing your conversion volume is correlated to better results for every single bid strategy studied.
Going forward, I will continue recommending that my clients implement micro-conversions if they don’t have sufficient conversion volume, and continue recommending using conversion values even for non-ecommerce businesses.“
Jyll Saskin Gales, Founder and Coach, Jyll.ca
“My question as I read through all the data was - what percentage of the accounts reviewed were e-commerce? I’d love to see how the data shakes out across these categories for e-commerce and lead generation.
But even without that split being shown, seeing that accounts really do need 50+ conversions is validating! As someone who often works on accounts with low (fewer than 50 per month) conversions, I have long believed that those conversion levels were a hinderance and seeing it confirmed in a large data set is helpful.
It is also nice to see that manual bidding does have a place in these automated times! The data about using conversion values and not just bidding toward conversion generally was also very interesting. I think we can sum up where things are continuing to go by saying Google wants more information from advertisers (conversion values being one data point) so that it can add that to their system data to try to increase campaign performance.
Also nice to see that adjusting your budgets with some of the auto or smart strategies can cause volatility. Again, many of us see things in the accounts we work on and hear about it from friends and their accounts, but seeing a large data set reporting that it is widespread is also very helpful in setting expectations - both ours and for our clients.”
Julie Friedman Bacchini, Founder of PPC Chat/President and Founder of Neptune Moon
“One of my first takeaways is that max clicks performs at a similar if not better level than max conversion. As was noted, maximize clicks is really an underutilized bidding strategy as users try to jump straight into smart bidding using maximize conversions. I’ve found that using maximize clicks with appropriate bid adjustments can actually be a winning strategy for some accounts.
I wasn’t surprised to see that the key component in bidding strategies continues to be conversions and conversion volume, however. This remains one of the biggest challenges for smaller advertisers and even manual CPC or auto bidding doesn’t entirely overcome the challenge. The importance of micro conversions only continues to grow for marketers who work with lower conversion volumes.
I’ll also admit that this study challenges my view on maximize conversion value as a bidding strategy. I’ve always thought that maximize conversions was a better bidding strategy and have often only used conversion value bidding if I can set a target ROAS with it. This serves as a good reminder to test your assumptions or at least avoid writing strategies off without due consideration!”
Harrison Jack Hepp, Founder of Industrious Marketing LLC
“Some big surprises here at first glance, but things are never simple. As the saying goes in the SEO community: “It depends,” and that holds true here as well. Take, for example, setting up targets and bid caps. The data shows that these strategies aren’t always beneficial. Does this mean we’ll change our advice to clients? Likely not. It may seem surprising until we consider who sets those numbers and based on what data. We’d still argue that in many cases, setting a CPA target while also establishing bid caps and floors is a balanced strategy—assuming the data is reliable.
In essence, the study confirms what we universally know: better data equals better performance. Unfortunately, not everyone understands what “better data” really means or how to achieve it. That’s where the complexity comes in, especially with increased focus on privacy. We’ve already been developing strategies to improve the data quality and the study confirms the need. Strategies such as server-side tracking which in testing is showing 18% uplift in main conversion event relative to client-side. This is all data that helps us and the system make informed decisions that manage risks. But again, it only works if the setup and measurement framework are solid from the start. That’s the difference between stunting your account’s performance and letting Google do as Google wants.”
Emina Demiri-Watson, Head of Digital Marketing, Vixen Digital
“This study provides really valuable insights into Google Ads bidding strategies. One surprising finding was the high usage of ‘Maximize Conversions’, despite its relatively low ROAS and high CPA. I understand that the accounts are using multiple bid strategies and the bigger picture is important but I found this interesting non-the less. As a proponent of Maximize Clicks, I’m pleased to see its performance validated. This bid strategy is particularly suitable for smaller businesses or those seeking a less hands-on approach. I recommend max clicks for alot of my b to b clients when there isn’t much competition and when the terms that are searched are straightforward. This data point is helpful to that cause.
The study also highlights the importance of conversion volume for manual bidding. This aligns with the traditional “rule of 100s,” where bids were adjusted based on performance metrics (100 clicks or more with no conversions lower the bid, or if a keyword spends $100 or more with no conversions lower the bid). While this is an old school way of doing manual bidding, we still relied on data to make the decision before smart bidding. Seeing this data shows that 15 years ago we weren’t as far from the mechanics as we thought.”
Sarah Stemen, Founder of Sarah Stemen LLC
“I always enjoy it when I get my hands on Google Ads studies that look at big data sets.This one about bid strategies provided great insights. Among the things I found confirmed from my own analysis are the importance of conversion volume as the basis of any bid strategy and that maximize clicks still has its place. It can perform the same or even better in certain scenarios.
What surprised me, as a proponent of bid floors and bid caps, was the section about bid caps not having a consistent impact on performance. Guess that goes to show that, as the saying goes, it depends.
I was pleasantly surprised by manual CPC and the way it performs, but only when you actively manage the bids - but this always used to be the case and us “old schoolers” are used to it being that way.”
Boris Beceric, Founder and Coach, BorisBeceric.com
“I’m pleased to see that, as of today, there is still no universally superior bidding strategy; performance varies based on execution, conversion volume, and account specifics. When you have 50+ conversions, Smart Bidding is often the best approach, and this aligns with my observations.
A key takeaway for me is the quality of data we provide to Google. Different bidding strategies require different data inputs. It’s crucial to include micro-conversions when they are relevant, and the bid strategy must align with this data. When aiming to drive high-value deals, both the data quality and campaign setup are critical.”
Andrea Cruz, Sr Director, Client Partner Tinuiti
Final Takeaways
Bidding strategies should be evaluated based on the goals for the campaign and resources available. There is no concrete answer on which bidding type (Smart, Manual, or Auto) is better, however there are signals advertisers can follow for the best one for their campaign.
Just because you’re using Smart or Auto bidding doesn’t mean you lack control. If you’re interested in layering automation into your workflow and getting the most out of your budget, Optmyzr has several tools to help you on the path to profit and victory.
If you’re not an Optmyzr customer already, you can sign up for a full functionality trial here.
Great ad copy is critical for Google Ads success. However, it can be tough to understand which rules of engagement work best in today’s PPC landscape.
While there are many perspectives on the best way to optimize ads (and each method has its own place), few are backed by statistically significant data.
At Optmyzr, we have access to that data, so we asked our analysts to look for trends in ad optimization strategies that drive meaningful performance improvements.
We believe it’s important to share this data—not to amplify or discourage any specific strategy, but to inform you about what each creative choice can mean for your account. Ultimately there is no right or wrong answer, just higher or lower probability for success.
Let’s take a look at the data so that you can better contextualize which ad optimizations might yield the best ROI for your campaigns.
Methodology: Data Framework and Key Questions
Keep in mind the context below as you review our study and takeaways.
About the data:
We reviewed over 22K accounts that had been running at least 90 days with a monthly spend of at least $1500.
We reviewed over one million ads across responsive search ads (RSAs), expanded text ads (ETAs), and Demand Gen. However, API limitations prevented us from pulling asset-level data for Performance Max campaigns.
For monetary stats, we converted currencies to USD and used those to find the average CPAs and CPCs.
Here are the questions we aimed to answer:
Is there a correlation between Ad Strength and performance?
How does pinning impact performance?
Do ads written in title case or sentence case perform better?
How does the length of the creative (character count) affect performance?
Do ETA tactics translate to RSAs and Demand Gen ads?
When evaluating our results, it’s important to remember that Optmyzr customers (the data set) represent advanced marketers. As such, there may be a selection bias that could result in more data on successful strategies. It’s possible that results could vary when evaluating a wider advertiser pool with a more varied range of experience.
Ad Creative Choices Data & Analysis
In the sections below, we’ve included raw figures, observations, and takeaways to help you better understand the degree to which various ad optimizations influence performance.
Is there a correlation between Ad Strength and performance?
While Google has made it very clear that Ad Strength is not a ranking factor and meant to be a helpful guide, practitioners tend to have mixed to negative sentiment towards it because it gets conflicting attention from Google and doesn’t seem to be useful in managing creative.
“A higher Ad Strength doesn’t mean a better CTR or a better conversion rate or a better Quality Score. If you’re new to advertising or don’t know what’s going to work, consider this a piece of advice.
But if you’re an experienced advertiser, go ahead and do what you do best. Create the ad that resonates well with your target audience and keep the focus on performance. Don’t just be blinded by the Ad Strength.”
Does the data back him up? Below (and for all the tables in this study), we’ve listed the rows of data in order of descending performance (i.e., the first row is the highest-performing group, while the last row is the lowest-performing):
Responsive Search Ads (RSAs):
Demand Gen Ads:
Observations:
RSAs with an ‘average’ Ad Strength have the best CPA, conversion rate, and ROAS.
Other than ROAS, Demand Gen ads with an ‘average’ Ad Strength performed the best.
There is no meaningful difference in CTR for ads with different Ad Strength labels, which indicates that Ad Strength either doesn’t factor it in, or likely could never be a ranking factor. This is of note because Quality Score (which is a factor in the auction/Ad Rank) does have a clear relationship with CTR. We include this point because many were suspicious of Google using Ad Strength as a ranking factor.
For RSAs, ROAS appears to decline sharply when going from ‘average’ to ‘good’ Ad Strength. While the transition from ‘good’ to ‘excellent’ shows a slight increase, it doesn’t come close to the disparity between ‘poor’ or ‘average’. This may be influenced by the ‘human’ factor (the majority of advertisers favor max conversions and simple conversion values, according to our bidding strategy study [10,635 use Max Conversions vs 7916 Max Conversion Value]).
Demand Gen’s metrics make a stronger case for paying attention to Ad Strength due to clear ROAS win in the ‘good’ category, however the decline associated with ‘excellent’ Ad Strength still makes it a dubious optimization guide at best.
The conversion rates for Demand Gen ads are very similar to those of RSAs. This is surprising, considering Demand Gen ads drive awareness whereas RSAs are traditionally focus on driving transactions.
Takeaways:
There is no clear correlation between ad performance and Ad Strength. Ad Strength is not a metric to sweat over.
The majority of ads have an Ad Strength label of ‘poor’ or ‘average’, but perform well on typical advertising KPIs.
Ads with ad strength labels of ‘good’ or ‘excellent’ have mixed performance on typical advertising KPIs.
How does pinning impact performance?
Pinning refers to designating an asset to a particular position in the ad (Headline 1, Headline 2, or Headline 3). Pinning came about with the rise of Responsive Search Ads.
Some preach pinning everything to force ETAs (meaning there would only be three headlines and each would be pinned to their respective spot), while others prefer to abstain from pinning. Those who abstain from pinning lean into RSA’s built in testing. Check out the “Experts React” section for specific reasons why some pin or don’t.
Here’s the data on pinning (including the performance from ETAs for easy comparison—note that ETAs are a retired ad type and cannot be edited):
RSAs:
ETAs:
(We’ll revisit this table when we discuss creative length.)
Observations:
Some pinning continues to be the winning strategy based on CPA (though no pinning is a close second), ROAS, and CPC. Conversion rates suffer when you pin.
Ads where every element is pinned have the best performance for the relevance metric: CTR.
Ads with some or no elements pinned have the best performance for conversion or cost-based metrics, like CPA, ROAS, CPC, and conversion rate.
While CTR is technically a win for pinning, the CTRs are very close, so it’s hard to say pinning is truly responsible.
In most cases, RSAs outperform ETAs (even in ads with all pinned assets). However ETAs with 31+ characters (indicating DKI/ad customizer usage) performed so well that it comes across as outlier data.
Takeaways:
Advertisers who attempt to recapture the ETAs days are setting themselves up for worse conversion-based performance.
Pinning some assets has a positive impact on ad performance, but it’s essentially flat compared to pinning no assets (ROAS is the only exception). As such, pinning should be a creative/brand choice—not a concrete Google Ads tactic.
Most advertisers would benefit from fully migrating to RSAs (which allow for pinning).
Do ads written in title case or sentence case perform better?
The ‘title case vs. sentence case’ debate is probably one of the firecest debates, so we were curious how this stylistic choice impacted ad performance.
For your reference, here’s a text example with each respective formatting:
Title case:This Is a Title Case Sentence
Sentence case: This is a sentence case sentence
We’ve grouped the accounts based on the percentage of an account’s ad text elements that use title case. So for example, accounts in the row marked ‘0%’ use no title casing at all. 0% should be understood as pure sentence case structure, while 75-100% should be understood as pure title case.
RSAs:
ETAs:
Demand Gen:
Observations:
The biggest observation is the number of advertisers who mix title and sentence case in the same ads and accounts. This runs counter to the historical norm that advertisers tend to pick one and stick with it.
ROAS seems to favor sentence case, but most advertisers tend to use title case.
There is no hard-and-fast rule for all ad types. RSAs and Demand Gen ads appear to do better with sentence case, while ETAs seem to do better with title case.
Takeaways:
As RSA and Demand Gen ads using sentence case performed best on all primary advertising KPIs, we recommend all advertisers include ads with sentence case in their testing.
One possible reason why ads using sentence case perform well is that they are the same format typically found in organic results, which are usually perceived as higher quality by users.
Do not turn off ETAs that perform well, as they have the potential to outperform RSAs (though most won’t) and you won’t be able to re-enable them again later.
Title case seems to be a habit from ETAs, but in most cases, advertisers do better with sentence case.
How does the length of the creative (i.e., character count) affect performance?
Ad copy is a kind of haiku—you need to convey clear and enticing meaning in very few characters. Yet there’s more nuance to consider: is bigger better?
(Example SERP with three RSAs—each with some creative cut off or moved to a different spot.)
Google has made a habit of truncating creative for years, and it’s no surprise that headline creative gets more viewership and impacts performance to a larger degree than the description. However, since underperforming headlines can appear in descriptions (instead of being in position #2), there’s an even greater pressure to get the balance right.
Headlines appear to benefit from concision, while descriptions appear to benefit from some length (but not too long).
In most cases, DKI/ad customizers don’t dramatically improve or hurt performance. We should assume that all ads in a “+” category are using DKI or customizers as that’s the only way they’d be able to exceed the character count.
RSA and ETA performance trends do not line up perfectly, and those trying to apply ETA tactics to RSAs see declines in almost all metrics (potentially due to how Google combines lines of ad text to render long headlines).
CPC fluctuation implies that asset length isn’t as important as other factors, like the Quality Score and Ad Rank of the ads. If there was a clear correlation, one could infer Google’s character count preferences.
Takeaways:
The historical trend of longer ads being better isn’t playing out in today’s ad types. Quality over quantity seems to be the path to better CTR, conversion rates, and ROAS. Focus on including a strong and compelling message in your ad, rather than attempting to max out the character count.
Ad Optimizations That Boost Performance
Now that we’ve reviewed the data, let’s talk about the tactics you should adopt and the ones that no longer make sense.
For me, the biggest insight related to our findings about mixing sentence and title case: I didn’t expect the CTRs and conversion rates would be so similar. While sentence case ‘won’ for RSAs, performance was close. As such, only test sentence case in ads that are underperforming (as opposed to changing existing successful ads to sentence case).
Another big takeaway is that pinning should not be done for complete control. Instead, marketers should focus on securing creative in intended spots (i.e., not having a headline drop to the description). Leave some room for Google to decide where to place the creative.
Regarding Ad Strength as an indicator, seeing as how it does not correlate with performance, it doesn’t make sense to build Ad Strength into audits or sales tools. However, it is a useful filter to find ads whose creative may not be high enough quality to generate a meaningful number of impressions. We did see a strong correlation between shorter and brand-agnostic creative and higher ad strength.
Experts React
“A couple things stood out to me right away. The first is how little the CTR was impacted across the variety of ad types and strategies. Most of the changes studied saw no more than a 0.5-1% change across the CTR. Secondly, it appears that many marketers, myself included, haven’t completely adjusted to RSAs despite them being the primary ad type for over a year now. RSAs perform in a completely different way than ETAs regardless of how you format them. Rather than trying to replicate ETAs or using old best practices, advertisers need to lean into RSAs and determine how to make them work best for their accounts.
I think all of this highlights the case that many of us who have been practicing Google Ads for a long time need to revisit our habits. Google Ads continues to change at an accelerating pace and we need to lean into making it work for us now and not hold onto old tactics.”
Harrison Jack Hepp, Google Ads Consultant, Industrious Marketing
“As the “Chief Strategist” of a digital marketing agency, I’ve always prioritized strategies that maximize performance, often relying on data-driven decisions over Google’s recommendations. This study reinforces that approach, especially regarding Ad Strength and pinning. The data confirms that Ad Strength doesn’t reliably predict ad performance, so experienced advertisers should focus on crafting ads that resonate with their audience rather than chasing high Ad Strength ratings. While Google offers pinning as a tool, the findings suggest that allowing some flexibility for Google’s AI can yield better results than over-pinning and that using pinning selectively is not as harmful as I may have previously thought. However, the most surprising insight is the impact of creative length. Contrary to my belief in maximizing ad real estate (which I also push when it comes to Meta Data on the SEO side of things), the data suggests that concise, impactful messaging can outperform longer ads. This challenges the notion that more is always better and highlights the importance of quality over quantity in ad copy. Based on this study, I will push our teams to test creative length more rigorously.”
Danny Gavin, Chief Strategist and Founder, Optidge
“This study highlights the importance of humans using Google Ads. As experts, we analyze Google’s documentation, PR statements, and real-world advertiser performance to offer guidance.
While ‘Excellent’ ads have higher click-through rates (CTRs), this study confirms that ad strength can mislead advertisers into prioritizing clicks over conversions. ‘Average’ ads actually have higher return on ad spend (ROAS), suggesting that aligning ads closely with keywords (to get an ‘Excellent’) can lead to more clicks but not necessarily more sales.
I was also intrigued by the impact of pinning. Historically, I’ve avoided using pinning and relied on RSA automation. This data demonstrates that human intervention and knowledge can produce better results. In light of this, I’ll consider incorporating pinning into my strategies.
Lastly, as a proponent of title case, the study’s findings on title case versus sentence case were surprising. While many ad experts stick to one format, the study suggests that staying updated with case studies is crucial. In today’s environment, where individual accounts may lack sufficient volume for testing, tools like Optmyzr are more essential for providing data-driven insights and challenging the status quo.” -
Sarah Stemen, Owner and Coach, Sarah Stemen, LLC
“This is a good reminder of how dynamic best practices really are. Just a few years ago, filling up all the character space in an ad was a great way to give your ad more real estate. With RSAs, using every available character can actually backfire, since it can keep H3 from serving.
Writing Google Ads can be really overwhelming. Knowing what correlates with better performance and what doesn’t (ahem…Ad Strength) offers valuable benchmarks. These insights allow you to move past internal tests for things like capitalization and pinning, and instead focus on the qualitative aspect—developing stronger, more substantive messaging that attracts buyers.”
Amy Hebdon, Founder, Paid Search Magic
“This study is FASCINATING!
The things that stood out to me were pinning, sentence case and length of assets.
First, pinning - I am happy to see that pinning is not completely penalized. There are very legitimate reasons an advertiser might want or need to pin assets. Could be compliance or could be that their brand standard demand certain things must appear in advertising. I am glad that is not an automatic performance killer. It makes sense that selective pinning does well and full pinning does less well.
The title versus sentence case data was also really interesting! For those of us who have been doing this for a long time, title case is really ingrained in our heads for headlines. It almost feels blasphemous to use sentence case for headline assets. But the data, I think, is starting to show us that Google is viewing ad components/assets differently.
Which leads me to my thoughts on the length of assets. Again, those practitioners who have been doing Google Ads for 10+ years, our mantra has always been use all the characters! We strove to have long descriptions and use all those title characters pretty much every time. But the data is showing us that the system prefers shorter (not maxed out) assets. And I can’t help but wonder if this is hinting on Google Ads not distinguishing so much between title and description assets in the future. They have already started by sometime using titles in description areas. I think this is where it is eventually going.
All that to say, we probably need to adjust our thinking about today’s ad assets and test different lengths and case structures if you don’t have variety in your current ads. Look forward to more studies illuminating other aspects of Google Ads!”
Julie Friedman Bacchini, Founder of PPC Chat/President and Founder of Neptune Moon
“What I found most compelling from Optmyzr’s latest study is that ads resembling organic content outperform those that employ typical best practices for Responsive Search Ads. For example, Google’s own research from a few years ago found that Title Case outperforms Sentence case for RSA headlines and descriptions, but Optmyzr’s new study shows that the more “natural” Sentence case text is associated with better ROAS, CPA and CTR in 2024.
Similarly, practitioners have typically tried to maximize real estate by using all available characters, but this study shows that shorter headlines and descriptions generally have better CPA and CTR than longer ones.
I look forward to testing these new findings with my clients. As organic-feeling social media ads have taken over platforms like TikTok and Meta, it’s interesting to see a potentially similar shift coming to Google Ads.”
I’ve long said that focusing on ad strength too much is detrimental for performance and I’m glad to have this confirmed.
What’s really important is understanding the restrictions you have in your account (available impressions per ad group) and tailoring your RSA to that, plus the ability to communicate the message effectively and speak to the user in a way that resonates with them.
Best practices are but that - the average of things that typically work."
Boris Beceric, Founder and Coach, BorisBeceric.com
“Referring back to Fred’s advice, the single most important tip is to write ad copy that addresses your user’s or buyer’s concerns—it’s basic marketing 101. That said, the more you can customize each input, the better the performance will be. With increased AI search integration, expect Google to improve its ability to create a personalized search experience based on a multitude of signals.
Additionally, don’t forget the basics: dynamic countdown clocks for promotions, ad customizers that mention names of stores or service locations, dynamic keyword insertion (DKI), and using ad-level UTM parameters to trigger landing page content aligned with the keyword or ad theme will all contribute to better CTR and CVR.”
Andrea Cruz, Sr Director, Client Partner at Tiniuti
Final Takeaways
Ad Strength is not a major metric, nor has it proven to be a reliable predictor of ad copy performance. The most useful signals seem to be the formatting of the ad (title vs. sentence case), as well as length of the copy. Don’t fall into old creative habits—honor the new rules of engagement and, if you need help managing profitable ad tests, Optmyzr has a free trial with your name on it.
During GML 2024, Google shared a really interesting stat: raising your OptiScore 10 points leads to a 15% conversion rate improvement.
This stat raised eyebrows for a few reasons:
Advertisers can raise OptiScore by dismissing Google’s recommendations, which can be considered a loophole in the system.
Maintaining a minimum OptiScore is required for partner status, which doesn’t always align with business and marketing goals.
OptiScore tends to be conflated with account recommendations, which seem like a sales tool.
For your reference, here’s Google’s OptiScore support documentation:
Optimization score is an estimate of how well your Google Ads account is set to perform. Scores run from 0-100%, with 100% meaning that your account can perform at its full potential.
Along with the score, you’ll see a list of recommendations that can help you optimize each campaign. Each recommendation shows how much your optimization score will be impacted (in percentages) when you apply that recommendation.
Note: Optimization score is available at the Campaign, Account, and Manager Account levels. Optimization score is shown for active Search, Display, Video Action, App, Performance Max, Demand Gen, and Shopping campaigns only.”
— Google support documentation
With that in mind, we decided to explore the following questions:
Is there a performance difference in accounts with 70+ OptiScores (compared to sub-70)?
Are most advertisers achieving high OptiScores by accepting Google’s recommendations (and do they see better results than advertisers who reject them)?
Does spend play a role in OptiScore?
For this study, we looked at 17,380 Google Ads accounts that met the following criteria:
Running at least 90 days
Spending at least $500 per month
Maximum spend $1M per month
Global accounts that could be in ecommerce or lead gen.
The Data
We’ll review each major question in detail, but here’s a quick summary of the findings:
32% of accounts have sub-70 OptiScores.
19% of accounts achieved an Optiscore of 90+ without accepting Google recommendations.
5.5% (less than 1000 accounts) accepted Google recommendations, however the best performance belongs to the 333 accounts that accepted Google suggestions and have a 90-100 OptiScore.
Spend doesn’t really impact OptiScore—there’s too much fluctuation in the spends to point to any correlation or causation.
There is a correlation between higher OptiScores (80+) and improved CPA, conversion rate (though sub-70 did ‘win’ this category), and ROAS. There is no correlation between CPC and CTR.
Q1: Is there any performance difference between accounts with high/low OptiScores?
A big reason we wanted to explore the difference in OptiScore brackets is to see if it can be used as a health indicator in accounts. Here is the raw data:
As you can see, there is a clear correlation between high OptiScores and strong performance on all metrics (save for CTR). However, there are a few caveats:
Sub-70 OptiScore accounts won on conversion rate and nearly won on CTR.
ROAS is pretty flat between OptiScores of 70–90.
CPCs fluctuate (although lower OptiScores do correlate with higher CPCs).
Accounts in the 90-100 OptiScore range:
Beat accounts with a sub-70 score on ROAS by 186%.
Had the cheapest overall CPAs (despite not having the cheapest CPCs or best conversion rates).
Had the lowest CTR, which speaks to the value of PMax and visual content being part of the marketing mix.
Regarding Google’s claim on conversion rates being tied to OptiScore improvements:
This holds true for those going from 70 to a higher tier.
This does not hold true for advertisers going from sub-70 to 70+.
CPA and ROAS still win the day as you increase your OptiScore.
Q2: Are most advertisers achieving high OptiScores by accepting Google’s recommendations?
There’s strong skepticism around Google’s OptiScore metric. While our data shows there is a strong performance gain when an account achieves a better OptiScore, there remains the question of how the score is achieved. So ahead of this study, we ran an anecdotal poll and found that the majority of advertisers reject recommendations to raise their score (or outright ignore the metric).
Here’s the raw data:
While the vast majority of accounts (95%) do not accept Google suggestions, it’s worth acknowledging that the accounts with the best performance did accept Google recommendations and have an OptiScore of 90+. The data suggests that advertisers may have raised their scores by rejecting suggestions, however that didn’t always lead to the best results.
A few notes:
The suggestions varied across accounts, however the most common accepted suggestions revolved around hygiene fixes (e.g., conflicting negatives, missing assets, other clean up alerts).
Accounts that rejected suggestions may have still done the suggested action, but at a different time.
The main takeaway here is that you shouldn’t dismiss Google suggestions out of hand. An additional takeaway is that advertisers who are active in their accounts tend to see higher OptiScores, which does seem to correlate with improved performance.
Q3: Does ad spend play a role In OptiScore?
There has been a bit of skepticism around Google and how much spend plays a role in ‘favorable treatment’. While this wasn’t directly asked by the community, we thought it would be interesting to see whether spend impacts OptiScore. Here’s the raw data:
Spend is flat between the OptiScore brackets, and there’s no obvious correlation between spend levels and OptiScore.
While one could argue that jumping from sub-70 to 70–80 does add cost, the cost fades away in the upper brackets. This bracket had the best CTR, so it’s possible the increased spend is tied to advertisers doing a great job writing compelling ads that couldn’t capture conversions (either due to user experience or privacy).
Strategies for Leveraging OptiScore
Now that we’ve explored the data…what do we do with it? Should OptiScore be the new quality score?
No, but we also shouldn’t dismiss it. While Optiscore will not impact how you enter the auction, the data is undeniable that it can serve as a useful health indicator of where to work in accounts. While sub-70 accounts can see success, the strongest performance is in the 90+ bracket.
Don’t make it a goal to raise your OptiScore, which can be done through rejecting suggestions. Instead, focus on improving your account (with guidance from OptiScore). As Ginny Marvin, Google’s ads liaison shared:
The recommendations that surface with OptiScore refresh in real time and are based on your performance history and both inferred and expressed campaign goals (e.g., your bid strategy) as well as broader trends and market data. I tend to see two misperceptions about OptiDcore that keep advertisers from utilizing it effectively.
The first misperception is that OptiScore has a direct impact on performance. As with other diagnostic tools in Google Ads, such as Ad Strength and Quality score, OptiScore has no influence on the auction. On the other end of the spectrum is the second misperception that it’s simply a vanity metric that doesn’t reflect meaningful insights. OptiScore reflects how well your account and active campaigns are set up to perform.
While not all recommendations may be relevant (you know your business best), we continue to see that, on average, higher OptiScores correlate to better advertiser outcomes. Understanding what your OptiScore reflects, and reviewing the recommendations with an eye toward your goals, can help you surface new opportunities and prioritize where to focus your optimization efforts.
If you’re an Optmyzr customer, you can find OptiScore highlighted in Audits. Now that we know there is a positive correlation between OptiScore and account performance, we will begin looking at expanding its utility in Optmyzr’s suite of tools.
If you’re not an Optmyzr customer, the best way to leverage OptiScore is to use it as a focusing tool, as well as a weighting system to prioritize which optimizations/tests to perform.
Thoughts From PPC Experts
We asked PPC experts to weigh in on the data with their honest takes. The responses were mixed.
Pleasantly Surprised
I was pleasantly surprised to see a correlation between higher OptiScore and better campaign results (lower CPA/higher ROAS). I was more surprised to see even better results for those that accept rather than dismiss Google’s recommendations.
None of us, not even Google, would conclude that higher OptiScore is the cause of better results - though we all owe Googlers an apology for how much we’ve mocked their OptiScore stats over the years! I think the true cause for both higher scores and better results is a) actively managing and ’looking after’ an account, and b) being open to considering new ideas and opportunities.
Most experts are quite critical of Google’s recommendations, especially when it comes to OptiScore (myself included). However, I am also willing to eat my words when proven wrong. I was quite surprised by the clear correlation between OptiScore & ROAS, CPA & CVR (and yes, I did my own analysis).
I’ve always maintained that not all recommendations are useless and that you should judge them by their usefulness for your accounts. I guess now it’s time to go back to my accounts and see what else can be implemented.
The results were very interesting to me, as a member of camp ‘reject most suggestions.’ I imagine that the level of expertise of the account manager plays a role, sometimes what Google suggests is an action I was already going to take. I’d recommend that nobody blindly dismisses or accepts recommendations and instead considers them carefully, as you are the only one with context. I also believe ecommerce clients should pay particular attention to the ROAS results of this study!
Google isn’t inside the accounts but I know I’ll be more carefully considering their suggestions going forward and I believe the season of ‘blindly dismiss’ (if that’s been your MO) being the default has come to an end.
— Amalia Fowler, Owner, Good AF Consulting
I worked at Google on the Google Optimization project and have seen firsthand how some recommendations from the system can be highly relevant. For instance, addressing conflicting keywords, fixing conversion tracking issues, and implementing enhanced conversions are all critical for improving campaign performance. Additionally, adjusting ROAS targets or increasing target CPA during peak auction times can also bring better results.
This data reassures me that recommendations correlate positively with performance. However, I still believe that certain areas, such as adding new keywords or changing match types to broad match, require further improvement. Overall, the study’s outcomes are pleasantly surprising and validate the use of some of Google’s optimization suggestions.
— Thomas Eccel, Senior Performance Marketing Manager, Jung von Matt Impact
Skeptical or Indifferent
The Optmyzr study highlights benefits to Google’s OptiScore and suggestions, (which is seen especially in the 90–100 range), with a better CPA and ROAS compared to the lower OptiScore brackets.
This study supports what I tend to believe and it is great to have the data to prove that some recommendations directly found in the Google Ads interface are beneficial to account performance.
All that said, the Google interface and Google reps independent of the study push the score. Google pushing the score gives me pause, even when independent study data supports that OptiScore’s net positive on performance.
— Sarah Stemen, Business Owner, Sarah Stemen, LLC
While I don’t pay much attention to OptiScore or give much value to recommendations, we do review recommendations on an ongoing basis because they can surface some things we may not have seen as easily.
— Menachem Ani, Founder, JXT Group
I usually reject most of the recommendations and ignore OptiScore, unless we are about to lose our Google Partner Badge. After checking all of our accounts, I would like to add that nowadays the recommendations have increased in number and in variety than several years ago. Search is much more visual, and for instance, accepting the recommendation to add more images or enable dynamic images is rather beneficial with less risk for harm. Improving ads and assets, in general, makes sense too.
Our smallest accounts suffer most in terms of OptiScore because the system does not like limited budgets—for some of them, a budget increase might improve the score by 13%. For lead gen and gambling accounts (which underlie strict regulations), PMax would bring a score improvement of over 10%, which again does not make sense business-wise. Switching accounts optimizing on CAC to Target-ROAS for the sake of several OptiScore points already goes in the direction of business suicide.
— Georgi Zayakov, Senior Consultant Digital Advertising, Hutter Consult AG
Summary & Final Takeaways
OptiScore is not and should never be a KPI. It is a useful tool to focus work, though it should not be the only tool you use. Make sure you balance all recommendations from Google with the actions and optimizations that best serve your campaigns and business.
If you would like to have a third party to sanity check recommendations and strategies, check out Optmzyr’s PPC Management suite for Google and beyond.
When Google announced they would begin pausing low-activity entities (first ad groups, then keywords), the news was met with mixed response. Some felt it was an overreach and that practitioners should decide if keywords should be paused. Others felt that if an entity hadn’t done anything in 13 months (the minimum timeframe for it to be eligible for auto-pausing), it was time to move on.
There are a few theories around paused entities that are worth digging into before we dive into the data to help unpack the tension. While there is no official documentation supporting these theories, we respect that marketers have experienced anecdotal data to support them:
Some advertisers believe that leaving keywords with no performance in accounts helps other keywords do better. This is not supported by official documentation. Google actually says the opposite: that you might be creating duplicates.
There are other advertisers who have seen keywords go for months without any traction, and then all of a sudden pick up. Advertisers who have seen this happen, and voice frustration that their keywords no longer get unlimited ramp up time are sharing valid fears and frustrations. We haven’t seen this in a significant way, but that doesn’t diminish that some brands may experience this.
We do not hold any firm opinions on what the data would hold, however we do want to investigate the following questions:
How many marketers will be impacted and to what degree (number of keywords, performance, etc.)?
What kind of accounts do most marketers run today, and does the mass pausing represent a shift for most marketers account management styles?
Is there risk associated with Google’s mass pausing of keywords?
This is part one of our two part study. The second part will come out towards the end of the summer when we check in on the accounts in this study.
A bit about the criteria:
Accounts had to have at least 13 months of performance.
Accounts were split into three categories: Small (400 or fewer keywords), Medium (400-3000 keywords), and Large (3000+) keywords.
Accounts were further split into percentage of zero-volume keywords (0-25%, 26-50%, 51-75%, 76%+)
9430 accounts are included in our study
We included accounts from all markets
Because we did not bake in any consideration for the type of account (e-commerce/lead generation, Performance Max, age of account), we are not sharing the specific metrics associated with each group. That said, we looked at CPA, ROAS, CTR, CPC, and conversion rates to get some of those directional cues on performance.
The Data
How Many Accounts Have Significant Amounts (50%+) Of Low Volume Keywords:
Total: 7888 (84% of accounts)
Small: 3,020 (38%) accounts of the 4,300 small accounts.
Medium: 3378 (43%) accounts of the 3623 medium accounts
Large: 1490 (19%) accounts of the 1507 accounts
We compared the performance of accounts with a high percentage of low volume keywords with accounts with a low percentage of low volume keywords.
We found no meaningful difference in performance, which is why we believe most of these accounts won’t be negatively impacted. This is especially true given that the 378 accounts with 0-25% have some of the best performance of any account type (all metrics save for ROAS). When the change happens, accounts will likely mirror this account type (going from large to medium/small or medium to small).
There are a few outliers (145 accounts with very strong performance) in the large account category that may see a decrease in performance, due to how many keywords would get paused. Given that they were in the 50-75% tier, the pausing will represent a major shift.
For transparency sake, here’s the breakdown of how many accounts fell into each category:
Number of KWs
Category
No. of Accounts
Low
0-25% 0-impression kw
378
Low
26-50% 0-impression kw
902
Low
51-75% 0-impression kw
1341
Low
75-100% 0-impression kw
1679
Medium
0-25% 0-impression kw
39
Medium
26-50% 0-impression kw
206
Medium
51-75% 0-impression kw
868
Medium
75-100% 0-impression kw
2510
High
0-25% 0-impression kw
2
High
26-50% 0-impression kw
15
High
51-75% 0-impression kw
145
High
75-100% 0-impression kw
1345
How Many Accounts Are Small/Medium/Big, And Is There Any Meaningful Performance Difference Between These Accounts?
Small: 4300 total accounts: Won on CPC, CPA, and ROAS
Medium: 3623 total accounts: No Winners
Large: 1507 total accounts: Won on Conversion Rate and CTR
While larger accounts did have some wins, small accounts won more categories and after the keyword pause, it’s reasonable to expect many “large” accounts to become “small”. Since they had comparable performance, most advertisers should see limited change to their results. However there may be outliers that perform better or worse once the pause happens.
Are There Any Accounts At Risk For Performance Loss
Low/No Risk: 4904
High Risk: 145
Unknown Risk:4381
While there are some accounts that have reason to be concerned (they had some of the best performance of the entire cohort of ad accounts), they also represent such a small percentage of the overall sample size.
Smaller accounts (under 400 keywords) had the best ROAS, CPAs, and CPCs. This was true regardless of whether they had a lot of low volume keywords. Most accounts should fall into this category after the initial pause.
ROAS was strongest in accounts with higher percentages of low volume keywords. However it’s unclear whether this is a correlation or causation. We’ll have more insight when we run the numbers again post the pause.
Medium accounts (400-3000 keywords) had the worst performance of any cohort, and represented the second largest cohort of advertisers. These brands should see no change or potentially an improvement to their ad accounts.
Large accounts (3000+) seemed to have the strongest overall performance, however they also benefited from being older accounts. Note, this is an educated guess based on SKAG structure being an older account type from the pre-close variant era.
As we mentioned in the beginning, we acknowledge that there’s some concern around performance loss, but there is no concrete data to say one way or the other.
What Should You Do Regarding The Big Pause
We were surprised at how many accounts would be impacted by this update, and were relieved that there aren’t any major risk signs in the forecasting data.
If you’re an Optmyzr customer, you can use Rule Engine to bubble up zero impression keywords in your account so you can review them before they get to the 13 month threshold.
Typically when a keyword is getting zero impressions, it means one of these things:
The bid isn’t high enough.
The keyword is in the wrong ad group/campaign.
The Bid Isn’t High Enough
No keyword will be able to overcome a bidding problem. If a keyword’s auction price is $5-$10 and you’re bidding $2.50, there’s no way you’ll be able to rank for any meaningful queries.
This is where impression share lost to rank comes in. Impression share lost to rank tells you what percentage of available impressions you could be getting (but aren’t) due to low ad rank. While it’s reasonable to have some impression share lost to rank, anything over 10% is a sign that your structure and bidding are not aligned.
Additionally, you should consider your bidding strategy and any bid caps. If a budget is too low to meet a given conversion goal (volume or value), you will force yourself to underbid (even if you don’t provide a bid cap/floor).
Make sure that your budget can support at least 10 clicks per day (especially for non-branded search). If you don’t budget for at least 10 clicks, you’re banking on a better than 10% conversion rate. Search budgets should be able to deliver at least one conversion per day on paper, otherwise your budget is going to be wasted due to under budgeting.
Google is not going to be able to allocate budget in a meaningful way. Either it will double your daily spend to try and get you a few useful clicks knows it - which is why you might be forced to under bid and miss out on valuable impressions, clicks, and conversions.
The Keyword Is In The Wrong Ad Group/Campaign
Nothing is more tragic than a valuable keyword missing out on budget because it didn’t win initial auctions. When you put a campaign on Smart Bidding, you’re asking it to put budget behind entities that will drive conversions or conversion value. If there are too many entities sharing the same budget, it’s very easy for worthy keywords/ad groups to get passed over.
Previous data has shown that exceeding 10 ad groups per campaign can cause budget allocation issues. If your campaign has 15+ ad groups, it’s going to be hard to fuel all your keyword concepts. Consider moving zero impression keywords that aren’t covered by performing keywords to a different campaign. Where possible, pause redundancies (which is what’s happening June 11th).
PPC and Google Ads Experts Weigh In
We were lucky enough to get Friends of Optmyzr to share their perspective on the data. Here are some of their takes:
“The majority benefit from new structure”
The study echoes what I have found in audits, that pausing zero impression keywords likely doesn’t negatively affect performance and in the case of the small accounts I work with, has a negligible or positive impact. The majority of low impression keywords I see would benefit from a new structure if they’re important to the advertiser which is also echoed in the study. I’m excited for part two!
Amalia Fowler, Owner, Good AF Consulting
“Blurs the lines between ad platform and ad partner”
I think this change continues to blur the lines between Google as the advertising platform and Google as an advertising partner, which troubles me. In the former, a platform would not bother itself with something as simple as account organization. Whether to pause or keep keywords live that really have no impact on an account is, at its core, an organizational decision… which should, in my opinion, be left to the advertiser or advertising partner.
The Optmyzr study demonstrates exactly this: while many accounts are impacted, it really has no impact on the accounts. Admittedly, one could come away with the conclusion, “what does it matter if Google pauses these keywords automatically? It’s not really a big deal.” They would be right from a practical perspective, there would be no measurable difference in the vast majority of accounts.
However my concern with these types of things is that Google continues to make more changes and policies that blur the lines between platform and ad partner (which is partially responsible for their antitrust lawsuits, in my opinion, since they exercise freedom such as this in platform decisions that a non-monopolist company would not be able to engage in without losing customers).
All that to say, I think, philosophically, Google should leave organizational decisions like this to account managers.
Kirk Williams, Owner, ZATO
“No malicious intent… but how will it make Google more money?”
When I see a product change announcement like this, I always ask myself two things:
1. How does this make Google more money?
2. How can I ensure it makes me/my client more money, too?
Pausing low volume keywords seems innocuous, and I’m glad this study shows that for most advertisers, it will be.
But Google wouldn’t go through all this effort, communication, skepticism, etc. without something to gain. No malicious intent inferred here, just acknowledging that Google is a for-profit business.
So how will this make Google more money? My hypothesis is increased broad match adoption and/or PMax adoption when accounts have fewer keywords in them.
Jyll Saskin Gales, Google Ads Consultant, Learn With Jyll
“Step back from reacting and trust the data”
The Optmyzr study on pausing low-activity keywords is a great example of why data is important. While the initial announcement caused a stir in the industry, these results suggest minimal disruption for most accounts. This had been my initial guess as well.
This study really highlights the importance of stepping back from reaction and trusting data.
Sure, skepticism towards Google’s changes is healthy, but when the data shows potential benefits, like potentially aligning with simpler structures that the algorithm might favor, we as advertisers need to be adaptable.
The study’s finding on smaller accounts performing well also reinforces this idea of efficiency with less complexity. (this wasn’t an explicit finding however).
Sarah Stemen, Owner, Sarah Stemen LLC
Should I Re-Enable Paused Keywords?
Short answer: It depends.
Long answer: Likely not, but here’s an important checklist to run through if you’re considering it!
Is the keyword something I have active because my boss/client told me to?
If Yes: create the keyword in a new campaign focused on those client/boss asks that doesn’t have performance goals attached to it.
If No: test leaving it paused if existing keywords cover it, otherwise consider moving it to a new campaign.
Am I consistently losing more than 50% impression share due to rank?
If Yes: you likely have a budget/structure problem and will need to make some choices around using search to go after that part of your business.
If No: leave paused.
Were there any major events that might have caused performance glitches?
If Yes: re-enable, and consider passing that info into the data center.
If No: leave paused
If you’re not an Optmyzr customer, the best way to check for these paused keywords is the change history. You’ll be able to review the paused keywords and re-enable them. However if they don’t get any impressions after 90 days, they will be re-paused. This is why we suggest thinking critically if the keyword is in the best spot in the account.
If you are an Optmyzr customer, we will echo the earlier recommendation to use the Rule Engine to keep you up to date, as well as the quick insights on the dashboard to check your ratio of low volume keywords.
2023 was a lot. There were big cultural events that shook economic stability, as well as major innovations in ad tech.
One can never be sure how these changes will influence ad accounts. Sometimes they’re negligible, other times they have a big impact (for good or for ill).
We decided to look at the following mechanics and how advertisers can take the lessons from 2023 to future-proof their campaigns moving forward:
Match types: Did Broad Match enhancements in May of 2023 move the needle on its performance?
Auction price volatility: How have auction prices changed and what impact does that have on other key metrics for major verticals?
Performance Max: Are best practices actually best practices and just how much ROI is there in investing extra effort in creative?
We combined all three studies into one massive report because we see these questions as relating to each other. When match types behave the way you think they will (or don’t) that directly influences whether your account structure is going to deliver strong ROI. Volatility in auction prices might make you likely to trust PMax even though there are strong gains and paths to profit.
If you’re just interested in one of these questions, you can skip to that section in the navigation, but without any further ado, let’s dive in!
Match Types: Has Broad Match Evolved Enough & Is Exact Still the Best Path to Efficient Profit?
Before we dive into the data - here’s the TLDR:
While Exact did have more accounts (4000) performing better than Broad (all metrics), the difference closed a lot since our last investigation. This shows big improvements for Broad Match!
Average CPCs being as close as they are feels tied to general market fluctuation than one match type being “better” than the other.
Phrase Match remains statistically insignificant as advertisers own that Exact performs the same job, and Broad Match has a place in today’s PPC landscape.
Criteria for the Study
Must be running for at least 90 days prior to Q4 2023
Minimum spend of $1000 and maximum spend of $10 million per month
No branded campaigns included
Must have both Broad Match and Exact Match in the account
Metrics
ROAS
25.90% of accounts performed better with Broad, median percentage difference is 52.78%
74.10% of accounts performed better with Exact, median percentage difference is 100.59%
CPA
26.16% of accounts performed better with Broad, median percentage difference is 41.11%
73.84% of accounts performed better with Exact, median percentage difference is 97.11%
CTR
18.43% of accounts performed better with Broad, median percentage difference is 24.83%
81.57% of accounts performed better with Exact, median percentage difference is 51.11%
Conversion Rate
37.88% of accounts performed better with Broad, median percentage difference is 35.29%
62.12% of accounts performed better with Exact, median percentage difference is 41.05%
CPC
51.50% of accounts performed better with Broad, median percentage difference is 24.91%
48.50% of accounts performed better with Exact, median percentage difference is 30.22%
Findings and Analysis
Broad may not perform at the same level as Exact, but the performance gap closed quite a bit since we last ran this study. We have a few thoughts on why this may have happened:
Google made major improvements to Broad Match and it shows. Between the multilingual understanding and focus on intent, Broad Match is a much more reasonable data source than it was before.
Auction prices trickle down to ROAS and CPA. While there is no denying Exact had demonstrably better ROAS and CPA, the median performance improvements were better. This might be due to rising CPCs across the board.
PMax Search Themes are a factor here - they will always take a back seat to Exact Match while having the potential to win over Broad and Phrase if the syntax better matches the search theme. Given the wide adoption of PMax and statistically relevant adoption of search themes, broad might have performed even better if budget wasn’t diverted to PMax.
Action Plan
At this point there is no denying the match types have evolved to render syntax-driven structures moot. Whether you lean into Broad Match, DSA, or PMax as your data driver, you’re going to need to account for rules of engagement.
The Case for Keeping Broad in Your Account
Broad Match will show you exactly how various queries matched. While this might feel like an overrated feature, seeing what percentage of your Broad Match traffic would have come to you via phrase/exact can help you prioritize which keywords to keep/change out in your core ad groups.
If you use Broad Match, be sure that you add your other keywords as ad group level Exact Match negatives. This will ensure that your Broad Match keyword is able to do the job you intend for it to do without cannibalizing your proven keyword concepts.
To do this, you can run any of the following strategies:
A Broad Match ad group with one to two Broad Match keywords you’re using to gather data. The other ad groups in the campaigns should exclusively be Phrase or Exact (I’d suggest Exact).
A campaign with one ad group using Broad Match and all the other campaigns exclusively using Exact/Phrase.
Between the two, I’d suggest using the first method as that way Broad and Exact ad groups can help each other average out the deltas in the match types’ metrics. Without the conversions from Exact and the volume from Broad Match, campaigns might struggle to ramp up.
Choosing the right Broad Match keyword champion is the most critical choice. A few considerations:
Does the keyword represent the best “deal” on traffic?
Cheaper keywords won’t win every exploratory auction, but they might help you get discounts on high-value keywords when available.
Don’t ignore quality on the path to the best deal. The keyword still needs to represent your customers.
Keywords have different auction prices in different locations. Be mindful that your champion might need to change depending on geos.
Is the keyword representative of your Exact Match keywords or is it testing completely new ideas?
The benefit to being completely new is that you’re able to test your assumptions on established keyword concepts (i.e. they’re Exact).
Locking in the same root words in a Broad keyword lets you test for variant drift (what percentage of your queries come back as close variants with different root words).
Do your best customers search this way?
Lead gen and ecommerce campaigns need to factor in ROAS. Depriving Google and yourself of revenue data (even if it’s a projection) is asking the algorithm to focus on volume over value.
Honoring how your best customers search (high margin, easy to take care of, etc.) ensures that you’re not only matching keywords, you’re aligning creative.
The core ad metrics to focus on are CPC, conversions, CPA, and CTR-to-conversion rate.
The Case For Using PMax/DSA
PMax represents “black box” marketing to many, but as we’ll go over in the next section, there are a lot of areas for optimization and profit. Choosing to put your Broad Match budget into PMax may serve you better as it inherently comes with channels beyond search.
As younger generations come into their buying power, they are “searching it up” vs Googling it. That means having a presence on YouTube or other meaningful sites can be the difference between having a profitable conversation and losing to your competitor.
The other big checkbox for PMax (or DSA if you truly need just search) is that you won’t be subject to human bias. The keywords you think you’ll need might only cover part of your core customer base. Additionally, human-created keywords (even Broad Match) are subject to low search volume.
Be sure that you’re checking the search term insights to understand what keyword concepts are coming out and which might make sense to include as an Exact search term.
We’ll be going into the data on Search Themes in the PMax section, but it’s worth noting that exactly replicating your search keywords as search themes is likely a mistake. This is because your Exact Match keywords will always win, but phrase and Broad Match can lose to search themes.
Performance Max: What Are Most Advertisers Doing and Are They Right?
Here’s the TLDR on PMax data, which is framed more as questions than organizing by metric gains:
This is not an “easy campaign” type. While only a small percentage of advertisers had campaigns in the red (3.92% of campaigns), advertisers who put in average effort got average results.
There is no right answer on whether to segment your PMax campaigns through asset groups or a separate campaign. Use budget and priority of the product/service as your guiding lights.
We as an industry have a bias for text assets but successful marketers have just as many images and are leveraging video they create.
There is a bias around feed-only campaigns doing better than any other. While they do have a higher median ROAS, they also have the built-in bias of ecommerce having wider adoption of ROAS bidding.
Criteria for the Study
The account needs to be active for at least 90 days prior to the investigation period
Monthly spend needs to be at least $1000 per month and could not exceed $10 million per month
The account needs to have conversion events firing successfully
7100 ad accounts and over 18K campaigns worldwide qualified for the study
Metrics/Questions
Question #1: What Does the Average Advertiser Do with PMax?
57.72% of advertisers run a single PMax campaign in their account
42.28% of advertisers run multiple PMax campaigns.
While 41.35% of advertisers ran one campaign with one asset group, the median number of asset groups per campaign across all advertisers is 31.
Advertisers load up on text assets (16 median per campaign), and image assets (13 median per campaign), but fall short with video (4 median per campaign).
99.2% of advertisers use audience signals.
33.3% of advertisers use search themes.
55.65% of advertisers use account exclusions in combination with PMax. These include negative keywords, placement exclusions, and topics.
72.5% of advertisers run feed-only campaigns.
Analysis/Thoughts
There are some biases in the data given that Optmyzr’s toolset proactively lets advertisers know if they’re missing audience signals. Additionally, there are tools for building out new shopping-oriented campaigns based on performance. This means our customer base is predisposed to harness feed-based PMax campaigns.
Despite those biases, there is no denying that feed-based PMax campaigns are the most popular. This is also due to ecommerce having a wider adoption of PMax than lead gen. There are a few reasons for this:
Smart Shopping got rolled into PMax and so many ecommerce marketers felt compelled to leverage PMax.
PMax thrives on ROAS bidding but can also function with CPA bidding. Lead-gen brands historically struggle to adopt ROAS bidding because they’re nervous about feeding bad data into the system.
Google-first advertisers tend to be more analytical than creative. This is absolutely shown in the bias towards text creative vs. visual. What’s interesting is that despite most PMax channels being visual, advertisers still cling to text (and expect amazing results).
Whether this is because they believe text is synonymous with bottom of the funnel, or because they are not confident or skilled to provide visual content; the fact remains that auto-generated content has a viable place in the marketplace until advertisers own it.
I was truly surprised that it’s essentially 50/50 on whether advertisers use exclusions with PMax. Given how vocal we are as an industry, I was expecting near-universal adoption. It’s unclear whether those who don’t use exclusions are doing so because they trust Google or if they don’t know how to apply exclusions.
Question #2: What Impact Does Applying Effort to PMax Have?
Before we dive into the numbers, it’s important to acknowledge the impact spend has on results. Larger spend accounts will have smaller gains because percentages are going to be smaller. We are sharing median values to mitigate this as much as possible.
Impact of Exclusions (negative keywords, placements, topics)
Campaigns using exclusions (3963) have a median CPA of $21.45 and ROAS of 425.28%
Campaigns not using exclusions (3158) have a median CPA of $18.55 and a ROAS of 423.44%
There is only a .24% difference in conversion rate between campaigns using exclusions (favors not using exclusions)
Impact of Using Feed-Only vs All Creative Asset Campaigns
Feed only campaigns have a median CPA of $21.58 and a ROAS of 502.21%
All asset campaigns have a median CPA of $16.35 and a ROAS of 101.71%
Feed only asset campaigns have a median conversion rate of 2.32% vs all asset campaigns with a conversion rate of 4.72%
Impact Of Using Audience Signals
Note: There is such a delta between accounts that use audience signals vs. those that don’t that we will only be highlighting the metrics of accounts that do. This is because we could only find 121 qualifying campaigns that didn’t use audience signals (compared with the over 14K that do). We’ll be sharing the performance gains vs the actual metrics.
35% better CPA
89% better ROAS
8% better conversion rate
Impact Of Using Search Themes
Campaigns using search themes saw a median CPA of 22.46 and ROAS of 377.33%
Abstaining from search themes resulted in median CPA of 20.30 and ROAS of 453.95%
Conversion rate is flat between using Search Themes and not using them
Impact Of Segmenting PMax Campaigns By Asset Group
Median ROAS of One Asset Group 424.57%
Median ROAS of Multiple Asset Groups 461.64%
Median ROAS of All Campaigns 426.66%
Analysis/Thoughts
There are some real surprises here on what impacts performance. I was not expecting Audience Signals to be such a big factor given that Google shared they’re designed to help teach the algorithm in the early days of the campaign. That near-universal adoption contributed to such big gains points to more utility than an early campaign boost.
Given that audience signals are so important, it’s critical that you’re setting yourself up to leverage them in the privacy-first world. Google now requires consent confirmation attached to your customer match lists and if you don’t include them, the list might fail.
Another big surprise was how tepid the results for search themes are. Given that search themes are designed to represent keywords in PMax, one would think adoption would serve better.
However, there was a sizable population of marketers using their keywords as search themes. This is a bad idea (unless the search themes/keywords are in transition) because Exact Match will always win over search themes.
However, Broad Match and Phrase can lose to search themes if the search theme syntax is closer.
The ideal workflow for search themes is to use them to test potential new Exact Match keywords. If you see your PMax campaign picking up more valuable traffic than your search campaigns, you know you need to consider adding those search themes as Exact Match keywords. Then you can test new search themes.
The control freak in me was disappointed that leveraging exclusions essentially represented a wash. That conversion rates were flat and the gains were very small on accounts that used exclusions makes one question if they are being used correctly.
I believe there is a strong human error component influencing the numbers (people not correctly applying account level negatives or not being aware of the form for campaign level).
That said, numbers don’t lie and it might be worth testing some campaigns without the human bias (provided brand standards are still accounted for).
Before we dive into the state of accounts in general, we wanted to address the biggest PMax question of all: is it worth it to do segmentation work?
Short answer: yes.
Long answer: your budget is going to influence whether you make this an asset-level or campaign-level segmentation.
If part of your business needs a specific budget, then asking one campaign to do all the work might be tough (especially if you’re serving multiple time zones/cost-of-living geos).
Conversely, if margins and value are essentially the same, you likely can save budget by consolidating with a multi-asset group PMax campaign (you can have up to 100 asset groups).
Industry View on CPCs, CPAs, ROAS, Spend & What You Can Do About It
Last year at the Global Search Awards, I had a great conversation with Amanda Farley about her suspicion that CPCs were being jacked up by human error and panic. We both agreed that the volatility in the economy and the fluctuations on the SEO side were causing erratic spending. Yet without data, we couldn’t quite put our finger on it.
Here’s a look at 2023 main metrics for the major verticals in the Optmyzr customer base. A few notes about the data:
This data is based on 6758 accounts globally.
We are including the Median change as opposed to the hard numbers. This is because accounts have a number of different factors and getting caught up in a specific number isn’t as useful as finding the profitable number for you.
Metrics
Vertical Breakdown
We looked at 6,758 accounts worldwide and compared their average and median performance difference between 2022 and 2023.
Core Findings for Cost
Spending being up across the board could have been a bad thing. However, as the ROAS and CPA graphs show, many industries have seen greater success in 2023 than in 2022.
There were a number of big SEO updates in 2023, so there is a certain degree of mitigation spend vs success spend.
The big spike in the Pet vertical is in large part due to budgets being smaller.
Core Findings for CPC
PMax plays a large role in the reduced CPCs. Given that visual placements have cheaper auctions and are a big factor in PMax campaigns, it makes sense that CPCs would trend down.
Verticals that saw spikes in CPCs (home services, law, pet, real estate, and travel) represent ties to other ad types (Local Service Ads and Hotel Ads). While those spends aren’t factored in the study, it’s worth noting that those ad types have gained much stronger adoption as CPCs rise.
We found that accounts using portfolio bidding with bid caps (either through the ad platform or using Optmyzr budget pacing tools) can help set protections in place while still leveraging smart bidding.
Core Findings for CPA
Legal is the big loser here and there are a few reasons for this: inability to leverage automation/AI due to brand restrictions, choosing ego bidding over cost-effective cost per case, and greater adoption of offline conversions factoring in the volatility of legal leads.
The fairly flat or decrease in CPA in other verticals speaks to consumer confidence, as well as a rise in micro-conversions. Accounts by in large do not use the conversion exclusion tool, which means the influx of Google-created conversions from GA4 might be a factor here.
Auto and real estate having such strong performance are tied to each other as more and more folks push for home ownership but might be forced to move outside their working cities.
Core Findings for ROAS
ROAS up or flat across the board could be taken as a stamp of approval for PMax or could be a sign that more folks are adopting ROAS bidding.
It’s worth noting that CPA decreases for the most part did not result in ROAS losses.
The general “frustration” in the market is likely from ecommerce. With CPAs up 10% and ROAS essentially flat, it speaks to consumer restraint as well as the emergence of TikTok Shops, Temu, Advantage+, and increased Amazon adoption.
Value Of Branded Campaigns
No. of accounts
CPC
CTR
Conv Rate
ROAS
CPA
Accounts that do not contain any branded campaign
9118
0.48
2.10%
7.24%
449.37%
6.65
Accounts that contain at least 1 branded campaign
10201
0.73
1.85%
7.97%
559.80%
9.15
Analysis/Thoughts
Here’s why we included the branded analysis with the vertical one: the impact on CPC and subsequent CPA/ROAS.
Branded campaigns have historically been heralded as an easy way to ramp up campaign performance. However, with the rise of PMax and the general flux in spend, the clear benefits and “best practice” level adoption are up in the air.
The ROAS and conversion rate gains aren’t that significant and all other metrics favor accounts that don’t run branded campaigns.
Based on the PMax adoption and the spend data I have two potential reasons for this:
Advertisers are jaded and have rolled branded spend into PMax and are treating PMax campaigns as branded/quasi remarketing campaigns. While I don’t think this is wise (especially given how search themes work and the ability to exclude branded), there’s no denying the level of cynicism that’s crept into the space.
Google has gotten smarter/better and no longer needs branded campaigns to understand an account has valuable campaigns.
Ultimately I still believe there is utility in a small-budget branded campaign because that way you can add it as a negative everywhere else.
Regarding the Vertical Spend Data
It is genuinely surprising to see every vertical spending more (regardless of performance gains or losses). This speaks to scares from the SEO side of the house and folks feeling like they need to make up the volume through paid. While we did hear some sentiment around fears in rising CPAs and CPCs, it’s worth noting Optmyzr customers for the most part saw cheaper CPAs and greater ROAS (with legal being a major exception).
We investigated how many ads per ad group each vertical had and were not terribly surprised all but Auto had a median of 1 (Auto has 2). This speaks to the trust among most advertisers (53%) to follow Google’s advice on the number of assets.
Many advertisers focus on Google first, regardless of whether that channel will serve them well. If you’re going to advertise on Google you need to make sure you can fit enough clicks in your day to get enough conversions for the campaign to make sense.
One of the reasons Optmyzr builds beyond Google is we see the importance of harnessing social and other search channels. Don’t feel trapped by habit.
That said, despite upticks in spend, there are clearly winning verticals, and all verticals came in flat or up on ROAS.
The Time for Automation Is Now
There has never been a better time to embrace automation layering in PPC. Having the ability to put safety precautions on bids as well as the importance of honoring what tasks will yield the highest ROI on time is mission critical.
Whether you’re an Optmyzr customer or not, you should be empowered to own your data and your creative. PMax is a staple campaign type at this point and fighting it is just going to leave you behind. However, not every task needs to be done and ultimately budget should determine how much you segment.
Keywords may be dancing between relevance and history, but until the ad networks retire them, it is important to know that Exact Match is where performance is and Broad Match is where testing lies.
After the Display vs Discovery Ads challenge, we decided to run a new test in the last part of 2023 to compare Demand Gen campaigns’ performance to that of “regular” Display campaigns. As in the previous experiment, we set the same budget for about 30 days, using the same content & targeting options. Here’s what happened.
This time we promoted ADworld Experience video-recording sales. As some of you may already know, ADworld Experience is the EU’s largest all-PPC event. Its main target audience is seasoned PPC professionals, who work with Google Ads, Meta Ads, Linkedin, Microsoft, Amazon, TikTok, and other minor online advertising platforms.
During the previous test, we found that experienced PPC professionals could be effectively targeted using an expressed interest in any advanced PPC tool. So we selected the most renowned ones excluding those not directly related to the main platforms.
Here are the brands we targeted in alphabetical order: adalysis, adespresso, adroll, adstage, adthena, adzooma, channable, clickcease, clickguard, clixtell, datafeedwatch, feedoptimise, feedspark, fraudblocker, godatafeed, opteo, optmyzr, outbrain, ppcprotect, producthero, qwaya, revealbot, spyfu, squared and taboola.
Using this list we were able to set up 3 different audiences based on:
PPC professionals who searched for a PPC tool brand in the past on Google;
PPC professionals who are interested in a PPC tool;
Users who have shown interest in PPC tool website URLs in SERPs.
Then we created a Demand Gen campaign and a regular Display campaign, with 3 ad groups each, based on one of the above audiences. The key settings were:
In both campaigns we limited demographics to users aged 25 to 55 (the main age range of adwexp participants) + unknown (not to limit too much the audience) and in Display campaigns we excluded optimized targeting (to avoid unwanted overlapping).
The goals were: past edition video-recording sales and navigating 5 or more pages in one session (to grant Google’s smart bidding enough conversion data to work on).
Geotargeting was limited to the home countries of the majority of ADworld Experience past participants (a selection of EU countries + UK, Switzerland, Norway, and Finland). We targeted all languages used in these countries and scheduled ads to appear every day from 8:00CET to 20:00CET.
In Demand Gen we had to accept Google’s default filter for moderate and highly sensible content. In Display, we excluded all non-classified content, fit for families (= mainly videos for kids on YouTube), all sensible content, and parked domains.
The bidding strategy was set for both campaigns on Maximize Conversions, not setting (at least initially) any target CPA.
Text and images were almost exactly the same, even if placements were different (GDN for Display and YouTube, Gmail and Discover newsfeed for Demand Gen). We were forced to shorten some headings in display campaigns, but descriptions and images (mainly 2023 speakers’ photos) were exactly the same. In the Display campaign, we were able to select also some videos and left auto-optimized ad formats on.
Regular Display Ad Examples
Demand Gen Ad Examples
Once we started the experiment, in the Display campaign we were soon forced to set different target CPA to grant all different groups/audiences a more uniform distribution of traffic, lowering it where it spiked and increasing it where it languished. In Demand Gen, we had to pause 2 out of 3 groups to give all of them a minimum threshold of traffic to count on (“Searchers of PPC Tools” adgroup in Demand Gen did 0 impressions for almost 20 days, until that).
In the Display campaign, we excluded all unrelated app categories (all except business/productivity ones) and low-quality placements spotted in the previous test, starting with almost 500 exclusions.
The Results
Here are the numbers we had about 5 weeks and 1.200€ spent after.
Regular Display Campaigns
Demand Gen Ads
If we look at global conversion numbers Google seems to have worked very well with Demand Gen. These AI-powered campaigns clearly outperformed both a professionally set Display campaign with the same content/setting and the old Discovery Ads we used in the previous test to promote the 2023 event registration (if we do not consider last week results, that were comparable).
Audiences performed in a fairly homogeneously way in Display, while there was a clear winner in Demand Gen, with the audience built on PPC Tools’ URLs, which Google was very fast to spot just 1 week after the kickoff, while Discovery’s latency on our previous test has been 3 weeks long. The only negative aspect of DGen traffic is the lower percentage of engaged sessions in GA4 (session longer than 10 seconds or with a conversion event or at least 2 pageviews/screenviews). It seems that GDN can still bring to your website more in-target users.
Almost all Demand Gen placements were on YouTube (both the converting ones and the rest), making me say that probably would have been better to compare this campaign with a Video Campaign, more than to a GDN one. The Display campaigns were totally on the other side of the channel, with very few placements alongside videos (& with incredibly high CPCs in some rare, but remarkable cases) and the large majority of impressions & clicks made on regular AdSense network sites.
I was also surprised to see that this time audience performances were comparable in both campaigns, while in the Discovery vs Display test “PPC Tool past searchers” achieved the best Conversion Rates in GDN. To explain that I can only suppose that this was due to the difference in the set goals. Joining an advanced event live is probably more attractive for a PPC pro than looking at its videos afterward. The most laser-targeted audience of someone who has recently searched for a valuable keyword should probably still be the best option in Display, while it is too narrow for DGen.
Final Takeaways
My final takeaway is that if your goal is not only to convert but to drive low-cost (but still well-targeted) traffic to your site with a set-and-forget campaign, then Demand Gen Ads are your must-go.
While, if you have a low budget but want to get results at an acceptable cost and have time and know how to optimize settings, then old-style Display campaigns may still be a good option. In both cases, tests with different audiences & assets are vital if you do not want to throw your money in Google’s vacuum!
If you are curious about specific aspects of the test, reach out to me, and we’ll be happy to drill down the data for you. Now it’s your turn. Did you do any comparison between Demand Gen and regular GDN campaigns? What are your findings?
Last quarter, we ran a test with Discovery Ads and “regular” Display campaigns to promote ADworld Experience event registrations. We spent the same budget for about 30 days using the same copy & targeting options. Here’s what we found.
As some of you may already know, ADworld Experience is the largest all-PPC event in Europe. The event’s main target audience is seasoned PPC professionals, who have been operating for some years in Google Ads, Meta Ads, Linkedin, Microsoft, Amazon, TikTok, and other online advertising platforms.
The experiment
The first key question to start the test was: how to effectively target experienced PPC professionals via Google Display channels?
An expressed interest in any advanced PPC tool could be one way to target them.
Creating audiences
So we made a list of the most renowned tools (in alphabetical order): Adalysis, Adspresso, Adroll, Adstage, Adthena, Adzooma, Channable, Clickcease, Clickguard, Clixtell, Datafeedwatch, Feedoptimise, Feedspark, Fraudblocker, Godatafeed, Opteo, Optmyzr, Outbrain, PPCprotect, Producthero, Qwaya, Revealbot, Spyfu, Squared, and Taboola.
Using this list we were able to set up 3 different audiences based on:
1. The PPC tool name searches in Google
2. The PPC tool’s interested users and
3. The users who’ve shown interest in a PPC tool’s website URLs in SERPs.
Campaign setup
Then we created a Discovery campaign and a regular Display campaign, with 3 ad groups each, based on one of the above audiences.
In both campaigns, we excluded optimized targeting (to avoid unwanted overlapping) and limited demographics for users aged between 25 and 55 (the main age range of ADworld Experience participants) + unknown (not to limit too much of the audience).
Campaign goals
The goals were:
Getting registrations for the 2023 event that happened on October 5 & 6,
Sales of past edition video recordings, and
Navigating 5 or more pages in one session (to grant Google’s smart bidding enough conversion data)
Geotargeting was limited to the home countries of the majority of ADworld Experience’s past participants (a selection of EU countries + UK, Serbia, Bosnia, Svizzera, Montenegro, Norway, and Finland). We targeted all languages and scheduled ads to appear every day from 8:00 CET to 20:00 CET.
In Discovery, we accepted Google’s default filter for moderate and highly sensible content. In display campaigns, we excluded all non-classified content, fit for families (= mainly videos for kids on YouTube), all sensible content, and parked domains.
Bid strategy
The bidding strategy was set for both campaigns on Maximize Conversions, not setting (at least initially) any target CPA.
The text and images were almost exactly the same, even if placements were different (GDN for Display and YouTube, Gmail and Discover newsfeed on Android devices for Discovery). We were forced to shorten some headings in display campaigns, but descriptions and images (mainly 2023 speakers’ photos) were exactly the same. In the Display campaign, we were able to select some videos and let auto-optimized ad formats turn on.
The daily budget was 20€ for each campaign (in Discovery the suggested budget was 40€/day, but we launched it and then later lowered it to 20€/day).
In a previous test with Discovery Ads, we found that URL-based ad group/audience was definitely predominant in terms of traffic, so we decided to exclude in that campaign all the tools not directly related to campaign management in the most widespread platforms (Adroll, Adstage, Godatafeed, Outbrain, Qwaya, and Taboola).
Besides that, in both campaigns, we were soon forced to set different target CPAs to grant all different groups/audiences a more uniform distribution of ads, lowering it where traffic spiked and making it higher where it languished.
Both in Discovery and regular Display we had to closely monitor the geographical distribution of the ads to have a more uniform coverage, lowering Max Bids up to -90% in some areas and pushing up to +50% in some other ones (it looks like Romania, Serbia and Bulgaria have a lot of “spammy” placements, while central EU countries offer much more refined and expensive spots, with no relevant differences between the two campaigns).
In regular Display ads, we could exclude low-quality sites and apps, ending up with almost 500 exclusions. We decided not to apply a pre-existing list of spammy/off-topic placements we built from previous campaigns to avoid giving regular Display campaigns an advantage over Discovery since the beginning.
The results
Here are the numbers we had after about 5 weeks and 1,500€ of total expenditure:
Regular Display Campaigns
Discovery Ads
Exposed target CPA are the final ones (reached after several progressive adjustments)
If we look at global conversion numbers, it might seem that Google’s AI-powered placements still have a long way to go before competing with a professionally set Display Ad campaign.
Another interesting thing is the radically different performance of the same audiences in the two campaigns. The audience of past searchers of PPC tools and URL-based targeting have been respectively the best and the worst performers in GDN and… exactly the opposite in Discovery Ads!
You will find another interesting “surprise” when you isolate the same numbers for the last week of both campaigns.
Regular Display Campaigns Final Week
Discovery Ads Final Week
The first and most evident general conclusion is that Discovery AI-powered placements need more data (time/money) to really start auto-optimizing.
The second most obvious conclusion is that if you know exactly what you are doing and need your campaigns to perform soon and to be laser-targeted, old-school display campaigns are still very likely to be your best choice.
The third important consideration is that if your goal is not only to convert but to drive low-cost traffic to your properties, then you should have few doubts about pushing for Discovery Ads.
Drilling a little down into the data, I was really surprised to see how different we’re performing with the same audiences within the two campaigns. We can only suppose that topic searchers’ targeting fits better to lower automation-level campaigns (being the most focused targeting option you may use in Display Network), while probably URL matching gives the Google Machine Learning algorithm more space for auto-optimizing (when a good amount of data becomes available).
If you aren’t familiar with Responsive Search Ads, a good way to think of them is giving Google a bunch of different text components to mix and match while it finds the best combinations. There’s a learning period for any new RSA, which means performance may not be what you’re used to right away.
With this transition from Expanded Text Ads (ETAs) to Responsive Search Ads (RSAs) comes a host of questions about the performance of RSAs, the need to display key information in your ad text, and how to manage the transition to PPC campaigns composed solely of RSAs.
Of course, third-party tools like Optmyzr can help identify the best-performing components of your current ads and even help you build RSAs from scratch. But it never hurts to know where things stand as you plan to build your RSAs.
In this article, you’ll find the results of our study on RSA performance, answers to some pressing questions about the transition, and advice on how to retain control of your search campaigns with RSAs.
How and what we analyzed
Our 2022 study of RSA performance covers 13,671 randomly chosen Google Ads accounts in Optmyzr and answers questions like:
Is RSA usage as common among advertisers as you think?
How does RSA performance compare to that of ETAs?
What effect do pinned headlines/descriptions have on performance?
We’ve presented the results by category so you can quickly find what’s most relevant to your goals.
Watch Frederick Vallaeys present the study on PPC Town Hall below.
Get actionable PPC tips, strategies, and tactics from industry experts twice a month.
Key findings from our Responsive Search Ads data analysis
Here’s our CEO Frederick Vallaeys on what the study taught us about the relationship between PPC marketers and Responsive Search Ads.
“The biggest insight is that advertisers have focused on the wrong metric. Responsive Search Ads have a better click-through rate but a lower conversion rate. This upsets advertisers because when they A/B test, they assume that the ad group has a fixed number of impressions and that by showing lower-converting ads for these impressions, conversions will go down (and costs up). Google, meanwhile, is happy because there are more clicks.”
But this is an incomplete picture.
“What our study shows is that impressions for an ad group are highly dependent on the ad, and RSAs drive 4x the impressions of a typical ETA. Even with a slightly lower conversion rate, this 400% lift in impressions nets a lot of incremental conversions that should make advertisers very happy.”
Responsive Search Ads have a better auction-time Quality Score, so they help you qualify for more auctions. They also boost ad rank and give you access to entirely new search terms (and impressions). As a result, ad-level performance and metrics like click-through or conversion rate may not paint a full picture of your performance.
Evaluate the success of your ads based on the incremental impressions, clicks, and conversions your ad groups and campaigns receive.
Statistics on Responsive Search Ad usage
This year, out of the 13,671 accounts we analyzed:
7.7% have never built a single RSA
92% currently have at least one active RSA
0.4% had RSAs but stopped using them
Optmyzr’s Interpretation: Most advertisers are already well on their way to transitioning to Responsive Search Ads, and those who have experimented with the new ad format tend to like the results enough to keep RSAs active.
Statistics on Responsive Search Ads and pinning
Pinning – fixing headlines or descriptions to specific positions – gives you more control over how your RSAs appear to users. But it also reduces your ad strength, according to Google.
In our analysis of over 93,055 Responsive Search Ads, we looked at the impact of three ways to pin: no pinning, pinning only some ad positions, and pinning all ad positions.
We found that RSAs that pin every position have great metrics like CTR and Conversion Rate, which makes sense for advertisers who’ve done great A/B testing for years and have hyper-optimized ads.
CTR is much better when pinning one text.
But impressions per ad group are 3.9 times higher when giving Google the flexibility with multiple texts per pinned location.
Optmyzr’s Interpretation: Advertisers who’ve spent several years optimizing their ETAs are creating “fake” ETAs by pinning one text at every position to recreate those strongest-performing ETAs.
Statistics on Responsive Search Ads and number of headlines
Responsive Search Ads can have up to 15 different headlines for Google to combine in different ways. And we’ve found that more headline variants lead to more impressions per RSA.
We’ve also seen GPT-3 getting quite good at suggesting ads for PPC managers to review.
After analyzing 432,343 ads, we’ve also observed that adding Dynamic keyword insertion/ad customizers to RSAs increases the impressions per ad. On the flip side, there is a decrease in conversions per ad.
Optmyzr’s observation: The ads do look more relevant and hence get more clicks, but they can’t always deliver on the promise of what was automatically inserted in the text. Adding DKI or ad customizers to RSAs can decrease performance.
Statistics on financial performance of Responsive Search Ads vs. Expanded Text Ads
Responsive Search Ads can have up to 15 different headlines for Google to combine in different ways, but you only need to provide three – anything more is optional. We grouped each ad based on the number of headlines, further segmenting them by metric.
When each ad type wins its ad group, RSAs average out at a $1.48 higher cost per acquisition than ETAs. However, they also cost an average of $10.96 less when they lose.
This means that RSAs offer comparable winning performance to ETAs while saving significant costs when they lose. This trend extends to other financial metrics like ROAS and cost per click.
Responsive Search Ads Best Practices: Stay in control of PPC in the automation era
We don’t believe that either Responsive Search Ads or Expanded Text Ads are definitively better than the other.
So much of success in PPC depends on individual account needs, client relationships, global and market volatility, supply chains, and the expertise of the marketing and business teams involved.
However, the fact remains that you won’t be able to create any new Expanded Text Ads (or edit existing ones) now.
These next sections cover our recommendations to help you get started with managing this transition. As always, use them as thought-starters in the context of your client or brand’s specific goals.
1. Know the difference between ad strength and asset labels.
Ad strength is a best-practice score that measures the relevance, quantity, and diversity of your Responsive Search Ad content even before your RSAs serve.
Every increase in ad strength provides approximately 3% click uplift e.g. poor to average, average to good. However, it has no relation to performance.
Asset labels, on the other hand, give you guidance on which assets are performing well and which ones you should replace after your RSAs serve. These suggestions from Google are based on performance data, so if one of your assets doesn’t get impressions in 2+ weeks, you might want to replace it.
2. Build evergreen Expanded Text Ads (if you can).
While you can’t create new ETAs, any existing ones will continue to serve for as long as you like. You can pause and resume these ETAs, but you won’t be able to edit them in any way – that includes bids, keywords, ad text, targeting, and even budgets.
However, that won’t be an issue if you happen to have some evergreen campaigns or ad groups that you know can run without those modifications – possibly top-of-funnel brand campaigns or for a product line that you’re confident won’t go away.
Keep in mind that not every brand will have (or can afford) these opportunities, and even the ones that do may have to accept that those ads will need to be retired at some point – like if a key supplier goes out of business or the brand changes its name.
3. Start finding the pieces of your new Responsive Search Ads.
Ad Text Optimization lets you quickly find the best-performing text in your account
If your campaigns have been running for some time, there’s a good chance that you already have some quality RSAs floating around in different ad groups. It’s finding these individual components that can prove time-consuming and error-prone.
Fortunately, a tool like the Ad Text Optimization function in Optmyzr can make light work of that, allowing you to sort through single or multiple campaigns in minutes.
Our tool allows you to sort by element type (headline, description, path), individual placement, or even full ads to find the best-performing elements for the desired metric.
Once you have your ad text ready, you can bring the process full circle:
Build a new ad with our Responsive Search Ad Utility
Validate your findings in the AB Testing for Ads tool
4. Consider variety in your Responsive Search Ads.
Key metrics for RSAs vary by the number of ads in an ad group
While you can create up to three Responsive Search Ads in one ad group, it’s difficult to find a consensus on the optimal number.
On the one hand, too many RSAs can dilute your messaging variations – especially if each one carries the full 15 headlines and four descriptions. But limiting yourself may not always be the right move either, assuming each RSA is distinct in terms of what it addresses.
The findings from our study show that ad groups with more RSAs tend to get significantly more impressions, but ad groups with two RSAs experience a surge in conversion rate that single-RSA and three-RSA ad groups don’t.
Having 2 RSA ads per ad group seems to be the sweet spot mostly based on improved conversion rates
As always, consider the merits of every situation and ad group individually.
5. Decide whether to pin elements in your Responsive Search Ads.
Google identifies excessive pinning as one of the 8 causes of weakened RSA ad strength, and while it’s not clear at what threshold this changes, it’s safe to say that your results will get weaker the more elements you pin.
However, some advertisers will need to pin specific pieces of text, such as disclaimers and warnings for those in legal or pharmaceutical advertising. Google is yet to comment on whether these industries with obligations will be assessed differently, or whether a new element will be made available to cater to this need.
For now, advertisers will have to do what they must with what they have access to. Just reconsider if you’re thinking about gaming the system by pinning all your elements to create a pseudo-Expanded Text Ad.
6. Change how you think about A/B testing with RSAs.
The methodology of A/B ad testing has long been premised on the assumption that impression volume is determined primarily by keywords and is only minimally dependent on the ad. This assumption is false with Responsive Search Ads.
Old Way: Focused on conversion rates or conversions per impression
New Way: Focused on conversions within CPA or ROAS limits
7. Take out a PPC insurance policy with automation layering.
A list of active alerts at multiple levels in Optmyzr
Maybe you’ve had success with your search campaigns by determining large parts of their optimization strategies, or maybe you’ve been using automated bidding strategies in tandem with solidly built Expanded Text Ads that you control.
Performance Max in itself is not a direct threat to your account – you can always opt out of them unless you plan to use a Local or Smart Shopping campaign, both of which will be absorbed by Performance Max.
However, the double whammy of switching to Responsive Search Ads and running a Performance Max campaign together can be a risk for all but the most insulated PPC accounts. We suggest tackling one at a time.
Even then, the more Google automates their platform, the more vital it becomes for you to have a layer of automation working for the benefit of your account. A tool like Optmyzr makes that all the more possible – and effective.
Optmyzr users get access to all types of budget-related and metric-based alerts, giving them the ability to intervene as soon as signs of trouble begin to show. There’s also the Rule Engine, one of our most popular tools that lets you create rule-based automation for anything you can think of.
Best of all, you can switch it all off whenever you like.
But first, revisit your account structure.
Before doing anything, it’s important to understand how any brand’s individual transition to the Responsive Search Ad era will impact its account structure. Some of the questions you’ll need to answer include:
Which campaigns and ad groups will continue to serve Expanded Text Ads?
Which ad groups need new Responsive Search Ads? How many in each?
Do I need to create new campaigns to avoid mixing RSAs and ETAs?
How will I monitor the performance of legacy and new ads/campaigns?
One of the best places you can start is with Aaron Levy’s session from our UnLevel virtual conference in May 2021. In 40 minutes, Aaron shares a framework for building an account structure that is adaptable to the rapid change and increased automation that have come to define modern-day PPC.
This article repurposes portions of Frederick Vallaeys’ presentation on Responsive Search Ad performance from SMX Advanced 2022.
This article was originally written on Aug 17, 2022. It has been updated on April 7, 2023.
Get actionable PPC tips, strategies, and tactics from industry experts to your inbox once a month.
On July 23, 2025, Amazon abruptly pulled all its ads from Google shopping. The move disrupted the paid search ecosystem almost overnight. As one of Google’s biggest and savviest advertisers, Amazon’s exit gave us a rare look at what happens when a major player disappears from the auction.
At Optmyzr, we analyzed data from thousands of advertiser accounts to understand the immediate impact. The results challenge a familiar belief: that less competition means better outcomes. They also offer lessons for brands adjusting to sudden market shifts.
Amazon didn’t wind things down or test a new strategy. They pulled out of Google shopping ads completely and without warning. That created a rare chance to see how Google’s ad auctions respond when a major bidder suddenly vanishes.
In Google’s auction system, advertisers compete in real-time for ad placements based on their bids, ad quality, and expected impact. When a major player like Amazon exits, they don’t just free up a few ad slots. Their absence reshapes the competitive landscape across every keyword, audience, and placement they used to touch.
Our analysis methodology
To isolate the true impact of Amazon’s departure from seasonal effects, we used a precise 7-day comparison methodology with the strictest account matching criteria:
Study period: July 16-22, 2025 vs July 23-29, 2025 Why this matters: We skipped Prime Day (July 8–11) and balanced the weekdays across both weeks. Dataset: Perfect account matching with identical advertiser pools in both periods Requirements:
Accounts must have 3+ days overall in both periods
Accounts must appear in the same shopping ads category in both periods
Accounts must have 3+ days within that category in both periods
This clean comparison lets us tie changes to Amazon’s exit rather than promotional calendar effects, day-of-week variations, or account churn.
Caveats: Conversion lag in ecommerce
Some ecommerce categories have longer paths to purchase. This means part of the conversion value may not have shown up in our initial 7-day window. A lower observed conversion value doesn’t always mean poor performance — it might just reflect a time lag.
To account for this, we’ll re-run the study using the same time window but pull data 30 days later. That way, we can measure any additional revenue that accrues over time and ensure the findings reflect true long-term performance.
Overall market impact: More volume, less value
The data tells a surprising story: less competition doesn’t always help the advertisers left behind.
Key Insight: Advertisers got more clicks for less money, but the value of those clicks dropped. It suggests many of those extra clicks came from people looking for Amazon. When they landed on competitor ads, they brought expectations around price, shipping, and convenience that few brands could match.
The consumer expectation trap
The standout insight: volume went up, but value went down. Advertisers saw:
8.3% lower CPCs — looks good on the surface
7.8% more clicks — more traffic, more chances
5.5% drop in conversion value — less revenue from that extra traffic
The pattern points to buyer behavior. Shoppers looking for Amazon clicked elsewhere, but still expected Amazon-level pricing, speed, and ease. When competitors couldn’t match these expectations, conversion rates and values suffered.
For PPC managers, this highlights the danger of the “volume trap”—celebrating increased traffic without considering whether that traffic genuinely aligns with your value proposition.
Category-by-category breakdown: Winners and losers
The impact varied dramatically across different industry verticals, revealing which types of businesses were best positioned to capitalize on Amazon’s departure.
Electronics: The clear winner
Electronics brands were best positioned to gain from Amazon’s exit. Big players like Best Buy and Apple can compete on the same things Amazon excels at: fast delivery, strong pricing, and trusted fulfillment.
Electronics was the only major category to see increases across all key value metrics: conversions (+81.3%), conversion value (+10.9%), and ROAS (+7.1%).
Despite a moderate increase in impressions (+11.4%) and clicks (+11.5%), these advertisers successfully converted the Amazon-displaced traffic at higher rates and values, likely because they could satisfy consumers’ expectations for fast, convenient delivery and competitive pricing.
Home & Garden: The volume puzzle
Home & Garden presents an interesting case study in the volume trap phenomenon, with significant traffic increases but declining value metrics.
The pattern—significant click growth (+13.1%) and stable cost (+0.2%) but declining conversion value (-7.5%) and ROAS (-7.7%)—suggests Amazon-seeking consumers found home & garden alternatives but made lower-value purchases or were more price-sensitive than typical customers.
Sporting Goods: The volume trap exemplified
Sporting Goods represents perhaps the clearest example of the “volume trap” phenomenon we’ve been describing.
This category saw substantial conversion volume increases (+20.7%) and improved conversion rates (+15.7%) with minimal traffic growth (+4.3% clicks), yet experienced significant value decline (-9.9%) and ROAS deterioration (-8.0%).
Likely explanation: shoppers landed on competitor sites, but bought cheaper gear or held back due to price.
Health & Beauty: Stable volume, flat value
Health & Beauty brands picked up the extra traffic, but couldn’t hold onto revenue per sale.
Despite achieving 14.6% more conversions from Amazon-displaced traffic, conversion value remained essentially flat (+0.3%). Translation: those new conversions were worth a lot less than usual. If quality stayed the same, revenue should have risen in lockstep. But thanks to new clicks being cheaper (-11.5%), ROAS slightly rose (+1.1%).
Tools and Hardware: Similar consumer expectation challenges
Tools and Hardware followed the same pattern as Sporting Goods — more conversions, but lower value.
Like Sporting Goods, this category captured significantly more Amazon-displaced conversions (+14.7%) with improved conversion rates (+7.1%) but struggled to extract the same value per conversion (-6.3% value, -5.9% ROAS), likely due to consumer expectations around pricing and convenience that Amazon had established.
Vehicles & Parts: High-value category decline
Vehicles & Parts showed concerning trends across both volume and value metrics.
Despite modest click growth (+4.8%) and reduced costs (-5.3%), the category experienced declining conversion value (-5.3%), suggesting that Amazon-seeking consumers in this category had different purchase behaviors or price expectations. But like Health & Beauty, the reduction in CPC (-9.6%) helped protect the ROAS (+0.1%)
Apparel & Accessories: Large volume, declining value
As the largest category by volume, Apparel & Accessories demonstrates the volume trap at scale.
Despite representing the largest volume of traffic, Apparel & Accessories saw declining performance across key metrics, with conversion value dropping 9.5% and ROAS declining 7.3%. This suggests that Amazon-seeking fashion consumers had strong expectations around pricing, selection, and return policies that competitors struggled to match.
Arts & Entertainment: The content value challenge
Arts & Entertainment showed mixed results, with increased traffic but declining conversion metrics.
This category achieved significant click growth (+15.4%) but saw concerning declines in conversion rate (-19.9%) and ROAS (-8.3%), suggesting that displaced Amazon traffic in entertainment categories had different engagement patterns or value expectations.
Furniture: Stable volume, value concerns
Furniture presents an interesting anomaly with stable click volume but declining conversion value.
The pattern—stable clicks (+0.8%) and conversion volume (+2.0%) but dramatically lower conversion value (-11.7%) and ROAS (-8.8%)—suggests a fundamental shift in purchase behavior. Despite reduced costs, the significant value decline indicates consumers may have been purchasing lower-priced items or single pieces rather than complete furniture sets.
What this means for your Google Ads strategy
Different categories reacted in different ways — but the patterns offer clear takeaways for PPC teams:
1. Assess your competitive position against Amazon’s value proposition
Electronics succeeded because major players like Best Buy and Apple can match Amazon’s delivery speed and pricing. In contrast, most other categories saw the classic “volume trap”—more traffic but less value as Amazon-seeking consumers brought different expectations.
2. Recognize the volume trap early
Categories like Sporting Goods (+20.7% conversions, -9.9% value) and Health & Beauty (+14.6% conversions, +0.3% value) show how increased traffic can mask underlying performance degradation. Always track value, not just volume.
3. Learn from true success vs. volume traps
Only Electronics truly succeeded with positive conversion value (+10.9%) and ROAS growth (+7.1%). Everyone else hit some version of the volume trap — more clicks, but less to show for it.
4. Understand your category’s vulnerability
If you compete on Amazon’s turf — price, speed, convenience — you’re more exposed. The data shows widespread expectation mismatches across these categories.
5. Focus on sustainable competitive advantages
Rather than simply trying to capture displaced Amazon traffic, develop positioning that attracts consumers who genuinely value your specific offerings.
Why displaced traffic isn’t free traffic
Amazon’s exit highlights something critical: traffic doesn’t shift cleanly when a dominant player leaves. It drags along expectations most brands can’t meet — fast shipping, low prices, and frictionless buying.
That creates the volume trap: cheaper clicks, more traffic, and worse results. Unless you can actually match Amazon’s offer, you’ll struggle to turn those clicks into value.
For the Google Ads ecosystem, this suggests that major ecommerce advertisers play a crucial role not just in competing for inventory, but in training and conditioning consumer expectations. When they leave, shoppers don’t reset. They carry their shaped expectations into your funnel, whether you can meet them or not.
Takeaways for PPC advertisers
What PPC managers should take from all this:
Distinguish true success from volume traps
Only Electronics achieved both volume and value growth. Most categories experienced some form of the volume trap with declining efficiency.
Monitor ROAS alongside conversion metrics
Flat or growing conversion volume can hide declining profitability if conversion values decline or costs increase.
Evaluate displaced traffic quality
Amazon-seeking consumers bring specific expectations that most categories couldn’t meet profitably, leading to either lower conversion values or conversion rate declines.
Consider lifetime value implications
The only justification for accepting lower immediate ROAS is if the additional traffic represents new customers with strong repeat purchase potential.
Focus on sustainable differentiation
The successful Electronics category could match Amazon’s value proposition, while others struggled when competing on Amazon’s core strengths.
Displaced traffic isn’t neutral — it’s shaped by the brand that left. And unless you can meet those expectations or grow LTV fast, it’s traffic you’ll struggle to monetize.
When Google launched Performance Max (PMax), it was positioned as the ultimate automated campaign, designed to unify and optimize ads across all of Google’s channels: Search, Shopping, YouTube, Display, and more.
But as many advertisers have found, adding PMax to the mix isn’t always additive. In fact, it might be quietly cannibalizing the performance of your most valuable Search campaigns.
At Optmyzr, we wanted to know just how often this happens and how much impact it has. So we dug into performance data from hundreds of accounts to see where and when PMax overlaps with Search.
The results might surprise you…
Why we ran this study
Advertisers love the control and predictability of Search campaigns. Performance Max, on the other hand, provides less control and is, by design, more opaque.
However, advertisers are encouraged to use both campaign types in tandem, with Google advising that the keywords added to a search campaign should nearly always take precedence over the automated matching done by PMax. They even tell us, “If the user’s query is identical to an exact match keyword in your Search campaign, the Search campaign will be prioritized over Performance Max.”
Scenarios 1-3 in the following table illustrate what that prioritization is supposed to look like.
Prioritization of Ad Serving When Search and Performance Max Compete
Scenario
Keyword
Keyword Match Type
Search Term
Which campaign serves the ad?
Why?
1
Flowers
Exact
Flowers
Search campaign is prioritized
The keyword text is the exact same as the search term text
2
Flowers
Phrase
Flowers
Search campaign is prioritized
The keyword text is the exact same as the search term text
3
Flowers
Broad
Flowers
Search campaign is prioritized
The keyword text is the exact same as the search term text
4
Flowers
Phrase
Flowers Near Me
Depends - Campaign with better ad rank wins
The keyword and search term text are different
5
Flowers
Broad
Deliver Roses
Depends - Campaign with better ad rank wins
The keyword and search term text are different
Scenarios 4 and 5 show what happens when a keyword with the same text as the query doesn’t exist in the search campaign, but a broad or phrase match could have triggered the ad. In those scenarios, auction-time signals are used to decide whether to serve an ad from Search or PMax.
But in practice, many advertisers suspect that PMax is crowding out their Search campaigns, even for keywords they specifically target. They suspect that what actually happens is different from what is explained in the table of what is intended to happen.
So we set out to answer key questions like:
How often does the PMax campaign show an ad for a keyword that exists in a search campaign?
Are the same search terms showing up in both PMax and Search?
Does this overlap happen across all match types?
Which campaign delivers better performance when there is an overlap?
How we ran our search term overlap study
For this study, we reviewed data from February 1 to February 28, 2025, across 503 accounts managed in Optmyzr.
Our analysis had two parts:
Part 1: Exact keyword overlap
We looked for keywords in Search campaigns that also appeared in the PMax search terms report, indicating that PMax triggered ads for keywords explicitly targeted in the advertiser’s Search campaign.
Here’s what that looks like in reports we pulled:
A sample from the data we pulled shows when a search campaign’s keyword text is exactly the same as the search term’s text that triggered a PMax ad.
Note that the text of the keyword is the exact same as the text of the search term that triggered the PMax campaign to show an ad. The keyword match type doesn’t matter; we just check that the text is an exact match.
In our table of scenarios, this would correspond to scenarios 1, 2, or 3.
Part 2: Search term overlap
We checked for search terms that showed up in both PMax and Search campaign reports, and that were not exact matches for an existing search campaign keyword. This indicates that the search campaign contained relevant keywords that could have shown the ad, but sometimes the PMax campaign won the auction and showed the ad for that query.
In our table of scenarios, this would correspond to scenarios 4 or 5.
In both parts, we compared performance for CTR and Conversion Rate. We defined performance differences as “insignificant” if they were under 10% different. We did not include CPC, CPA, and ROAS because Google did not report cost data for PMax search terms at the time of our analysis.
The findings: Keyword overlap is real
When a search campaign contains a keyword whose text matches the search term exactly, Google says the search campaign should be prioritized. What we observed indicates that this prioritization is not what advertisers would expect, and Performance Max frequently cannibalizes the search keyword.
The reason could be that the search campaign was ineligible to show an ad due to targeting or budget constraints. We did not analyze that possibility in this study.
Prevalence of Performance Max cannibalizing search keywords
Accounts: 91.45% of 503 accounts had keyword overlap between Search and PMax.
Campaigns: 56.29% of 5,768 Search campaigns showed this overlap.
Ad Groups: 27.86% of 40,642 ad groups were impacted.
The overlap was identified for all match types, including exact match keywords. So, having a keyword with the exact text of a search term, and making it an exact match keyword, does not guarantee that the overlap won’t happen.
Performance difference when Performance Max cannibalizes search keywords
Ultimately, advertisers care about performance and would likely not complain if Google’s automation did something that led to better financial outcomes for their campaign.
Unfortunately, it’s not possible to measure ROAS differences because PMax campaigns don’t report revenue data at the search term level. So we analyzed two important metrics for which data is available: CTR and conversion rate.
CTR results:
Search campaign performed better: 28.37%
Performance Max campaign performed better: 15.98%
No significant difference: 55.65%
Conversion rate:
Search outperformed PMax: 18.91%
PMax outperformed Search: 6.17%
No significant difference: 74.92%
Takeaway
In most cases, when PMax overlaps with existing search keywords, the performance difference is not significant. However, when the difference exceeded 10%, the search campaign was more often the campaign type with the better performance.
Search term overlap between PMax and search campaigns
This is part 2 of the study. There was also an overlap between Performance Max and Search campaigns when there was no keyword that matched the search query exactly.
This was expected and aligns with Google’s guidance that Ad Rank is the determining factor in these instances. We measured how often this type of overlap exists and how the performance differs.
Accounts: 97.26% of 511 accounts had search term overlap.
Search Campaigns: 76.17% showed overlap with PMax.
PMax Campaigns: 97.40% overlapped with Search campaigns.
Performance difference when Performance Max and search overlap
CTR (424,820 search terms analyzed):
Search won: 32.37%
PMax won: 24.21%
No significant difference: 43.42%
Conversion rate:
Search better: 7.66%
PMax better: 4.32%
No significant difference: 88.03%
Takeaway
Overlap is nearly universal, but performance differences are usually minor. But again, when there is a difference greater than 10%, Search is more likely to be the better-performing campaign type.
Why this matters: Efficiency and control
When PMax runs alongside Search and targets the same queries, it creates internal competition. That means:
You might pay more for clicks that Search could have delivered more efficiently.
You lose control over which creative or audience drove results.
You can’t fine-tune performance as easily because PMax aggregates reporting across channels.
And while PMax is supposed to avoid this overlap, our data shows otherwise.
What advertisers should do
If your Search campaigns are losing impressions to PMax, you’re not alone, and you’re not powerless. The key is to understand that cannibalization isn’t just a function of overlapping keywords. It often happens because your Search campaign becomes ineligible to serve ads in the first place.
That ineligibility can stem from mismatches in location targeting, ad schedules, audience exclusions, or budget constraints. For instance, if your Search campaign doesn’t have enough daily budget to stay active or is limited by a narrower geographic focus, Google won’t even enter it into the auction, leaving PMax to pick up the traffic by default.
To protect your Search performance and regain control:
Use Search Term Insights (e.g., from Optmyzr) to identify where PMax overlaps with Search. When you find converting terms in PMax that aren’t in your Search campaigns, add them as exact match keywords to shift priority back to Search.
Align your campaign settings — check your targeting, bids, and budgets — so Search campaigns remain eligible across the full range of impressions you want to capture.
Turn off auto-apply recommendations that remove “redundant” or “non-serving” keywords. These automated changes often strip your campaigns of the very keywords that protect them from PMax encroachment.
Add branded misspellings as exact match keywords to Search. Even with brand exclusions enabled, PMax can still trigger ads for fuzzy matches that dilute your brand’s performance data.
Remember, PMax thrives when there’s a gap, either in eligibility, bid competitiveness, or keyword coverage. Your job is to close those gaps. Use PMax where it performs best: as a complement to your Search campaigns, not a replacement for them.
Final thoughts
Performance Max can be powerful, but only when it complements, not competes with, your Search campaigns. As this study shows, Google automation’s promise still needs human oversight to reach its full potential.
Search campaigns give you control. PMax gives you scale. But only when you manage both thoughtfully can you truly maximize performance.
One of the first things you notice when managing Amazon Ads is that the data doesn’t settle right away. Clicks and costs show up fast, but conversions, sales, and impressions take longer to update. And those are the metrics that drive strategy.
That’s a problem.
Advertisers rely on timely data to make decisions. If you’re managing budgets or evaluating ROAS based on a snapshot that’s still shifting, you could be pausing profitable campaigns or under-crediting what’s actually working.
At Optmyzr, we decided to measure just how delayed Amazon Ads reporting really is. We looked at how much performance data changed over time, how often that change was significant, and what marketers can do to avoid making the wrong call too soon.
Here’s what we found.
What is Data Delay on Amazon ads?
Amazon Ads data delay refers to the lag between when an event (like an ad click or sale) occurs and when it gets fully reported in the Amazon Ads console or API. According to Amazon, it can take up to 14 days for conversion and sales data to settle, while metrics like impressions can also take time to complete.
Why is this important to understand?
Advertisers rely on timely data to:
Optimize budgets
Adjust bids
Evaluate ROAS and profitability
If that data is still in flux, there’s a risk of making decisions based on a faulty snapshot, like turning off a high-performing campaign or under-crediting a successful tactic. For advertisers managing across platforms, Amazon’s delay creates a blind spot that’s easy to overlook but hard to ignore.
What we analyzed in our study
We ran a deep dive analysis using internal platform data from campaigns running on February 10, 2025. We pulled Amazon Ads performance data for that day repeatedly over the next 17 days, assuming the snapshot on February 27 was the most complete.
Our analysis included:
302 Amazon Ads accounts
14 global marketplaces
14,991 campaigns
79 unique users
Metrics tracked:
Impressions
Clicks
Cost
Attributed Conversions (14-day window)
Attributed Sales (14-day window)
What we learned from the data
The results were eye-opening, especially when you zoom in on the campaigns most affected by Amazon’s reporting delays.
In the top 5% of campaigns, impression counts changed by at least 36.67% from Day 1 to Day 17. That’s a significant swing in visibility data that could affect everything from pacing to optimization logic.
For attributed sales, the top 5% of campaigns saw their revenue figures grow by at least 18.75% after the initial report. That’s enough to shift decisions about profitability and campaign continuation.
These aren’t fringe anomalies. These are real, measurable discrepancies that occurred in 1 out of every 20 campaigns in our dataset — a meaningful share for any large-scale advertiser.
Not all metrics are equally delayed
A key insight from the study: not every metric is equally delayed.
Clicks and Cost data are reported relatively quickly and are much more stable.
In contrast, Impressions, Conversions, and Sales take longer to finalize and are more susceptible to change.
For advertisers, this distinction matters:
You can usually trust spend and click data right away.
But metrics that reflect your business outcomes (like conversions or sales) require more patience.
Here’s a look at the delays for each of the analyzed metrics. Cells highlighted in yellow reflect delays between this day and the final data on day 17. I will explain below how to interpret the charts in more detail.
How should you interpret the “top X%” data?
You’ll notice we’ve included values like “Top 10%,” “Top 5%,” and “Top 1%” in our metrics. Here’s what those numbers mean:
Let’s take top 10% as an example:
We measured how much each campaign’s data changed between Day 1 and Day 17.
Then, we ranked all campaigns by that change.
The Top 10% includes the campaigns with the biggest changes.
The value we show is the smallest change within that group, so if your campaign is in the worst 10%, you’ll see at least that level of discrepancy.
This method helps quantify how bad things can get in edge cases, even if the average looks stable.
What can advertisers do based on our findings?
Be patient with conversion data. Avoid making ROAS decisions in the first 3 days after a campaign runs.
Educate clients or teams. Not everyone knows Amazon reporting is this delayed. Set expectations.
Align reporting windows. If you’re generating weekly reports, exclude recent days where data hasn’t stabilized.
Automate with caution. Don’t train bidding systems or make rules that act on unstable data.
Flag volatile campaigns. Watch for accounts or products that fall in the top 10% for delayed metrics.
The bottom line
Amazon Ads offers an enormous opportunity, but if you’re making decisions based on yesterday’s data, you could be misjudging performance by 100% or more.
Smart advertisers know that it’s not just about what the data says, but also when it says it. By understanding how long it takes for Amazon Ads data to settle, you’ll avoid premature decisions and unlock better optimization strategies.
For years, Cyber Monday has held the title of the biggest online shopping day, and recent reports like Adobe’s 2024 study confirm this with $13.3 billion in total e-commerce sales, compared to Black Friday’s $10.8 billion.
But here’s where things get interesting: when we narrow the focus to Google Ads-driven sales, the narrative flips. Optmyzr’s analysis of 11,423 accounts found that Black Friday consistently outperforms Cyber Monday in ad-driven conversion value.
Does this mean advertisers may be focused on the wrong day to drive most of their sales? Let’s dig into the findings and see what they mean for marketers.
The data that flips the script
From Optmyzr’s perspective based on a subset of accounts:
Black Friday 2024 (Nov 29) drove $94.62 million in Google Ads-attributed conversion value, eclipsing Cyber Monday’s $64.07 million.
The average value per conversion on Black Friday was $85.09, significantly higher than Cyber Monday’s $74.82.
These findings reveal that for advertisers leveraging paid media, Black Friday is the clear leader—not Cyber Monday.
Optmyzr’s study about Black Friday vs. Cyber Monday
Ad Spend
Conversion Value
Value per Conversion
ROAS
2024
Black Friday
$15,321,664
$94,624,043
$85.09
617.58%
Cyber Monday
$14,121,621
$64,070,399
$74.82
453.70%
Ad Spend
Conversion Value
Value per Conversion
ROAS
2023
Black Friday
$13,990,189
$101,574,600
$78.37
726.04%
Cyber Monday
$13,250,633
$71,587,342
$69.88
540.26%
This Optmyzr data is as of Dec 7, 2024 for 11,423 accounts that advertised on Google Ads on Black Friday and Cyber Monday this year and last year. Note that conversion values are self-reported by advertisers, and that the 2024 conversion value numbers are likely going to be higher than what is shown here due to conversion delays.
Why Cyber Monday isn’t always the clear winner for ecommerce
So, why does Adobe’s data crown Cyber Monday the overall e-commerce champion, while Optmyzr’s data gives the edge to Black Friday? The answer lies in segmentation and shopping behavior:
1. Broader ecommerce vs. paid media attribution
Adobe tracks all e-commerce sales, regardless of traffic source. Cyber Monday’s strength comes from organic and direct channels like email marketing, bookmarked deals, and returning visitors. Optmyzr focuses specifically on sales attributed to Google Ads, where Black Friday’s urgency and high-ticket deals drive stronger ad-driven performance.
2. The role of urgency in Black Friday ads
Black Friday is a high-advertising day, with retailers flooding paid media with aggressive promotions for big-ticket items. Shoppers are primed to click and convert, leading to higher ad-attributed sales.
3. Cyber Monday’s organic advantage
By the time Cyber Monday arrives, many shoppers have bookmarked deals or received email reminders, reducing reliance on ads. The day’s strength lies in smaller, follow-up purchases driven by organic and direct traffic.
Why should you care
For advertisers, understanding the segmentation between total e-commerce sales and ad-driven performance isn’t just an exercise in analytics—it’s the key to making smarter budget decisions. If you rely on Google Ads to drive your holiday sales, the conventional wisdom that Cyber Monday is the biggest online shopping day might lead you to misallocate resources.
Optmyzr’s data shows that Black Friday drives more value for paid media campaigns, suggesting that ad budgets and strategies should align with the day’s urgency and consumer behavior. Recognizing these nuances enables advertisers to optimize their campaigns for maximum return, standing out in a crowded holiday marketplace.
What you should take away
Advertisers should rethink how they approach Black Friday and Cyber Monday 2025 in their holiday strategies. Here’s how to act on these insights:
1. Double down on Black Friday ads
If you’re running Google Ads, Black Friday offers unparalleled opportunities for high-value conversions. Allocate larger budgets to capture the wave of motivated shoppers and focus on premium products and bundled deals.
2. Leverage Cyber Monday’s organic strength
Cyber Monday remains vital, but its strength lies outside of paid channels. Use retargeting and email campaigns to re-engage shoppers who browsed during Black Friday.
3. Reevaluate attribution models
The segmentation between total sales and ad-attributed sales underscores the importance of understanding your channel performance. A broader e-commerce win for Cyber Monday doesn’t diminish the fact that Black Friday delivers better results for paid media campaigns.
Tailor your campaigns based on data
The holiday shopping narrative has long been dominated by Cyber Monday’s total sales supremacy. But Optmyzr’s data suggests that for advertisers using paid media, Black Friday is the real champion.
This insight challenges conventional wisdom and opens up new possibilities for advertisers looking to make the most of their holiday budgets. By recognizing the strengths of both days and tailoring campaigns accordingly, you can drive performance that outpaces competitors who stick to the old playbook.
And after what you read here, if you think Optmyzr is the tool for you to drive higher performance, sign up for a 14-day free trial today.
Thousands of advertisers — from small agencies to big brands — worldwide use Optmyzr to manage over $5 billion in ad spend every year. Plus, if you want to know how Optmyzr’s various features help you in detail, talk to one of our experts today for a consultation call.
In Google Ads, attracting the right traffic isn’t just about selecting keywords—it’s about aligning those keywords with user intent. Understanding when to use exact match, phrase match, broad match, or negative keywords is crucial for maximizing ad spend and targeting effectively.
The stakes are high: the wrong match type can waste budgets on irrelevant clicks, while the right choice can drive higher click-through rates, return on ad spend, and quality leads.
This guide provides a clear, practical breakdown of each match type. You’ll learn the strengths and weaknesses of exact, phrase, and broad match, along with the best use cases and key findings from our latest match type study which analyzes data from Q3 2024 (July to September) on advertiser preferences and performance.
What are the different keyword match types in Google Ads?
Google Ads offers three main keyword match types, each with unique targeting criteria:
Exact Match (EM): Targets searches that closely match the keyword, delivering high precision with limited reach.
Phrase Match (PM): Matches ads to searches that align with the keyword’s meaning, even if wording or order varies.
Broad Match (BM): Provides the widest reach, allowing ads to show for a broad array of related searches.
These match types suit different campaign goals. Understanding their individual advantages allows advertisers to structure campaigns for the best performance.
When to use each match type?
Exact match: Best for precision
Ideal for branded keywords or high-intent searches where relevance is key
Ensures minimal wasted clicks and higher engagement from users who search for the exact keyword meaning
Works best in campaigns targeting specific product terms or high-value, bottom-of-funnel audiences
Phrase match: Balance between reach and control
Useful for competitive markets and thematic keyword groupings
Helps broaden reach to intent-aligned searches while maintaining relevance
Effective for capturing closely related search queries without overly restricting traffic
Broad match: Maximizing reach with Smart Bidding
Ideal for top-of-funnel campaigns or discovering new audiences at scale.
Works well when paired with Smart Bidding to improve relevance by analyzing user intent in real-time.
Requires careful monitoring and the use of negative keywords to avoid irrelevant clicks.
Performance insights from our study
Strategic Data: Our November 2024 analysis of 992,028 keywords across 15,491 ad accounts highlights the unique strengths of each match type:
Source: Optmyzr Keyword Study - November 2024
Key Takeaways:
Exact Match achieves the highest ROAS (415%) and CTR (21.66%), proving its value for high-intent campaigns.
Phrase Match shows a strong balance with a high conversion rate (9.31%) and solid ROAS (313%), making it ideal for advertisers needing both control and reach.
Broad Match delivers high volume at a lower ROAS (277%) and CTR (8.5%), making it suitable for large-scale or exploratory campaigns where volume outweighs precision.
Our analysis of keyword match types from 2022 to 2024 reveals consistent patterns in how advertisers allocate their keywords across broad, exact, and phrase match types. The distribution of match types has remained largely stable over the past two years, with only minor shifts in usage:
Broad Match: Increased from 33.12% in 2022 to 36.67% in 2024 (+3.55%).
Exact Match: Declined slightly from 37.11% in 2022 to 34.35% in 2024 (-2.77%).
Phrase Match: Marginally decreased from 29.77% in 2022 to 28.98% in 2024 (-0.79%).
This consistency highlights that advertisers continue to use match types in similar proportions, suggesting their strategic value has not significantly changed over time.
Phrase match still dominates in terms of usage, followed by exact match, with broad match showing the most growth—likely due to advancements in Smart Bidding and Google’s improved intent-matching algorithms.
So what does this data say?
The relatively static distribution reflects how each match type serves distinct campaign goals:
Phrase Match remains a popular choice for balancing reach and relevance, particularly in competitive markets.
Exact Match continues to serve as the go-to for precision targeting, despite a slight decline in usage.
Broad Match shows steady growth, indicating more advertisers are willing to leverage it for discovery and scale, particularly with the support of Google’s AI-driven bidding strategies.
These findings reinforce the importance of understanding when and how to use each match type effectively, as their roles in campaign strategy remain crucial even amidst changes in Google Ads’ algorithms and AI capabilities.
To maximize results, you need to optimize campaigns regularly by analyzing keyword performance, adjusting bids, and refining negative keywords. Brand exclusions and inclusions are also useful tools, particularly when working with phrase and broad match, to control the quality and relevance of ad placements.
Best practices for each match type
Exact match tips
Stick to specific keywords: Limit exact match to precise, high-intent terms, such as brand names or product-specific keywords.
Monitor regularly: Adjust keywords based on performance to ensure that you’re not missing out on potential traffic due to overly narrow targeting.
Phrase match tips
Organize thematically: Group keywords by related themes to improve relevance.
Use brand exclusions: Prevent ads from appearing on searches for your brand terms that you already have in branded campaigns.
Add negative keywords: Continuously refine your negative keyword list to filter out less relevant searches.
Broad match tips
Leverage smart bidding: Broad match works best with Smart Bidding, which adjusts bids based on Google’s analysis of search intent.
Track search terms: Regularly review search terms and add irrelevant queries as negative keywords.
Use brand inclusions: For increased precision (but lower volume), consider allowing ads only on queries related to your brand.
Capture the right clicks with precise targeting
In Google Ads, your choice of keyword match type is more than just a technical detail.
But no match type is a magic bullet. Success requires a hands-on approach—analyzing performance, adjusting bids, adding negative keywords, and refining your strategy as the data comes in.
If you need help with that from a proven set of tools, try Optmyzr.
Performance Max revolutionized the way marketers advertise on Google, allowing them to advertise across Search, Youtube, display, Discover, Gmail, and local with a single budget and different creatives. Some have fallen in love with the ad type because it removes the bias from budget allocation, while others distrust it because PMax doesn’t allow for as much control and reporting as conventional Google campaigns.
However, the biggest reason PMax is such a polarizing campaign type is because there are no concrete best practices on what makes a successful PMax structure. So, we decided to investigate the most common PMax trends and shine a light on the ones that perform best as well as the tactics that underperform.
In this study, we’ll assess:
Whether what the majority of advertisers are doing is profitable
The impact of other campaigns on PMax
Whether human bias affects performance
How creative and targeting choices impact PMax
What a ‘healthy’ PMax campaign looks like
Methodology
Before we dive into the data, it is worth noting that there is a mix of ecommerce and lead gen campaigns in the cohort.
A total of 9,199 accounts and 24,702 campaigns are included in the data.
Accounts had to be at least 90 days old and have conversions.
Accounts had to have at least $1,000 monthly budget and could not exceed a $5 million monthly budget
We did our best to account for different structure and creative choices, however data at this scope cannot perfectly segment out each use case. We dug into a random assortment of accounts in each question (below) to confirm trends we’re seeing.
Data Questions & Observations
Below, you’ll find the raw data from the study. We’ve also organized the findings in the sections that follow.
Raw Data
Typical structure:
Impact on performance when an account was below or above the average for typical structure:
Only PMax or Media Mix:
Other Campaign Types Present:
This table shows the performance of the PMax campaigns when an account did or did not have the specified campaign type.
Bidding Strategies Used:
This is the breakdown of how each bidding strategy in PMax performs.
Impact of Using Exclusions:
This data shows the impact of using brand exclusion lists and other types of exclusions (negative keywords, placements, and topics).
Is Feed Present:
This data highlights whether there’s a feed in the PMax campaign.
Impact of Audience Signals:
Impact of Search Themes:
PMax Structure:
In the interest of making it easier to understand each Pmax campaign type, we’re applying labels to them:
Starter Campaigns: one campaign/one asset group
Focused Campaigns: multiple campaigns/one asset group
Conversion Hungry Campaigns: one campaign/multiple asset groups
Mixed Campaigns: multiple campaigns/multiple asset groups
How Many Conversions Does PMax Need?
Number of Assets and Types of Assets:
*note there aren’t enough statistically significant amount of advertisers using hotel ads, but we wanted to share the data for those who do use that format.
Percentage of Spend Going To PMax:
What Are Most Advertisers Doing & Is It Profitable?
We organized the findings by major category.
PMax Structural Choices
Most advertisers (82%) in the study run Performance Max alongside other campaign types. The data shows PMax campaigns struggle when paired with other campaign types, which lends credibility to Google’s claims that other campaigns will take priority over PMax.
In addition, there is no clear majority on PMax structure. With that in mind, multiple campaigns with a single asset groups have the best ROAS, second highest conversion rate, and CPA. A single campaign with one asset group might win on CPA and conversion rate, but has the weakest ROAS.
A slight majority of advertisers (55%) don’t use feeds in their PMax campaigns, and see better conversion rates and CPAs, with weaker ROAS. One can infer accounts with feeds are ecommerce and using Max Conversion Value.
Most accounts meet the 60+ conversion threshold needed for success with PMax. Those who didn’t saw worse performance across the board (save CTR).
Pmax Strategy Choices
A slight majority (55%) use the Max Conversion Value bid strategy. 45% use thes Max Conversions bid strategy. Predictably, Max Conversion Value does better with ROAS, while Max Conversions does better with CPA and conversion rate. CPCs and CTR are slightly better for Max Conversion Value.
Surprisingly, the majority of advertisers don’t use exclusions (brand lists, negatives, topics, and placements). Most advertisers (58%) saw a slight improvement in performance when they had no exclusions, but it was ultimately flat. It’s worth noting almost no advertisers use the brand list exclusions (97%) and it was even flatter.
Ninety-two percent of advertisers use audience signals and their accounts struggled on all metrics, save for CTR and ROAS (which were essentially flat). This puts in question whether it’s worth the effort to add in audience signals and if the data seeding the signals can be trusted.
Seventy-one percent of advertisers use search themes and results are mixed, but mostly favor NOT using them.
Most marketers (57%) use all assets available (call to action, text, video, and image). They achieved ‘average’ performance across the board. Interestingly, the ‘best’ performance belonged to PMax campaigns using only text assets. However, this defeats the purpose of PMax, which is designed to help budget go where it can do the most good (visual content and text content). It also illustrates that our perception of ‘best’ is skewed by a search bias.
Perhaps the most surprising insight is how much budget advertisers allocate to PMax—51% of advertisers allocate more than 50% of their budget to this campaign type. Campaigns in these accounts have the strongest ROAS, however every other metric is mixed.
What Impact Do Other Campaigns Have on PMax?
I was not expecting other types of campaigns to ‘triumph’ over PMax campaigns in the same account: Many advertisers assume that PMax will cannibalize branded search and will get preferential treatment in the auction. However, the data seems to suggest that PMax almost always takes a backseat to siloed campaigns.
While the most common other campaign type (Search) had the most obvious wins over Pmax, Shopping had fairly impressive wins as well.
It’s worth noting that visual content (Video and Display) is fairly flat on ROAS, and Display is flat on CPA. This suggests that these campaigns are not as focused on conversion.
Percentage of Spend Going to PMax:
As I mentioned above, there are a surprising number of marketers putting more than 50% of their budgets towards PMax. While these marketers saw the strongest ROAS in their PMax campaigns (625.03%), there are also potential conversion rate and CPA advantages when keeping PMax limited to 10%–25% of the budget.
Does Human Bias Help or Hurt PMax Performance?
PMax’s core guiding logic is ‘profit without bias.’ However, this is also a source of friction for advertisers who are used to having near-complete control. Based on the data, it seems like adding exclusions hurts performance.
This could be for a few reasons:
Branded traffic is cheaper and has better conversion rates. That said, performance was fairly flat between brands that excluded branded terms and those that left them in.
The exclusions were too strict and caused performance issues due to missed placements.
While we can’t say that the exclusions were inherently a bad idea, they represent clear bias around what we think has value. Based on the data, there may be value in loosening exclusions, leaning into content safety settings instead.
The relatively flat performance between these differing tactics is interesting, but not conclusive.
How Do Creative & Targeting Choices Impact PMax?
There’s a common assumption that doing more work on a campaign should lead to better results. Taking the time to teach the algorithm what you value should lead to better results.
However, the data seems to contradict this assumption.
Impact of Audience Signals:
Impact of Search Themes:
As we can see, performance is flat (or worse) when Audience Signals and Search Themes are included. This seems to indicate that investing the effort on these tasks isn’t worth the ROI.
However, it’s also worth remembering PMax will take a back seat to siloed campaigns. Search Themes remain one of the most powerful ways to ‘mark’ traffic for PMax (over siloed campaigns). This is because Google prioritizes exact search terms going to exact match.
Brands should be intentional with audience signals and search themes, treating them as guidelines instead of hard targets.
With regard to creative, while the majority of advertisers lean into all assets, there seems to be a decided benefit to just including the assets you can reasonably support. There is no denying the text-only asset cohort skews the numbers for including one asset, however the correlation on ROAS supports not including creative just for the sake of it.
It’s also important to remember the wide ranges of CPAs reflect a wide range of industries, and there are some categories with statistically insignificant data.
Number of Assets and Types of Assets:
If there’s one ‘magic’ creative button for PMax, it’s video. While text-only had the best overall metrics, those are limited exclusively to Google Search. Video’s strength is that it keeps up with text while accounting for lack of focused transactional intent.
From these two datasets, you can see that it’s best not to mindlessly fill out all the fields. Be intentional about your targeting and creative choices, honoring the point of the ad channel you’re using to reach customers.
What Does a Healthy PMax Campaign Look Like?
Now that we’ve investigated what the majority of advertisers are doing, let’s look at some directional queues we can take from the data.
PMax Structure:
The metrics seem to favor running multiple campaigns with one asset group per campaign, allowing brands to utilize unique budgets and negatives. However, there are also CPA and conversion rate gains associated with one campaign-one asset group.
This inspired us to investigate whether the latter group were ecommerce advertisers building on the habit of Smart Shopping (which didn’t require as much segmentation). However, most marketers in this category didn’t attach a feed and had better results. So, there is something to the single campaign and asset group strategy.
These findings run counter to the data that we pulled last time and shows Google has significantly improved how it understands user queries. That said, if you can find the conversions, multiple campaigns with a single asset group are the way to go because they guarantee budget access for the parts of your business you care about.
We took some benchmarks on how most of the 9,199 accounts are structured and found the following averages:
3 PMax campaigns per account
4 asset groups per campaign
34 assets per asset group
We explored accounts that fell below and exceeded these numbers:
These figures are mostly impacted by the number of asset groups and assets. The data seems to indicate fewer and more thoughtful entities have a higher chance of success than loading up on all the assets and asset groups.
Finally, we couldn’t have a complete conversation about healthy campaigns without diving into conversion thresholds.
How Many Conversions Does PMax Need?
It shouldn’t surprise anyone that PMax needs more conversions to be useful, but what is surprising is how flat CTR is compared to conversion rate. I would have expected CTR to have more volatility at lower conversion rates, (due to Google trying to figure out which traffic is valuable).
This data supports the idea of limiting campaigns if you won’t be able to hit 60+ conversions in a 30-day period.
Tactics from the Data
As we stated previously, we’re not going to declare one path as correct or incorrect. However, based on the data, we feel confident sharing the tactics below:
Multiple asset groups in the same campaign don’t work as well as ad groups in a campaign because there aren’t asset group-level negatives. Depending on your budget and ability to meet conversion thresholds, you can decide to run a single PMax campaign with a single asset group or multiple campaigns with a single asset group.
Be careful about biases on where ads should serve and how many negatives to include. While some exclusions are necessary for brand safety, the data is clear that PMax needs fewer limitations on its learning. Consider using account-wide exclusions over campaign-level ones.
PMax is designed to work in concert with your other campaigns, and brands that rely solely on PMax (as well as brands that run Pmax on auto-pilot) will struggle to achieve sustainable results. Brands that use PMax as a testing ground for keyword concepts, placements, and other insights will get more out of this campaign type because they are allowing the bias-free traffic to add incremental gains.
Experts React
“It was super exciting to dive into research that explores such a dynamic and evolving campaign type as Performance Max (PMax). This study offers valuable insights that both confirm and challenge established PPC strategies.
One of the standout findings is the critical importance of conversion volume. The data reinforces the idea that achieving an optimal level of conversions is essential for campaign performance. This makes it a key consideration when planning or restructuring campaigns - ensuring enough conversion data is present to enable effective machine learning and optimization.
I also found the analysis of campaign and asset group configurations intriguing. While it would be useful to further explore how these configurations differ across ecommerce and lead generation accounts, the findings can serve as a solid foundation for further experimentation and optimization.
Moreover, the study challenges some widely accepted beliefs about audience signals and search themes. The findings suggest that adding more signals doesn’t always result in significant performance gains, which prompts a re-evaluation of the resources invested in these areas. This invites a fresh perspective on how we approach campaign management - focusing less on volume of inputs and more on the quality of core components like conversion data and asset structure.”
Julia Riml, Director of New Business, Peak Ace
“The most important finding to me (and further confirming what we already knew) is the importance of sufficient conversion volume which is important for machine learning to work to it’s full potential and which also guides our optimization steps.
The aspects I found most surprising were how many advertisers seem to be running PMAX as a standalone campaign (without search, video and display campaigns accompanying it) and that PMAX campaigns that didn’t utilize a feed (lead generation?) on average tend to perform better with regards to CVR and CPA.
Lastly, it shows the importance of diversifying your spend - the more you spend on PMAX in relation to other campaign types, the worse your CVR and CPA tend to be.
Super intriguing stuff and a must read for everyone working with Google Ads."
Boris Becceric, Google Ads Consultant, BorisBecceric.com
“I am a PMax skeptic, however this analysis presented me with a few surprises, in among what we already know to be true. It is not a surprise that PMax performs better with max conversion value and with more conversion data. However, I am surprised at the amount of advertisers spending the bulk of their budget on PMax, and at the impact (or lack thereof) of exclusions.
As with anything in the PPC world, it remains important to assess your individual business context. What metrics are most important to you? At the very least, I’d argue PMax now deserves to be tested by everyone who can accurately assess/import conversion value.”
Amalia Fowler, Owner, Good AF Consulting
“This Performance Max study provides valuable insights into the strengths and weaknesses of this Google campaign type. The most striking finding I noticed is that PMax often plays a secondary role compared to other campaign types like Search and Shopping, indicating that PMax does not always receive preferential treatment in the auction process.
The data suggests that multiple campaigns with a single asset group yield the best ROAS, and that limiting exclusions and avoiding the indiscriminate addition of assets are key to success. Despite the growing adoption of PMax, human bias can sometimes hinder performance by imposing too many restrictions. From my experience and knowledge I would highly recommend to make sure to test best practices and always be aware that it’s not a one-size fits all campaign type.”
Lars Maat, Owner, Maatwek Online
“One of my biggest takeaways from this study is that PMax seems to perform better when it’s targeted well and not used more broadly. For example, multiple campaigns with one asset group being one of the highest performers stood out to me. PMax learns at the campaign level so, perhaps these campaigns are more highly targeted allowing the campaign to learn exactly who to target. While the one PMax with multiple asset group set up more than likely has variation by product or service type meaning multiple types of customers need to be targeted. As mentioned, PMax lacks the ability to have asset group level exclusions or asset group level ROAS/CPA targets to help control for variations in users or goals. Additionally, that campaigns with fewer assets seemed to perform better suggests that more targeted creative is a better option than generic or broad assets.
Based on this study, with the data and signals that PMax has access to, it seems that focusing it on targeting one customer type with plenty of data can be a successful strategy. This would allow you to keep your creative narrow and use only very specific signals.
As always, this is another excellent thought provoking study into Google Ads from Optmyzr!”
Harrison Jack Hepp, Owner, Industrious Marketing LLC
“Another insightful case study by Optmyzr. Some of the results are consistent with the finding of the previous one on bid strategies - Max. Conv. and Max. Conv. value again deliver what is expected from them.
An important finding for me is the benchmark of 61 conversions, which can explain why sometimes single PMax campaigns can be the better option. Still, some of the results suggest that multiple campaigns with a single asset group are a great option too. For E-Commerce, I have a clear preference for Performance-Based-Bucketing and in my experience multiple campaigns deliver better performance than a single consolidated campaign.
The case study undoubtedly demonstrates that human bias can hurt performance. I was aware that Search themes have negative effects on other campaigns, but now I am surprised that they might be having them on PMax too. The most surprising results regard the use of Audience signals (associated with negative performance effects) and the efficiency of PMax for Lead Gen accounts. I am ready to adjust my strategy and leave out Search themes and Audience signals behind (probably except for Customer match and Remarketing lists) and give more chances to PMax for LeadGen.”
Georgi Zayakov, Senior Consultant Digital Advertising, Huttler Consult
“The fact that Performance Max (PMax)-only campaigns show higher ROAS doesn’t surprise me, as PMax often behaves like a bottom-of-funnel conversion campaign. When other campaigns, such as non-brand search, are run alongside PMax, I expect metrics like ROAS and CPA to be worse, since these campaigns target different stages of the funnel and often require more consideration from consumers.
One particularly interesting finding is the limited use of PMax alongside YouTube video campaigns. Despite the control YouTube offers, PMax seems to underutilize video, reinforcing its role as a bottom-of-funnel tool, however I would have expected the ROAS difference to be higher.
I’ve also found that standard shopping campaigns often conflict with PMax, so seeing higher ROAS in these cases is surprising—though I’d handle this on a case-by-case basis.
The study’s insight into a single asset group driving higher ROAS is fascinating. I typically run different creatives for seasonal campaigns or separate product lines with similar margins in their own asset groups under one Pmax campaign. However, this data suggests that brands can simplify their approach, running a multi-product photoshoot with a branded YouTube video and still see success. This significantly lowers the creative burden for advertisers.”
Sarah Stemen, Owner, Sarah Stemen LLC
“My team found this report immensely helpful and illuminating. We have heard conflicting things from Google on Search themes, for instance. It was helpful to confirm our suspicions that they don’t have much impact on PMax performance so we can invest our energy elsewhere. We are still pondering the study in general as to how it will practically impact the way we segment campaigns, but there are certain things we gained immediately from it. We always create Standard Shopping campaigns in accounts, even if they are PMax heavy, so it was encouraging to see this supported in the study and we have more confidence in the energy we invest in that effort now that we have read the study. I also was particularly intrigued by another study (similar to the one Mike Ryan and SMEC did awhile back) looking at conversion volume. Without a doubt now after these two studies, a significant amount of conversions are needed to increase confidence levels in PMax success. Overall, I found this study thought-provoking and practical, thanks Optmyzr team!”
Kirk Williams, Owner, Zato PPC Marketing
Final Takeaways
PMax’s evolution invites us to evaluate our previous strategies. Where exclusions and specific human control used to be key to success, we seem to be entering an era where we won’t have enough data to make those choices ourselves.
However, key business info (conversion value/efficacy, removing existing customers/users who won’t be a good fit, and creative) still require human involvement.
If you’re looking for ways to achieve better automation layering, Optmyzr can help! Between our tools to help with PMax search term analysis, budget allocation, and removing bad placements, there’s a whole world of innovations and optimizations to explore.
One of the most critical parts of advertising is choosing the right bidding strategy for your campaign. However, with so many conflicting viewpoints (usually data backed and/or voiced by experts), it can be hard to understand what the right strategy for your client(s) should be.
To that end, we wanted to examine two key questions:
Which bidding strategy performs best over the most accounts?
When advertisers use more than one bidding strategy, what percentage of ad spend goes to which strategy?
Methodology: Data Framework and Key Questions
First, let’s look at how this study is organized. We divided the data and questions into the following sub-questions:
Which is the best overall bidding strategy: Smart, Auto, or Manual bidding?
Do bidding strategy targets help improve campaign efficiency?
Do bid caps help improve campaign efficiency?
What are the real conversion thresholds for optimal performance?
Does spend influence the success of a bidding strategy?
What percentage of advertisers use more than one bidding strategy?
Does The Data Translate To Lead Gen & Ecommerce?
Criteria and Definitions
To answer these questions, we did a deep dive into the international Optmyzr customer base. This study looks at all Google bidding strategies (with some inferences applicable to Microsoft Ads) across 14,584 accounts. We applied the following criteria:
Accounts must be at least 90 days old.
Accounts had to have conversion tracking configured.
Accounts must spend at least $1,500 and could not spend more than $5 million per month.
Before we dive into the data, it’s important we clarify a few key terms:
Smart bidding — Bidding managed by an ad platform based on conversion data
Auto bidding — Bidding managed by an ad platform based on clicks or impressions
Manual bidding — Bid and bid adjustments managed by a human
1. Which Is the Best Overall Bidding Strategy: Smart, Auto, or Manual Bidding?
Before we go over observations and takeaways, it’s really important to understand that the data may point to a ‘winning’ strategy that may not work for you and your business. Always factor in your own business conditions before making bidding decisions.
We’ll first share with you the raw data, then we’ll share the ranking based on weighting the following metrics in descending order:
ROAS: 40%
CPA: 25%
CPC: 15%
Conversion Rate: 10%
CTR: 10%
Observations:
Max Conversion Values continues to beat Max Conversions with a significantly better ROAS, CPA, CPC. While conversion rate and CTR are slightly better for Max Conversions, Max Conversion Value wins where it matters (ROAS).
Max Clicks delivers acceptable performance and is an underutilized bidding strategy.
Manual CPC is not the outright winner in any category, but delivers strong performance. The caveat to this is it’s not as efficient for CPA, CTR, or conversion rate.
Target Impression Share’s metrics indicate top-of-page placement helps CTR and conversion rate, but won’t actually help with profit metrics (CPA, ROAS).
Takeaways:
There is no clear winner between Smart, Auto, and Manual bidding. All three types have strong and weak metrics.
Max Conversion Value is the most efficient Smart bidding strategy.
Maximize Clicks is the most efficient Auto bidding strategy.
Manual bidding has the third highest ROAS, but really struggles in other categories. As such, you should only use it when you can actively manage the bids (more on this in the tactics section).
There is room for testing as the stronger bidding strategies have less adoption than their weaker counterparts.
2. Do Bidding Strategy Targets Help Improve Campaign Efficiency?
With regard to targets, there are essentially two schools of thought: they’re either useful to help guide the algorithm or they represent risk due to human error.
Here’s what the data says:
Observations:
The majority of advertisers using Max Conversions do not set a target and see better performance on the most important KPIs like ROAS and CPA than those who do.
It’s a similar story for Max Conversion Value; advertisers who do not define a target see improved results for all metrics except ROAS which has a slight dip but is essentially flat. However, the majority of advertisers do set a goal.
There doesn’t appear to be a bidding strategy that significantly benefits from adding a goal, which is unfortunate because adding goals is tied to bid caps and floors. It’s unclear if this is due to human error or the nature of goals themselves.
This is where we get to see the real impact of eCPC (retiring March 2025). While conversion rates and CPA are great, the ROAS doesn’t meet expectations. However it is worth noting that eCPC beat Max Conversions
Takeaways:
Setting targets for bidding strategies has a higher likelihood of hurting accounts than helping them.
The only bidding strategies where targets appear to help are Manual bidding and Target ROAS. It seems reasonable to assume that if an advertiser is willing to take on the work of bid adjustments and accurate revenue/profit sharing, they will set accurate bidding goals.
3. Do Bid Caps Help Improve Campaign Efficiency?
One of the biggest reasons to opt into bidding goals is to access bid caps (and floors). A bid cap is the most you’re willing to let Google bid, while the floor forces Google to use a minimum bid for all auctions. You can access these settings through portfolio bidding strategies for Smart bidding and Max Clicks/Target Impression Share.
Observations:
Whether or not bid caps are used has no consistent impact on performance, which explains why most advertisers don’t use them. This also explains why some advertisers avoid bidding goals (given that bid cap access is one of the big benefits of goals).
ROAS-oriented bidding strategies seem to benefit the most from bid caps. CPA-oriented bidding strategies are mixed (decent ROAS, but weak CPA and CPC). CTR and conversion rates are strong but not strong enough to make up for almost double the CPA.
While Max Clicks appears to have mixed results with bid caps, Target Impression Share clearly needs them (note: there wasn’t a statistically significant sample size for non-bid cap Target Impression Share).
Takeaways:
Most advertisers don’t use bid caps. Whether this is a good or bad thing depends on the bidding strategy.
Bid caps are not inherently good or bad, however they do introduce the potential for human error.
Bid caps (and floors) only make sense to use if you also apply intelligent bid caps and floors.
4. What Are the Real Conversion Thresholds for Optimal Performance?
We’ve long since passed the ‘15 conversions in 30 days’ era of Smart bidding. Ad platforms recommend that we meet minimum thresholds to see success. However, we weren’t sure what the threshold actually is for different types of bidding strategies…enter the data!
Observations:
Most advertisers clear 50+ conversions in a 30-day period and see better performance compared to accounts with fewer conversions.
The jump from under 25 conversions to 25–50 conversions doesn’t always result in a performance improvement. This may explain why some advertisers don’t trust Smart bidding at lower conversion volumes.
Manual bidding also benefits from high conversion volume.
Max Conversion Value has a slight edge over Max Conversions at all conversion volumes, indicating that Google has an easier time working with conversion values than stand alone conversions.
Takeaways:
The threshold for any bidding strategy to be predictably successful is 50+ conversions.
Some success can happen at lower thresholds, but there’s more volatility.
Manual bidding also benefits from higher conversion volumes, so if your only reason for choosing manual bidding is your lack of conversion data, we recommend finding ways to increase conversion volume.
5. Does Spend Influence the Success of a Bidding Strategy?
One of the most common assumptions around Smart bidding is that it requires big budgets to be successful. We were curious if this held up across all bidding strategies.
We ranked the bidding strategies by their probability to achieve profitability at lower spend levels (using the same criteria as before) from highest to lowest:
Observations:
The only bidding strategy where performance consistently improves as spend increases is Manual bidding.
The sweet spot for Smart bidding appears to be $10K–$50K (focusing on ROAS and CPA). Conversion rate and CTR seem to favor higher spend, but those aren’t profit metrics, which might explain why some brands tank their campaigns with large budget shifts if/when they move to Auto or Smart bidding).
Most advertisers using Max Clicks are low budget accounts, which makes sense given the conventional wisdom that ad accounts need big budgets for conversion-based strategies.
Takeaways:
As long as you have the conversions, low spend shouldn’t get in the way of Smart bidding.
The only bidding strategy that seems to handle big changes to budgets consistently is manual. Every other bidding strategy does best with specific spend brackets.
6. What Percentage of Advertisers Use More than One Bidding Strategy?
An interesting finding that came out of the data is exactly how many advertisers use multiple bidding strategies in the same account.
Category
COUNT of accounts
% of accounts
Multiple bidding strategies
7,061
48.42%
Single bidding strategies
7,523
51.58%
Observations:
Most advertisers use the same bidding strategy throughout their account.
Those using multiple bidding strategies seem to have a ‘starter’ bidding strategy as campaigns ramp up, and then transition to others.
Those sticking with one bidding strategy seem to have ‘loyalty’ to one. They stick with the same bidding strategy regardless of performance fluctuations.
Takeaways:
Testing bidding strategies is healthy but it’s not mandatory for success. Clinging to one bidding strategy may be comfortable, but it’s not as risk averse as it seems.
7. Does The Data Translate To Lead Gen & Ecommerce?
There is no denying lead gen and ecommerce strategies are different. As such we wanted to share the data of how bidding strategies fared with each account type.
Observations:
Max Conversion Value continues to dominate in lead gen. While CTR and Conversion Rate are lower than ecommerce, all metrics beat out Max Conversions.
Ecommerce advertisers seem to struggle with Manual CPC and Max Conversion bidding. I find it odd how many ecommerce advertisers are using Max Conversions instead of Max Conversion Value.
While more ecommerce use Max Clicks, lead gen advertisers seem to do better with it. Manual CPC seems to be the safer “early stage” campaign bet (despite it being a weaker bidding strategy overall for ecommerce).
The most popular bidding strategy for the studied ecommerce cohort is Max Conversions. The most popular bidding strategy for the studied lead gen cohort is Maximize Conversion Value. This was a shocker, because
Some of the cheapest Lead Gen CPCs and strongest ROAS was with Max clicks and manual CPC.
Takeaways:
Lead Gen Max Conversion Value outperforms Max Conversions by almost 300% on ROAS. This supports advertisers using Max Conversion values regardless of whether they are lead gen or ecommerce.
Tactics from the Data
There are a lot of tactics that come out of the bidding strategy data, but the biggest one is not to fall into the trap of thinking that Smart or Auto or Manual are inherently better or worse than the other. It all comes down to execution and where your account is on the conversion volume/efficacy front. Many accounts use mixed bidding strategies, which speaks to the value of leveraging all the bidding strategies at each stage in the account.
As a general rule, Manual and Auto bidding are favorable in early stage accounts. This is because these bidding strategies aren’t reliant on conversions and represent learning opportunities around auction price. As an account ramps up, it’s reasonable to start testing Smart bidding (provided that you have at least 50 conversions in a 30 day period).
However, just because an account is low-budget doesn’t mean that it can’t see success with a Smart or Auto bidding strategy:
High-spend accounts ($100K+) didn’t always fare better than lower-spending accounts (i.e., less than $10K).
Maximize Conversions had a median conversion rate of 10.68% on low-spending accounts, while high-spending accounts had a conversion rate 7.01%.
While it’s true that the ROAS was slightly better (at 184% versus 175%) with higher spend, it doesn’t change the fact that the CPAs, CPCs, and click-through rates were better at less than $10K spend.
However, conversion thresholds still matter. There is no account that performed better at less than 25 conversions than those that had more than 50. In fact, even Manual bidding did demonstrably better on cost per acquisition, ROAS, click-through rate, CPC, and conversion rate when there were more conversions.
The big takeaway here is that just because your spend is low doesn’t mean you have to shy away from Smart bidding, but it does mean that you need to be honest about your conversion actions. In terms of which conversion actions you include, you can consider using micro conversions if you want to avail yourself of Smart bidding, but it’s really important that you actually put in the different conversion values for each action so that Google can get the data it needs to efficiently allocate your budget.
The other major optimization opportunity within the account is thinking about how you allocate your budget. Of all the bidding strategies, only Manual bidding had a linear correlation between budget size and bid performance. However, when you look at all the other bidding strategies, big spikes or decreases in budget did cause performance issues.
As a general rule, when you’re increasing or decreasing a budget in a Smart bidding campaign, you’ll want to make sure that you allocate somewhere between two to three weeks for that budget to settle.
In regards to bid caps and floors, as well as setting targets, I was surprised that targets seemed to hurt performance more than help it. And while I have my suspicions that human error (seting caps/goals that don’t align with the budget and targets) is part of the issue, there is no denying that applying a target represents risk.
If you’re going to use targets, which unlock the path to bid caps and floors (that can lead to performance improvements in certain cases), ensure that you apply the right targets (and bid caps and floors).
The first thing to consider is what a reasonable target for your campaign might be. So if you historically hit a $50 cost per acquisition or a 200X ROAS with no goal, it is reasonable to set a cost per acquisition goal of $45 to $55 not see any major change (i.e., you are keeping the goal +/-10% of the original performance). The moment you go beyond that 10%, you invite risk. And so the only reason to do this is if you know that the historical performance doesn’t reflect the actual results you are seeing.
For example, if you know that your conversion tracking isn’t set correctly, or if you don’t trust your data, you can play a little bit faster and looser with the settings, because the information that’s currently fed to Google isn’t accurate. And as a reminder, you may decide that you want to exclude certain data that you know you don’t trust.
When it comes to bid caps and floors, I have always endorsed keeping bids to 10% (or less) of your daily budget, so you can fit at least 10 clicks per day.
If you choose to go beyond that 10%, there’s a very real chance that you will not get enough clicks per day, and Google will either under serve your budget, or your bid floors will be too low, you’ll over serve in the wrong auctions, and you will have misguided your budget.
When setting up your bid floors and caps, be mindful that you’re doing so as corrections, not as a control lever. If you see that your impression share is historically lost due to rank, you may decide that you want to set a higher bid floor (while not including a cap) to force Google to invest your budget in the way that will serve you.
If you’re struggling on quality, you may decide that you want your bid cap to be 10% or even 15% of your daily budget, but acknowledge that you’ll get fewer clicks per day. So, you just have to account for that in your conversion rates. It’s really critical that you’re honest about the quality of your leads and what those bid caps and floors can do for them, as well as making sure that your targets are reasonable based on your historical performance.
Experts React
“This study challenges many misconceptions about Google Ads, which is thrilling! Seeing that campaigns using Target CPA achieve the lowest CPA of all bid strategies, and that campaigns using Target ROAS achieve the highest ROAS of all bid strategies, confirms the effectiveness of target-based Smart Bidding.
The most important takeaway from this study for me, however, is that budget is not the most important factor in Smart Bidding success; conversion volume and values are. Increasing your budget does not mean you’ll achieve better efficiency, but increasing your conversion volume is correlated to better results for every single bid strategy studied.
Going forward, I will continue recommending that my clients implement micro-conversions if they don’t have sufficient conversion volume, and continue recommending using conversion values even for non-ecommerce businesses.“
Jyll Saskin Gales, Founder and Coach, Jyll.ca
“My question as I read through all the data was - what percentage of the accounts reviewed were e-commerce? I’d love to see how the data shakes out across these categories for e-commerce and lead generation.
But even without that split being shown, seeing that accounts really do need 50+ conversions is validating! As someone who often works on accounts with low (fewer than 50 per month) conversions, I have long believed that those conversion levels were a hinderance and seeing it confirmed in a large data set is helpful.
It is also nice to see that manual bidding does have a place in these automated times! The data about using conversion values and not just bidding toward conversion generally was also very interesting. I think we can sum up where things are continuing to go by saying Google wants more information from advertisers (conversion values being one data point) so that it can add that to their system data to try to increase campaign performance.
Also nice to see that adjusting your budgets with some of the auto or smart strategies can cause volatility. Again, many of us see things in the accounts we work on and hear about it from friends and their accounts, but seeing a large data set reporting that it is widespread is also very helpful in setting expectations - both ours and for our clients.”
Julie Friedman Bacchini, Founder of PPC Chat/President and Founder of Neptune Moon
“One of my first takeaways is that max clicks performs at a similar if not better level than max conversion. As was noted, maximize clicks is really an underutilized bidding strategy as users try to jump straight into smart bidding using maximize conversions. I’ve found that using maximize clicks with appropriate bid adjustments can actually be a winning strategy for some accounts.
I wasn’t surprised to see that the key component in bidding strategies continues to be conversions and conversion volume, however. This remains one of the biggest challenges for smaller advertisers and even manual CPC or auto bidding doesn’t entirely overcome the challenge. The importance of micro conversions only continues to grow for marketers who work with lower conversion volumes.
I’ll also admit that this study challenges my view on maximize conversion value as a bidding strategy. I’ve always thought that maximize conversions was a better bidding strategy and have often only used conversion value bidding if I can set a target ROAS with it. This serves as a good reminder to test your assumptions or at least avoid writing strategies off without due consideration!”
Harrison Jack Hepp, Founder of Industrious Marketing LLC
“Some big surprises here at first glance, but things are never simple. As the saying goes in the SEO community: “It depends,” and that holds true here as well. Take, for example, setting up targets and bid caps. The data shows that these strategies aren’t always beneficial. Does this mean we’ll change our advice to clients? Likely not. It may seem surprising until we consider who sets those numbers and based on what data. We’d still argue that in many cases, setting a CPA target while also establishing bid caps and floors is a balanced strategy—assuming the data is reliable.
In essence, the study confirms what we universally know: better data equals better performance. Unfortunately, not everyone understands what “better data” really means or how to achieve it. That’s where the complexity comes in, especially with increased focus on privacy. We’ve already been developing strategies to improve the data quality and the study confirms the need. Strategies such as server-side tracking which in testing is showing 18% uplift in main conversion event relative to client-side. This is all data that helps us and the system make informed decisions that manage risks. But again, it only works if the setup and measurement framework are solid from the start. That’s the difference between stunting your account’s performance and letting Google do as Google wants.”
Emina Demiri-Watson, Head of Digital Marketing, Vixen Digital
“This study provides really valuable insights into Google Ads bidding strategies. One surprising finding was the high usage of ‘Maximize Conversions’, despite its relatively low ROAS and high CPA. I understand that the accounts are using multiple bid strategies and the bigger picture is important but I found this interesting non-the less. As a proponent of Maximize Clicks, I’m pleased to see its performance validated. This bid strategy is particularly suitable for smaller businesses or those seeking a less hands-on approach. I recommend max clicks for alot of my b to b clients when there isn’t much competition and when the terms that are searched are straightforward. This data point is helpful to that cause.
The study also highlights the importance of conversion volume for manual bidding. This aligns with the traditional “rule of 100s,” where bids were adjusted based on performance metrics (100 clicks or more with no conversions lower the bid, or if a keyword spends $100 or more with no conversions lower the bid). While this is an old school way of doing manual bidding, we still relied on data to make the decision before smart bidding. Seeing this data shows that 15 years ago we weren’t as far from the mechanics as we thought.”
Sarah Stemen, Founder of Sarah Stemen LLC
“I always enjoy it when I get my hands on Google Ads studies that look at big data sets.This one about bid strategies provided great insights. Among the things I found confirmed from my own analysis are the importance of conversion volume as the basis of any bid strategy and that maximize clicks still has its place. It can perform the same or even better in certain scenarios.
What surprised me, as a proponent of bid floors and bid caps, was the section about bid caps not having a consistent impact on performance. Guess that goes to show that, as the saying goes, it depends.
I was pleasantly surprised by manual CPC and the way it performs, but only when you actively manage the bids - but this always used to be the case and us “old schoolers” are used to it being that way.”
Boris Beceric, Founder and Coach, BorisBeceric.com
“I’m pleased to see that, as of today, there is still no universally superior bidding strategy; performance varies based on execution, conversion volume, and account specifics. When you have 50+ conversions, Smart Bidding is often the best approach, and this aligns with my observations.
A key takeaway for me is the quality of data we provide to Google. Different bidding strategies require different data inputs. It’s crucial to include micro-conversions when they are relevant, and the bid strategy must align with this data. When aiming to drive high-value deals, both the data quality and campaign setup are critical.”
Andrea Cruz, Sr Director, Client Partner Tinuiti
Final Takeaways
Bidding strategies should be evaluated based on the goals for the campaign and resources available. There is no concrete answer on which bidding type (Smart, Manual, or Auto) is better, however there are signals advertisers can follow for the best one for their campaign.
Just because you’re using Smart or Auto bidding doesn’t mean you lack control. If you’re interested in layering automation into your workflow and getting the most out of your budget, Optmyzr has several tools to help you on the path to profit and victory.
If you’re not an Optmyzr customer already, you can sign up for a full functionality trial here.
Great ad copy is critical for Google Ads success. However, it can be tough to understand which rules of engagement work best in today’s PPC landscape.
While there are many perspectives on the best way to optimize ads (and each method has its own place), few are backed by statistically significant data.
At Optmyzr, we have access to that data, so we asked our analysts to look for trends in ad optimization strategies that drive meaningful performance improvements.
We believe it’s important to share this data—not to amplify or discourage any specific strategy, but to inform you about what each creative choice can mean for your account. Ultimately there is no right or wrong answer, just higher or lower probability for success.
Let’s take a look at the data so that you can better contextualize which ad optimizations might yield the best ROI for your campaigns.
Methodology: Data Framework and Key Questions
Keep in mind the context below as you review our study and takeaways.
About the data:
We reviewed over 22K accounts that had been running at least 90 days with a monthly spend of at least $1500.
We reviewed over one million ads across responsive search ads (RSAs), expanded text ads (ETAs), and Demand Gen. However, API limitations prevented us from pulling asset-level data for Performance Max campaigns.
For monetary stats, we converted currencies to USD and used those to find the average CPAs and CPCs.
Here are the questions we aimed to answer:
Is there a correlation between Ad Strength and performance?
How does pinning impact performance?
Do ads written in title case or sentence case perform better?
How does the length of the creative (character count) affect performance?
Do ETA tactics translate to RSAs and Demand Gen ads?
When evaluating our results, it’s important to remember that Optmyzr customers (the data set) represent advanced marketers. As such, there may be a selection bias that could result in more data on successful strategies. It’s possible that results could vary when evaluating a wider advertiser pool with a more varied range of experience.
Ad Creative Choices Data & Analysis
In the sections below, we’ve included raw figures, observations, and takeaways to help you better understand the degree to which various ad optimizations influence performance.
Is there a correlation between Ad Strength and performance?
While Google has made it very clear that Ad Strength is not a ranking factor and meant to be a helpful guide, practitioners tend to have mixed to negative sentiment towards it because it gets conflicting attention from Google and doesn’t seem to be useful in managing creative.
“A higher Ad Strength doesn’t mean a better CTR or a better conversion rate or a better Quality Score. If you’re new to advertising or don’t know what’s going to work, consider this a piece of advice.
But if you’re an experienced advertiser, go ahead and do what you do best. Create the ad that resonates well with your target audience and keep the focus on performance. Don’t just be blinded by the Ad Strength.”
Does the data back him up? Below (and for all the tables in this study), we’ve listed the rows of data in order of descending performance (i.e., the first row is the highest-performing group, while the last row is the lowest-performing):
Responsive Search Ads (RSAs):
Demand Gen Ads:
Observations:
RSAs with an ‘average’ Ad Strength have the best CPA, conversion rate, and ROAS.
Other than ROAS, Demand Gen ads with an ‘average’ Ad Strength performed the best.
There is no meaningful difference in CTR for ads with different Ad Strength labels, which indicates that Ad Strength either doesn’t factor it in, or likely could never be a ranking factor. This is of note because Quality Score (which is a factor in the auction/Ad Rank) does have a clear relationship with CTR. We include this point because many were suspicious of Google using Ad Strength as a ranking factor.
For RSAs, ROAS appears to decline sharply when going from ‘average’ to ‘good’ Ad Strength. While the transition from ‘good’ to ‘excellent’ shows a slight increase, it doesn’t come close to the disparity between ‘poor’ or ‘average’. This may be influenced by the ‘human’ factor (the majority of advertisers favor max conversions and simple conversion values, according to our bidding strategy study [10,635 use Max Conversions vs 7916 Max Conversion Value]).
Demand Gen’s metrics make a stronger case for paying attention to Ad Strength due to clear ROAS win in the ‘good’ category, however the decline associated with ‘excellent’ Ad Strength still makes it a dubious optimization guide at best.
The conversion rates for Demand Gen ads are very similar to those of RSAs. This is surprising, considering Demand Gen ads drive awareness whereas RSAs are traditionally focus on driving transactions.
Takeaways:
There is no clear correlation between ad performance and Ad Strength. Ad Strength is not a metric to sweat over.
The majority of ads have an Ad Strength label of ‘poor’ or ‘average’, but perform well on typical advertising KPIs.
Ads with ad strength labels of ‘good’ or ‘excellent’ have mixed performance on typical advertising KPIs.
How does pinning impact performance?
Pinning refers to designating an asset to a particular position in the ad (Headline 1, Headline 2, or Headline 3). Pinning came about with the rise of Responsive Search Ads.
Some preach pinning everything to force ETAs (meaning there would only be three headlines and each would be pinned to their respective spot), while others prefer to abstain from pinning. Those who abstain from pinning lean into RSA’s built in testing. Check out the “Experts React” section for specific reasons why some pin or don’t.
Here’s the data on pinning (including the performance from ETAs for easy comparison—note that ETAs are a retired ad type and cannot be edited):
RSAs:
ETAs:
(We’ll revisit this table when we discuss creative length.)
Observations:
Some pinning continues to be the winning strategy based on CPA (though no pinning is a close second), ROAS, and CPC. Conversion rates suffer when you pin.
Ads where every element is pinned have the best performance for the relevance metric: CTR.
Ads with some or no elements pinned have the best performance for conversion or cost-based metrics, like CPA, ROAS, CPC, and conversion rate.
While CTR is technically a win for pinning, the CTRs are very close, so it’s hard to say pinning is truly responsible.
In most cases, RSAs outperform ETAs (even in ads with all pinned assets). However ETAs with 31+ characters (indicating DKI/ad customizer usage) performed so well that it comes across as outlier data.
Takeaways:
Advertisers who attempt to recapture the ETAs days are setting themselves up for worse conversion-based performance.
Pinning some assets has a positive impact on ad performance, but it’s essentially flat compared to pinning no assets (ROAS is the only exception). As such, pinning should be a creative/brand choice—not a concrete Google Ads tactic.
Most advertisers would benefit from fully migrating to RSAs (which allow for pinning).
Do ads written in title case or sentence case perform better?
The ‘title case vs. sentence case’ debate is probably one of the firecest debates, so we were curious how this stylistic choice impacted ad performance.
For your reference, here’s a text example with each respective formatting:
Title case:This Is a Title Case Sentence
Sentence case: This is a sentence case sentence
We’ve grouped the accounts based on the percentage of an account’s ad text elements that use title case. So for example, accounts in the row marked ‘0%’ use no title casing at all. 0% should be understood as pure sentence case structure, while 75-100% should be understood as pure title case.
RSAs:
ETAs:
Demand Gen:
Observations:
The biggest observation is the number of advertisers who mix title and sentence case in the same ads and accounts. This runs counter to the historical norm that advertisers tend to pick one and stick with it.
ROAS seems to favor sentence case, but most advertisers tend to use title case.
There is no hard-and-fast rule for all ad types. RSAs and Demand Gen ads appear to do better with sentence case, while ETAs seem to do better with title case.
Takeaways:
As RSA and Demand Gen ads using sentence case performed best on all primary advertising KPIs, we recommend all advertisers include ads with sentence case in their testing.
One possible reason why ads using sentence case perform well is that they are the same format typically found in organic results, which are usually perceived as higher quality by users.
Do not turn off ETAs that perform well, as they have the potential to outperform RSAs (though most won’t) and you won’t be able to re-enable them again later.
Title case seems to be a habit from ETAs, but in most cases, advertisers do better with sentence case.
How does the length of the creative (i.e., character count) affect performance?
Ad copy is a kind of haiku—you need to convey clear and enticing meaning in very few characters. Yet there’s more nuance to consider: is bigger better?
(Example SERP with three RSAs—each with some creative cut off or moved to a different spot.)
Google has made a habit of truncating creative for years, and it’s no surprise that headline creative gets more viewership and impacts performance to a larger degree than the description. However, since underperforming headlines can appear in descriptions (instead of being in position #2), there’s an even greater pressure to get the balance right.
Headlines appear to benefit from concision, while descriptions appear to benefit from some length (but not too long).
In most cases, DKI/ad customizers don’t dramatically improve or hurt performance. We should assume that all ads in a “+” category are using DKI or customizers as that’s the only way they’d be able to exceed the character count.
RSA and ETA performance trends do not line up perfectly, and those trying to apply ETA tactics to RSAs see declines in almost all metrics (potentially due to how Google combines lines of ad text to render long headlines).
CPC fluctuation implies that asset length isn’t as important as other factors, like the Quality Score and Ad Rank of the ads. If there was a clear correlation, one could infer Google’s character count preferences.
Takeaways:
The historical trend of longer ads being better isn’t playing out in today’s ad types. Quality over quantity seems to be the path to better CTR, conversion rates, and ROAS. Focus on including a strong and compelling message in your ad, rather than attempting to max out the character count.
Ad Optimizations That Boost Performance
Now that we’ve reviewed the data, let’s talk about the tactics you should adopt and the ones that no longer make sense.
For me, the biggest insight related to our findings about mixing sentence and title case: I didn’t expect the CTRs and conversion rates would be so similar. While sentence case ‘won’ for RSAs, performance was close. As such, only test sentence case in ads that are underperforming (as opposed to changing existing successful ads to sentence case).
Another big takeaway is that pinning should not be done for complete control. Instead, marketers should focus on securing creative in intended spots (i.e., not having a headline drop to the description). Leave some room for Google to decide where to place the creative.
Regarding Ad Strength as an indicator, seeing as how it does not correlate with performance, it doesn’t make sense to build Ad Strength into audits or sales tools. However, it is a useful filter to find ads whose creative may not be high enough quality to generate a meaningful number of impressions. We did see a strong correlation between shorter and brand-agnostic creative and higher ad strength.
Experts React
“A couple things stood out to me right away. The first is how little the CTR was impacted across the variety of ad types and strategies. Most of the changes studied saw no more than a 0.5-1% change across the CTR. Secondly, it appears that many marketers, myself included, haven’t completely adjusted to RSAs despite them being the primary ad type for over a year now. RSAs perform in a completely different way than ETAs regardless of how you format them. Rather than trying to replicate ETAs or using old best practices, advertisers need to lean into RSAs and determine how to make them work best for their accounts.
I think all of this highlights the case that many of us who have been practicing Google Ads for a long time need to revisit our habits. Google Ads continues to change at an accelerating pace and we need to lean into making it work for us now and not hold onto old tactics.”
Harrison Jack Hepp, Google Ads Consultant, Industrious Marketing
“As the “Chief Strategist” of a digital marketing agency, I’ve always prioritized strategies that maximize performance, often relying on data-driven decisions over Google’s recommendations. This study reinforces that approach, especially regarding Ad Strength and pinning. The data confirms that Ad Strength doesn’t reliably predict ad performance, so experienced advertisers should focus on crafting ads that resonate with their audience rather than chasing high Ad Strength ratings. While Google offers pinning as a tool, the findings suggest that allowing some flexibility for Google’s AI can yield better results than over-pinning and that using pinning selectively is not as harmful as I may have previously thought. However, the most surprising insight is the impact of creative length. Contrary to my belief in maximizing ad real estate (which I also push when it comes to Meta Data on the SEO side of things), the data suggests that concise, impactful messaging can outperform longer ads. This challenges the notion that more is always better and highlights the importance of quality over quantity in ad copy. Based on this study, I will push our teams to test creative length more rigorously.”
Danny Gavin, Chief Strategist and Founder, Optidge
“This study highlights the importance of humans using Google Ads. As experts, we analyze Google’s documentation, PR statements, and real-world advertiser performance to offer guidance.
While ‘Excellent’ ads have higher click-through rates (CTRs), this study confirms that ad strength can mislead advertisers into prioritizing clicks over conversions. ‘Average’ ads actually have higher return on ad spend (ROAS), suggesting that aligning ads closely with keywords (to get an ‘Excellent’) can lead to more clicks but not necessarily more sales.
I was also intrigued by the impact of pinning. Historically, I’ve avoided using pinning and relied on RSA automation. This data demonstrates that human intervention and knowledge can produce better results. In light of this, I’ll consider incorporating pinning into my strategies.
Lastly, as a proponent of title case, the study’s findings on title case versus sentence case were surprising. While many ad experts stick to one format, the study suggests that staying updated with case studies is crucial. In today’s environment, where individual accounts may lack sufficient volume for testing, tools like Optmyzr are more essential for providing data-driven insights and challenging the status quo.” -
Sarah Stemen, Owner and Coach, Sarah Stemen, LLC
“This is a good reminder of how dynamic best practices really are. Just a few years ago, filling up all the character space in an ad was a great way to give your ad more real estate. With RSAs, using every available character can actually backfire, since it can keep H3 from serving.
Writing Google Ads can be really overwhelming. Knowing what correlates with better performance and what doesn’t (ahem…Ad Strength) offers valuable benchmarks. These insights allow you to move past internal tests for things like capitalization and pinning, and instead focus on the qualitative aspect—developing stronger, more substantive messaging that attracts buyers.”
Amy Hebdon, Founder, Paid Search Magic
“This study is FASCINATING!
The things that stood out to me were pinning, sentence case and length of assets.
First, pinning - I am happy to see that pinning is not completely penalized. There are very legitimate reasons an advertiser might want or need to pin assets. Could be compliance or could be that their brand standard demand certain things must appear in advertising. I am glad that is not an automatic performance killer. It makes sense that selective pinning does well and full pinning does less well.
The title versus sentence case data was also really interesting! For those of us who have been doing this for a long time, title case is really ingrained in our heads for headlines. It almost feels blasphemous to use sentence case for headline assets. But the data, I think, is starting to show us that Google is viewing ad components/assets differently.
Which leads me to my thoughts on the length of assets. Again, those practitioners who have been doing Google Ads for 10+ years, our mantra has always been use all the characters! We strove to have long descriptions and use all those title characters pretty much every time. But the data is showing us that the system prefers shorter (not maxed out) assets. And I can’t help but wonder if this is hinting on Google Ads not distinguishing so much between title and description assets in the future. They have already started by sometime using titles in description areas. I think this is where it is eventually going.
All that to say, we probably need to adjust our thinking about today’s ad assets and test different lengths and case structures if you don’t have variety in your current ads. Look forward to more studies illuminating other aspects of Google Ads!”
Julie Friedman Bacchini, Founder of PPC Chat/President and Founder of Neptune Moon
“What I found most compelling from Optmyzr’s latest study is that ads resembling organic content outperform those that employ typical best practices for Responsive Search Ads. For example, Google’s own research from a few years ago found that Title Case outperforms Sentence case for RSA headlines and descriptions, but Optmyzr’s new study shows that the more “natural” Sentence case text is associated with better ROAS, CPA and CTR in 2024.
Similarly, practitioners have typically tried to maximize real estate by using all available characters, but this study shows that shorter headlines and descriptions generally have better CPA and CTR than longer ones.
I look forward to testing these new findings with my clients. As organic-feeling social media ads have taken over platforms like TikTok and Meta, it’s interesting to see a potentially similar shift coming to Google Ads.”
I’ve long said that focusing on ad strength too much is detrimental for performance and I’m glad to have this confirmed.
What’s really important is understanding the restrictions you have in your account (available impressions per ad group) and tailoring your RSA to that, plus the ability to communicate the message effectively and speak to the user in a way that resonates with them.
Best practices are but that - the average of things that typically work."
Boris Beceric, Founder and Coach, BorisBeceric.com
“Referring back to Fred’s advice, the single most important tip is to write ad copy that addresses your user’s or buyer’s concerns—it’s basic marketing 101. That said, the more you can customize each input, the better the performance will be. With increased AI search integration, expect Google to improve its ability to create a personalized search experience based on a multitude of signals.
Additionally, don’t forget the basics: dynamic countdown clocks for promotions, ad customizers that mention names of stores or service locations, dynamic keyword insertion (DKI), and using ad-level UTM parameters to trigger landing page content aligned with the keyword or ad theme will all contribute to better CTR and CVR.”
Andrea Cruz, Sr Director, Client Partner at Tiniuti
Final Takeaways
Ad Strength is not a major metric, nor has it proven to be a reliable predictor of ad copy performance. The most useful signals seem to be the formatting of the ad (title vs. sentence case), as well as length of the copy. Don’t fall into old creative habits—honor the new rules of engagement and, if you need help managing profitable ad tests, Optmyzr has a free trial with your name on it.
During GML 2024, Google shared a really interesting stat: raising your OptiScore 10 points leads to a 15% conversion rate improvement.
This stat raised eyebrows for a few reasons:
Advertisers can raise OptiScore by dismissing Google’s recommendations, which can be considered a loophole in the system.
Maintaining a minimum OptiScore is required for partner status, which doesn’t always align with business and marketing goals.
OptiScore tends to be conflated with account recommendations, which seem like a sales tool.
For your reference, here’s Google’s OptiScore support documentation:
Optimization score is an estimate of how well your Google Ads account is set to perform. Scores run from 0-100%, with 100% meaning that your account can perform at its full potential.
Along with the score, you’ll see a list of recommendations that can help you optimize each campaign. Each recommendation shows how much your optimization score will be impacted (in percentages) when you apply that recommendation.
Note: Optimization score is available at the Campaign, Account, and Manager Account levels. Optimization score is shown for active Search, Display, Video Action, App, Performance Max, Demand Gen, and Shopping campaigns only.”
— Google support documentation
With that in mind, we decided to explore the following questions:
Is there a performance difference in accounts with 70+ OptiScores (compared to sub-70)?
Are most advertisers achieving high OptiScores by accepting Google’s recommendations (and do they see better results than advertisers who reject them)?
Does spend play a role in OptiScore?
For this study, we looked at 17,380 Google Ads accounts that met the following criteria:
Running at least 90 days
Spending at least $500 per month
Maximum spend $1M per month
Global accounts that could be in ecommerce or lead gen.
The Data
We’ll review each major question in detail, but here’s a quick summary of the findings:
32% of accounts have sub-70 OptiScores.
19% of accounts achieved an Optiscore of 90+ without accepting Google recommendations.
5.5% (less than 1000 accounts) accepted Google recommendations, however the best performance belongs to the 333 accounts that accepted Google suggestions and have a 90-100 OptiScore.
Spend doesn’t really impact OptiScore—there’s too much fluctuation in the spends to point to any correlation or causation.
There is a correlation between higher OptiScores (80+) and improved CPA, conversion rate (though sub-70 did ‘win’ this category), and ROAS. There is no correlation between CPC and CTR.
Q1: Is there any performance difference between accounts with high/low OptiScores?
A big reason we wanted to explore the difference in OptiScore brackets is to see if it can be used as a health indicator in accounts. Here is the raw data:
As you can see, there is a clear correlation between high OptiScores and strong performance on all metrics (save for CTR). However, there are a few caveats:
Sub-70 OptiScore accounts won on conversion rate and nearly won on CTR.
ROAS is pretty flat between OptiScores of 70–90.
CPCs fluctuate (although lower OptiScores do correlate with higher CPCs).
Accounts in the 90-100 OptiScore range:
Beat accounts with a sub-70 score on ROAS by 186%.
Had the cheapest overall CPAs (despite not having the cheapest CPCs or best conversion rates).
Had the lowest CTR, which speaks to the value of PMax and visual content being part of the marketing mix.
Regarding Google’s claim on conversion rates being tied to OptiScore improvements:
This holds true for those going from 70 to a higher tier.
This does not hold true for advertisers going from sub-70 to 70+.
CPA and ROAS still win the day as you increase your OptiScore.
Q2: Are most advertisers achieving high OptiScores by accepting Google’s recommendations?
There’s strong skepticism around Google’s OptiScore metric. While our data shows there is a strong performance gain when an account achieves a better OptiScore, there remains the question of how the score is achieved. So ahead of this study, we ran an anecdotal poll and found that the majority of advertisers reject recommendations to raise their score (or outright ignore the metric).
Here’s the raw data:
While the vast majority of accounts (95%) do not accept Google suggestions, it’s worth acknowledging that the accounts with the best performance did accept Google recommendations and have an OptiScore of 90+. The data suggests that advertisers may have raised their scores by rejecting suggestions, however that didn’t always lead to the best results.
A few notes:
The suggestions varied across accounts, however the most common accepted suggestions revolved around hygiene fixes (e.g., conflicting negatives, missing assets, other clean up alerts).
Accounts that rejected suggestions may have still done the suggested action, but at a different time.
The main takeaway here is that you shouldn’t dismiss Google suggestions out of hand. An additional takeaway is that advertisers who are active in their accounts tend to see higher OptiScores, which does seem to correlate with improved performance.
Q3: Does ad spend play a role In OptiScore?
There has been a bit of skepticism around Google and how much spend plays a role in ‘favorable treatment’. While this wasn’t directly asked by the community, we thought it would be interesting to see whether spend impacts OptiScore. Here’s the raw data:
Spend is flat between the OptiScore brackets, and there’s no obvious correlation between spend levels and OptiScore.
While one could argue that jumping from sub-70 to 70–80 does add cost, the cost fades away in the upper brackets. This bracket had the best CTR, so it’s possible the increased spend is tied to advertisers doing a great job writing compelling ads that couldn’t capture conversions (either due to user experience or privacy).
Strategies for Leveraging OptiScore
Now that we’ve explored the data…what do we do with it? Should OptiScore be the new quality score?
No, but we also shouldn’t dismiss it. While Optiscore will not impact how you enter the auction, the data is undeniable that it can serve as a useful health indicator of where to work in accounts. While sub-70 accounts can see success, the strongest performance is in the 90+ bracket.
Don’t make it a goal to raise your OptiScore, which can be done through rejecting suggestions. Instead, focus on improving your account (with guidance from OptiScore). As Ginny Marvin, Google’s ads liaison shared:
The recommendations that surface with OptiScore refresh in real time and are based on your performance history and both inferred and expressed campaign goals (e.g., your bid strategy) as well as broader trends and market data. I tend to see two misperceptions about OptiDcore that keep advertisers from utilizing it effectively.
The first misperception is that OptiScore has a direct impact on performance. As with other diagnostic tools in Google Ads, such as Ad Strength and Quality score, OptiScore has no influence on the auction. On the other end of the spectrum is the second misperception that it’s simply a vanity metric that doesn’t reflect meaningful insights. OptiScore reflects how well your account and active campaigns are set up to perform.
While not all recommendations may be relevant (you know your business best), we continue to see that, on average, higher OptiScores correlate to better advertiser outcomes. Understanding what your OptiScore reflects, and reviewing the recommendations with an eye toward your goals, can help you surface new opportunities and prioritize where to focus your optimization efforts.
If you’re an Optmyzr customer, you can find OptiScore highlighted in Audits. Now that we know there is a positive correlation between OptiScore and account performance, we will begin looking at expanding its utility in Optmyzr’s suite of tools.
If you’re not an Optmyzr customer, the best way to leverage OptiScore is to use it as a focusing tool, as well as a weighting system to prioritize which optimizations/tests to perform.
Thoughts From PPC Experts
We asked PPC experts to weigh in on the data with their honest takes. The responses were mixed.
Pleasantly Surprised
I was pleasantly surprised to see a correlation between higher OptiScore and better campaign results (lower CPA/higher ROAS). I was more surprised to see even better results for those that accept rather than dismiss Google’s recommendations.
None of us, not even Google, would conclude that higher OptiScore is the cause of better results - though we all owe Googlers an apology for how much we’ve mocked their OptiScore stats over the years! I think the true cause for both higher scores and better results is a) actively managing and ’looking after’ an account, and b) being open to considering new ideas and opportunities.
Most experts are quite critical of Google’s recommendations, especially when it comes to OptiScore (myself included). However, I am also willing to eat my words when proven wrong. I was quite surprised by the clear correlation between OptiScore & ROAS, CPA & CVR (and yes, I did my own analysis).
I’ve always maintained that not all recommendations are useless and that you should judge them by their usefulness for your accounts. I guess now it’s time to go back to my accounts and see what else can be implemented.
The results were very interesting to me, as a member of camp ‘reject most suggestions.’ I imagine that the level of expertise of the account manager plays a role, sometimes what Google suggests is an action I was already going to take. I’d recommend that nobody blindly dismisses or accepts recommendations and instead considers them carefully, as you are the only one with context. I also believe ecommerce clients should pay particular attention to the ROAS results of this study!
Google isn’t inside the accounts but I know I’ll be more carefully considering their suggestions going forward and I believe the season of ‘blindly dismiss’ (if that’s been your MO) being the default has come to an end.
— Amalia Fowler, Owner, Good AF Consulting
I worked at Google on the Google Optimization project and have seen firsthand how some recommendations from the system can be highly relevant. For instance, addressing conflicting keywords, fixing conversion tracking issues, and implementing enhanced conversions are all critical for improving campaign performance. Additionally, adjusting ROAS targets or increasing target CPA during peak auction times can also bring better results.
This data reassures me that recommendations correlate positively with performance. However, I still believe that certain areas, such as adding new keywords or changing match types to broad match, require further improvement. Overall, the study’s outcomes are pleasantly surprising and validate the use of some of Google’s optimization suggestions.
— Thomas Eccel, Senior Performance Marketing Manager, Jung von Matt Impact
Skeptical or Indifferent
The Optmyzr study highlights benefits to Google’s OptiScore and suggestions, (which is seen especially in the 90–100 range), with a better CPA and ROAS compared to the lower OptiScore brackets.
This study supports what I tend to believe and it is great to have the data to prove that some recommendations directly found in the Google Ads interface are beneficial to account performance.
All that said, the Google interface and Google reps independent of the study push the score. Google pushing the score gives me pause, even when independent study data supports that OptiScore’s net positive on performance.
— Sarah Stemen, Business Owner, Sarah Stemen, LLC
While I don’t pay much attention to OptiScore or give much value to recommendations, we do review recommendations on an ongoing basis because they can surface some things we may not have seen as easily.
— Menachem Ani, Founder, JXT Group
I usually reject most of the recommendations and ignore OptiScore, unless we are about to lose our Google Partner Badge. After checking all of our accounts, I would like to add that nowadays the recommendations have increased in number and in variety than several years ago. Search is much more visual, and for instance, accepting the recommendation to add more images or enable dynamic images is rather beneficial with less risk for harm. Improving ads and assets, in general, makes sense too.
Our smallest accounts suffer most in terms of OptiScore because the system does not like limited budgets—for some of them, a budget increase might improve the score by 13%. For lead gen and gambling accounts (which underlie strict regulations), PMax would bring a score improvement of over 10%, which again does not make sense business-wise. Switching accounts optimizing on CAC to Target-ROAS for the sake of several OptiScore points already goes in the direction of business suicide.
— Georgi Zayakov, Senior Consultant Digital Advertising, Hutter Consult AG
Summary & Final Takeaways
OptiScore is not and should never be a KPI. It is a useful tool to focus work, though it should not be the only tool you use. Make sure you balance all recommendations from Google with the actions and optimizations that best serve your campaigns and business.
If you would like to have a third party to sanity check recommendations and strategies, check out Optmzyr’s PPC Management suite for Google and beyond.
When Google announced they would begin pausing low-activity entities (first ad groups, then keywords), the news was met with mixed response. Some felt it was an overreach and that practitioners should decide if keywords should be paused. Others felt that if an entity hadn’t done anything in 13 months (the minimum timeframe for it to be eligible for auto-pausing), it was time to move on.
There are a few theories around paused entities that are worth digging into before we dive into the data to help unpack the tension. While there is no official documentation supporting these theories, we respect that marketers have experienced anecdotal data to support them:
Some advertisers believe that leaving keywords with no performance in accounts helps other keywords do better. This is not supported by official documentation. Google actually says the opposite: that you might be creating duplicates.
There are other advertisers who have seen keywords go for months without any traction, and then all of a sudden pick up. Advertisers who have seen this happen, and voice frustration that their keywords no longer get unlimited ramp up time are sharing valid fears and frustrations. We haven’t seen this in a significant way, but that doesn’t diminish that some brands may experience this.
We do not hold any firm opinions on what the data would hold, however we do want to investigate the following questions:
How many marketers will be impacted and to what degree (number of keywords, performance, etc.)?
What kind of accounts do most marketers run today, and does the mass pausing represent a shift for most marketers account management styles?
Is there risk associated with Google’s mass pausing of keywords?
This is part one of our two part study. The second part will come out towards the end of the summer when we check in on the accounts in this study.
A bit about the criteria:
Accounts had to have at least 13 months of performance.
Accounts were split into three categories: Small (400 or fewer keywords), Medium (400-3000 keywords), and Large (3000+) keywords.
Accounts were further split into percentage of zero-volume keywords (0-25%, 26-50%, 51-75%, 76%+)
9430 accounts are included in our study
We included accounts from all markets
Because we did not bake in any consideration for the type of account (e-commerce/lead generation, Performance Max, age of account), we are not sharing the specific metrics associated with each group. That said, we looked at CPA, ROAS, CTR, CPC, and conversion rates to get some of those directional cues on performance.
The Data
How Many Accounts Have Significant Amounts (50%+) Of Low Volume Keywords:
Total: 7888 (84% of accounts)
Small: 3,020 (38%) accounts of the 4,300 small accounts.
Medium: 3378 (43%) accounts of the 3623 medium accounts
Large: 1490 (19%) accounts of the 1507 accounts
We compared the performance of accounts with a high percentage of low volume keywords with accounts with a low percentage of low volume keywords.
We found no meaningful difference in performance, which is why we believe most of these accounts won’t be negatively impacted. This is especially true given that the 378 accounts with 0-25% have some of the best performance of any account type (all metrics save for ROAS). When the change happens, accounts will likely mirror this account type (going from large to medium/small or medium to small).
There are a few outliers (145 accounts with very strong performance) in the large account category that may see a decrease in performance, due to how many keywords would get paused. Given that they were in the 50-75% tier, the pausing will represent a major shift.
For transparency sake, here’s the breakdown of how many accounts fell into each category:
Number of KWs
Category
No. of Accounts
Low
0-25% 0-impression kw
378
Low
26-50% 0-impression kw
902
Low
51-75% 0-impression kw
1341
Low
75-100% 0-impression kw
1679
Medium
0-25% 0-impression kw
39
Medium
26-50% 0-impression kw
206
Medium
51-75% 0-impression kw
868
Medium
75-100% 0-impression kw
2510
High
0-25% 0-impression kw
2
High
26-50% 0-impression kw
15
High
51-75% 0-impression kw
145
High
75-100% 0-impression kw
1345
How Many Accounts Are Small/Medium/Big, And Is There Any Meaningful Performance Difference Between These Accounts?
Small: 4300 total accounts: Won on CPC, CPA, and ROAS
Medium: 3623 total accounts: No Winners
Large: 1507 total accounts: Won on Conversion Rate and CTR
While larger accounts did have some wins, small accounts won more categories and after the keyword pause, it’s reasonable to expect many “large” accounts to become “small”. Since they had comparable performance, most advertisers should see limited change to their results. However there may be outliers that perform better or worse once the pause happens.
Are There Any Accounts At Risk For Performance Loss
Low/No Risk: 4904
High Risk: 145
Unknown Risk:4381
While there are some accounts that have reason to be concerned (they had some of the best performance of the entire cohort of ad accounts), they also represent such a small percentage of the overall sample size.
Smaller accounts (under 400 keywords) had the best ROAS, CPAs, and CPCs. This was true regardless of whether they had a lot of low volume keywords. Most accounts should fall into this category after the initial pause.
ROAS was strongest in accounts with higher percentages of low volume keywords. However it’s unclear whether this is a correlation or causation. We’ll have more insight when we run the numbers again post the pause.
Medium accounts (400-3000 keywords) had the worst performance of any cohort, and represented the second largest cohort of advertisers. These brands should see no change or potentially an improvement to their ad accounts.
Large accounts (3000+) seemed to have the strongest overall performance, however they also benefited from being older accounts. Note, this is an educated guess based on SKAG structure being an older account type from the pre-close variant era.
As we mentioned in the beginning, we acknowledge that there’s some concern around performance loss, but there is no concrete data to say one way or the other.
What Should You Do Regarding The Big Pause
We were surprised at how many accounts would be impacted by this update, and were relieved that there aren’t any major risk signs in the forecasting data.
If you’re an Optmyzr customer, you can use Rule Engine to bubble up zero impression keywords in your account so you can review them before they get to the 13 month threshold.
Typically when a keyword is getting zero impressions, it means one of these things:
The bid isn’t high enough.
The keyword is in the wrong ad group/campaign.
The Bid Isn’t High Enough
No keyword will be able to overcome a bidding problem. If a keyword’s auction price is $5-$10 and you’re bidding $2.50, there’s no way you’ll be able to rank for any meaningful queries.
This is where impression share lost to rank comes in. Impression share lost to rank tells you what percentage of available impressions you could be getting (but aren’t) due to low ad rank. While it’s reasonable to have some impression share lost to rank, anything over 10% is a sign that your structure and bidding are not aligned.
Additionally, you should consider your bidding strategy and any bid caps. If a budget is too low to meet a given conversion goal (volume or value), you will force yourself to underbid (even if you don’t provide a bid cap/floor).
Make sure that your budget can support at least 10 clicks per day (especially for non-branded search). If you don’t budget for at least 10 clicks, you’re banking on a better than 10% conversion rate. Search budgets should be able to deliver at least one conversion per day on paper, otherwise your budget is going to be wasted due to under budgeting.
Google is not going to be able to allocate budget in a meaningful way. Either it will double your daily spend to try and get you a few useful clicks knows it - which is why you might be forced to under bid and miss out on valuable impressions, clicks, and conversions.
The Keyword Is In The Wrong Ad Group/Campaign
Nothing is more tragic than a valuable keyword missing out on budget because it didn’t win initial auctions. When you put a campaign on Smart Bidding, you’re asking it to put budget behind entities that will drive conversions or conversion value. If there are too many entities sharing the same budget, it’s very easy for worthy keywords/ad groups to get passed over.
Previous data has shown that exceeding 10 ad groups per campaign can cause budget allocation issues. If your campaign has 15+ ad groups, it’s going to be hard to fuel all your keyword concepts. Consider moving zero impression keywords that aren’t covered by performing keywords to a different campaign. Where possible, pause redundancies (which is what’s happening June 11th).
PPC and Google Ads Experts Weigh In
We were lucky enough to get Friends of Optmyzr to share their perspective on the data. Here are some of their takes:
“The majority benefit from new structure”
The study echoes what I have found in audits, that pausing zero impression keywords likely doesn’t negatively affect performance and in the case of the small accounts I work with, has a negligible or positive impact. The majority of low impression keywords I see would benefit from a new structure if they’re important to the advertiser which is also echoed in the study. I’m excited for part two!
Amalia Fowler, Owner, Good AF Consulting
“Blurs the lines between ad platform and ad partner”
I think this change continues to blur the lines between Google as the advertising platform and Google as an advertising partner, which troubles me. In the former, a platform would not bother itself with something as simple as account organization. Whether to pause or keep keywords live that really have no impact on an account is, at its core, an organizational decision… which should, in my opinion, be left to the advertiser or advertising partner.
The Optmyzr study demonstrates exactly this: while many accounts are impacted, it really has no impact on the accounts. Admittedly, one could come away with the conclusion, “what does it matter if Google pauses these keywords automatically? It’s not really a big deal.” They would be right from a practical perspective, there would be no measurable difference in the vast majority of accounts.
However my concern with these types of things is that Google continues to make more changes and policies that blur the lines between platform and ad partner (which is partially responsible for their antitrust lawsuits, in my opinion, since they exercise freedom such as this in platform decisions that a non-monopolist company would not be able to engage in without losing customers).
All that to say, I think, philosophically, Google should leave organizational decisions like this to account managers.
Kirk Williams, Owner, ZATO
“No malicious intent… but how will it make Google more money?”
When I see a product change announcement like this, I always ask myself two things:
1. How does this make Google more money?
2. How can I ensure it makes me/my client more money, too?
Pausing low volume keywords seems innocuous, and I’m glad this study shows that for most advertisers, it will be.
But Google wouldn’t go through all this effort, communication, skepticism, etc. without something to gain. No malicious intent inferred here, just acknowledging that Google is a for-profit business.
So how will this make Google more money? My hypothesis is increased broad match adoption and/or PMax adoption when accounts have fewer keywords in them.
Jyll Saskin Gales, Google Ads Consultant, Learn With Jyll
“Step back from reacting and trust the data”
The Optmyzr study on pausing low-activity keywords is a great example of why data is important. While the initial announcement caused a stir in the industry, these results suggest minimal disruption for most accounts. This had been my initial guess as well.
This study really highlights the importance of stepping back from reaction and trusting data.
Sure, skepticism towards Google’s changes is healthy, but when the data shows potential benefits, like potentially aligning with simpler structures that the algorithm might favor, we as advertisers need to be adaptable.
The study’s finding on smaller accounts performing well also reinforces this idea of efficiency with less complexity. (this wasn’t an explicit finding however).
Sarah Stemen, Owner, Sarah Stemen LLC
Should I Re-Enable Paused Keywords?
Short answer: It depends.
Long answer: Likely not, but here’s an important checklist to run through if you’re considering it!
Is the keyword something I have active because my boss/client told me to?
If Yes: create the keyword in a new campaign focused on those client/boss asks that doesn’t have performance goals attached to it.
If No: test leaving it paused if existing keywords cover it, otherwise consider moving it to a new campaign.
Am I consistently losing more than 50% impression share due to rank?
If Yes: you likely have a budget/structure problem and will need to make some choices around using search to go after that part of your business.
If No: leave paused.
Were there any major events that might have caused performance glitches?
If Yes: re-enable, and consider passing that info into the data center.
If No: leave paused
If you’re not an Optmyzr customer, the best way to check for these paused keywords is the change history. You’ll be able to review the paused keywords and re-enable them. However if they don’t get any impressions after 90 days, they will be re-paused. This is why we suggest thinking critically if the keyword is in the best spot in the account.
If you are an Optmyzr customer, we will echo the earlier recommendation to use the Rule Engine to keep you up to date, as well as the quick insights on the dashboard to check your ratio of low volume keywords.
2023 was a lot. There were big cultural events that shook economic stability, as well as major innovations in ad tech.
One can never be sure how these changes will influence ad accounts. Sometimes they’re negligible, other times they have a big impact (for good or for ill).
We decided to look at the following mechanics and how advertisers can take the lessons from 2023 to future-proof their campaigns moving forward:
Match types: Did Broad Match enhancements in May of 2023 move the needle on its performance?
Auction price volatility: How have auction prices changed and what impact does that have on other key metrics for major verticals?
Performance Max: Are best practices actually best practices and just how much ROI is there in investing extra effort in creative?
We combined all three studies into one massive report because we see these questions as relating to each other. When match types behave the way you think they will (or don’t) that directly influences whether your account structure is going to deliver strong ROI. Volatility in auction prices might make you likely to trust PMax even though there are strong gains and paths to profit.
If you’re just interested in one of these questions, you can skip to that section in the navigation, but without any further ado, let’s dive in!
Match Types: Has Broad Match Evolved Enough & Is Exact Still the Best Path to Efficient Profit?
Before we dive into the data - here’s the TLDR:
While Exact did have more accounts (4000) performing better than Broad (all metrics), the difference closed a lot since our last investigation. This shows big improvements for Broad Match!
Average CPCs being as close as they are feels tied to general market fluctuation than one match type being “better” than the other.
Phrase Match remains statistically insignificant as advertisers own that Exact performs the same job, and Broad Match has a place in today’s PPC landscape.
Criteria for the Study
Must be running for at least 90 days prior to Q4 2023
Minimum spend of $1000 and maximum spend of $10 million per month
No branded campaigns included
Must have both Broad Match and Exact Match in the account
Metrics
ROAS
25.90% of accounts performed better with Broad, median percentage difference is 52.78%
74.10% of accounts performed better with Exact, median percentage difference is 100.59%
CPA
26.16% of accounts performed better with Broad, median percentage difference is 41.11%
73.84% of accounts performed better with Exact, median percentage difference is 97.11%
CTR
18.43% of accounts performed better with Broad, median percentage difference is 24.83%
81.57% of accounts performed better with Exact, median percentage difference is 51.11%
Conversion Rate
37.88% of accounts performed better with Broad, median percentage difference is 35.29%
62.12% of accounts performed better with Exact, median percentage difference is 41.05%
CPC
51.50% of accounts performed better with Broad, median percentage difference is 24.91%
48.50% of accounts performed better with Exact, median percentage difference is 30.22%
Findings and Analysis
Broad may not perform at the same level as Exact, but the performance gap closed quite a bit since we last ran this study. We have a few thoughts on why this may have happened:
Google made major improvements to Broad Match and it shows. Between the multilingual understanding and focus on intent, Broad Match is a much more reasonable data source than it was before.
Auction prices trickle down to ROAS and CPA. While there is no denying Exact had demonstrably better ROAS and CPA, the median performance improvements were better. This might be due to rising CPCs across the board.
PMax Search Themes are a factor here - they will always take a back seat to Exact Match while having the potential to win over Broad and Phrase if the syntax better matches the search theme. Given the wide adoption of PMax and statistically relevant adoption of search themes, broad might have performed even better if budget wasn’t diverted to PMax.
Action Plan
At this point there is no denying the match types have evolved to render syntax-driven structures moot. Whether you lean into Broad Match, DSA, or PMax as your data driver, you’re going to need to account for rules of engagement.
The Case for Keeping Broad in Your Account
Broad Match will show you exactly how various queries matched. While this might feel like an overrated feature, seeing what percentage of your Broad Match traffic would have come to you via phrase/exact can help you prioritize which keywords to keep/change out in your core ad groups.
If you use Broad Match, be sure that you add your other keywords as ad group level Exact Match negatives. This will ensure that your Broad Match keyword is able to do the job you intend for it to do without cannibalizing your proven keyword concepts.
To do this, you can run any of the following strategies:
A Broad Match ad group with one to two Broad Match keywords you’re using to gather data. The other ad groups in the campaigns should exclusively be Phrase or Exact (I’d suggest Exact).
A campaign with one ad group using Broad Match and all the other campaigns exclusively using Exact/Phrase.
Between the two, I’d suggest using the first method as that way Broad and Exact ad groups can help each other average out the deltas in the match types’ metrics. Without the conversions from Exact and the volume from Broad Match, campaigns might struggle to ramp up.
Choosing the right Broad Match keyword champion is the most critical choice. A few considerations:
Does the keyword represent the best “deal” on traffic?
Cheaper keywords won’t win every exploratory auction, but they might help you get discounts on high-value keywords when available.
Don’t ignore quality on the path to the best deal. The keyword still needs to represent your customers.
Keywords have different auction prices in different locations. Be mindful that your champion might need to change depending on geos.
Is the keyword representative of your Exact Match keywords or is it testing completely new ideas?
The benefit to being completely new is that you’re able to test your assumptions on established keyword concepts (i.e. they’re Exact).
Locking in the same root words in a Broad keyword lets you test for variant drift (what percentage of your queries come back as close variants with different root words).
Do your best customers search this way?
Lead gen and ecommerce campaigns need to factor in ROAS. Depriving Google and yourself of revenue data (even if it’s a projection) is asking the algorithm to focus on volume over value.
Honoring how your best customers search (high margin, easy to take care of, etc.) ensures that you’re not only matching keywords, you’re aligning creative.
The core ad metrics to focus on are CPC, conversions, CPA, and CTR-to-conversion rate.
The Case For Using PMax/DSA
PMax represents “black box” marketing to many, but as we’ll go over in the next section, there are a lot of areas for optimization and profit. Choosing to put your Broad Match budget into PMax may serve you better as it inherently comes with channels beyond search.
As younger generations come into their buying power, they are “searching it up” vs Googling it. That means having a presence on YouTube or other meaningful sites can be the difference between having a profitable conversation and losing to your competitor.
The other big checkbox for PMax (or DSA if you truly need just search) is that you won’t be subject to human bias. The keywords you think you’ll need might only cover part of your core customer base. Additionally, human-created keywords (even Broad Match) are subject to low search volume.
Be sure that you’re checking the search term insights to understand what keyword concepts are coming out and which might make sense to include as an Exact search term.
We’ll be going into the data on Search Themes in the PMax section, but it’s worth noting that exactly replicating your search keywords as search themes is likely a mistake. This is because your Exact Match keywords will always win, but phrase and Broad Match can lose to search themes.
Performance Max: What Are Most Advertisers Doing and Are They Right?
Here’s the TLDR on PMax data, which is framed more as questions than organizing by metric gains:
This is not an “easy campaign” type. While only a small percentage of advertisers had campaigns in the red (3.92% of campaigns), advertisers who put in average effort got average results.
There is no right answer on whether to segment your PMax campaigns through asset groups or a separate campaign. Use budget and priority of the product/service as your guiding lights.
We as an industry have a bias for text assets but successful marketers have just as many images and are leveraging video they create.
There is a bias around feed-only campaigns doing better than any other. While they do have a higher median ROAS, they also have the built-in bias of ecommerce having wider adoption of ROAS bidding.
Criteria for the Study
The account needs to be active for at least 90 days prior to the investigation period
Monthly spend needs to be at least $1000 per month and could not exceed $10 million per month
The account needs to have conversion events firing successfully
7100 ad accounts and over 18K campaigns worldwide qualified for the study
Metrics/Questions
Question #1: What Does the Average Advertiser Do with PMax?
57.72% of advertisers run a single PMax campaign in their account
42.28% of advertisers run multiple PMax campaigns.
While 41.35% of advertisers ran one campaign with one asset group, the median number of asset groups per campaign across all advertisers is 31.
Advertisers load up on text assets (16 median per campaign), and image assets (13 median per campaign), but fall short with video (4 median per campaign).
99.2% of advertisers use audience signals.
33.3% of advertisers use search themes.
55.65% of advertisers use account exclusions in combination with PMax. These include negative keywords, placement exclusions, and topics.
72.5% of advertisers run feed-only campaigns.
Analysis/Thoughts
There are some biases in the data given that Optmyzr’s toolset proactively lets advertisers know if they’re missing audience signals. Additionally, there are tools for building out new shopping-oriented campaigns based on performance. This means our customer base is predisposed to harness feed-based PMax campaigns.
Despite those biases, there is no denying that feed-based PMax campaigns are the most popular. This is also due to ecommerce having a wider adoption of PMax than lead gen. There are a few reasons for this:
Smart Shopping got rolled into PMax and so many ecommerce marketers felt compelled to leverage PMax.
PMax thrives on ROAS bidding but can also function with CPA bidding. Lead-gen brands historically struggle to adopt ROAS bidding because they’re nervous about feeding bad data into the system.
Google-first advertisers tend to be more analytical than creative. This is absolutely shown in the bias towards text creative vs. visual. What’s interesting is that despite most PMax channels being visual, advertisers still cling to text (and expect amazing results).
Whether this is because they believe text is synonymous with bottom of the funnel, or because they are not confident or skilled to provide visual content; the fact remains that auto-generated content has a viable place in the marketplace until advertisers own it.
I was truly surprised that it’s essentially 50/50 on whether advertisers use exclusions with PMax. Given how vocal we are as an industry, I was expecting near-universal adoption. It’s unclear whether those who don’t use exclusions are doing so because they trust Google or if they don’t know how to apply exclusions.
Question #2: What Impact Does Applying Effort to PMax Have?
Before we dive into the numbers, it’s important to acknowledge the impact spend has on results. Larger spend accounts will have smaller gains because percentages are going to be smaller. We are sharing median values to mitigate this as much as possible.
Impact of Exclusions (negative keywords, placements, topics)
Campaigns using exclusions (3963) have a median CPA of $21.45 and ROAS of 425.28%
Campaigns not using exclusions (3158) have a median CPA of $18.55 and a ROAS of 423.44%
There is only a .24% difference in conversion rate between campaigns using exclusions (favors not using exclusions)
Impact of Using Feed-Only vs All Creative Asset Campaigns
Feed only campaigns have a median CPA of $21.58 and a ROAS of 502.21%
All asset campaigns have a median CPA of $16.35 and a ROAS of 101.71%
Feed only asset campaigns have a median conversion rate of 2.32% vs all asset campaigns with a conversion rate of 4.72%
Impact Of Using Audience Signals
Note: There is such a delta between accounts that use audience signals vs. those that don’t that we will only be highlighting the metrics of accounts that do. This is because we could only find 121 qualifying campaigns that didn’t use audience signals (compared with the over 14K that do). We’ll be sharing the performance gains vs the actual metrics.
35% better CPA
89% better ROAS
8% better conversion rate
Impact Of Using Search Themes
Campaigns using search themes saw a median CPA of 22.46 and ROAS of 377.33%
Abstaining from search themes resulted in median CPA of 20.30 and ROAS of 453.95%
Conversion rate is flat between using Search Themes and not using them
Impact Of Segmenting PMax Campaigns By Asset Group
Median ROAS of One Asset Group 424.57%
Median ROAS of Multiple Asset Groups 461.64%
Median ROAS of All Campaigns 426.66%
Analysis/Thoughts
There are some real surprises here on what impacts performance. I was not expecting Audience Signals to be such a big factor given that Google shared they’re designed to help teach the algorithm in the early days of the campaign. That near-universal adoption contributed to such big gains points to more utility than an early campaign boost.
Given that audience signals are so important, it’s critical that you’re setting yourself up to leverage them in the privacy-first world. Google now requires consent confirmation attached to your customer match lists and if you don’t include them, the list might fail.
Another big surprise was how tepid the results for search themes are. Given that search themes are designed to represent keywords in PMax, one would think adoption would serve better.
However, there was a sizable population of marketers using their keywords as search themes. This is a bad idea (unless the search themes/keywords are in transition) because Exact Match will always win over search themes.
However, Broad Match and Phrase can lose to search themes if the search theme syntax is closer.
The ideal workflow for search themes is to use them to test potential new Exact Match keywords. If you see your PMax campaign picking up more valuable traffic than your search campaigns, you know you need to consider adding those search themes as Exact Match keywords. Then you can test new search themes.
The control freak in me was disappointed that leveraging exclusions essentially represented a wash. That conversion rates were flat and the gains were very small on accounts that used exclusions makes one question if they are being used correctly.
I believe there is a strong human error component influencing the numbers (people not correctly applying account level negatives or not being aware of the form for campaign level).
That said, numbers don’t lie and it might be worth testing some campaigns without the human bias (provided brand standards are still accounted for).
Before we dive into the state of accounts in general, we wanted to address the biggest PMax question of all: is it worth it to do segmentation work?
Short answer: yes.
Long answer: your budget is going to influence whether you make this an asset-level or campaign-level segmentation.
If part of your business needs a specific budget, then asking one campaign to do all the work might be tough (especially if you’re serving multiple time zones/cost-of-living geos).
Conversely, if margins and value are essentially the same, you likely can save budget by consolidating with a multi-asset group PMax campaign (you can have up to 100 asset groups).
Industry View on CPCs, CPAs, ROAS, Spend & What You Can Do About It
Last year at the Global Search Awards, I had a great conversation with Amanda Farley about her suspicion that CPCs were being jacked up by human error and panic. We both agreed that the volatility in the economy and the fluctuations on the SEO side were causing erratic spending. Yet without data, we couldn’t quite put our finger on it.
Here’s a look at 2023 main metrics for the major verticals in the Optmyzr customer base. A few notes about the data:
This data is based on 6758 accounts globally.
We are including the Median change as opposed to the hard numbers. This is because accounts have a number of different factors and getting caught up in a specific number isn’t as useful as finding the profitable number for you.
Metrics
Vertical Breakdown
We looked at 6,758 accounts worldwide and compared their average and median performance difference between 2022 and 2023.
Core Findings for Cost
Spending being up across the board could have been a bad thing. However, as the ROAS and CPA graphs show, many industries have seen greater success in 2023 than in 2022.
There were a number of big SEO updates in 2023, so there is a certain degree of mitigation spend vs success spend.
The big spike in the Pet vertical is in large part due to budgets being smaller.
Core Findings for CPC
PMax plays a large role in the reduced CPCs. Given that visual placements have cheaper auctions and are a big factor in PMax campaigns, it makes sense that CPCs would trend down.
Verticals that saw spikes in CPCs (home services, law, pet, real estate, and travel) represent ties to other ad types (Local Service Ads and Hotel Ads). While those spends aren’t factored in the study, it’s worth noting that those ad types have gained much stronger adoption as CPCs rise.
We found that accounts using portfolio bidding with bid caps (either through the ad platform or using Optmyzr budget pacing tools) can help set protections in place while still leveraging smart bidding.
Core Findings for CPA
Legal is the big loser here and there are a few reasons for this: inability to leverage automation/AI due to brand restrictions, choosing ego bidding over cost-effective cost per case, and greater adoption of offline conversions factoring in the volatility of legal leads.
The fairly flat or decrease in CPA in other verticals speaks to consumer confidence, as well as a rise in micro-conversions. Accounts by in large do not use the conversion exclusion tool, which means the influx of Google-created conversions from GA4 might be a factor here.
Auto and real estate having such strong performance are tied to each other as more and more folks push for home ownership but might be forced to move outside their working cities.
Core Findings for ROAS
ROAS up or flat across the board could be taken as a stamp of approval for PMax or could be a sign that more folks are adopting ROAS bidding.
It’s worth noting that CPA decreases for the most part did not result in ROAS losses.
The general “frustration” in the market is likely from ecommerce. With CPAs up 10% and ROAS essentially flat, it speaks to consumer restraint as well as the emergence of TikTok Shops, Temu, Advantage+, and increased Amazon adoption.
Value Of Branded Campaigns
No. of accounts
CPC
CTR
Conv Rate
ROAS
CPA
Accounts that do not contain any branded campaign
9118
0.48
2.10%
7.24%
449.37%
6.65
Accounts that contain at least 1 branded campaign
10201
0.73
1.85%
7.97%
559.80%
9.15
Analysis/Thoughts
Here’s why we included the branded analysis with the vertical one: the impact on CPC and subsequent CPA/ROAS.
Branded campaigns have historically been heralded as an easy way to ramp up campaign performance. However, with the rise of PMax and the general flux in spend, the clear benefits and “best practice” level adoption are up in the air.
The ROAS and conversion rate gains aren’t that significant and all other metrics favor accounts that don’t run branded campaigns.
Based on the PMax adoption and the spend data I have two potential reasons for this:
Advertisers are jaded and have rolled branded spend into PMax and are treating PMax campaigns as branded/quasi remarketing campaigns. While I don’t think this is wise (especially given how search themes work and the ability to exclude branded), there’s no denying the level of cynicism that’s crept into the space.
Google has gotten smarter/better and no longer needs branded campaigns to understand an account has valuable campaigns.
Ultimately I still believe there is utility in a small-budget branded campaign because that way you can add it as a negative everywhere else.
Regarding the Vertical Spend Data
It is genuinely surprising to see every vertical spending more (regardless of performance gains or losses). This speaks to scares from the SEO side of the house and folks feeling like they need to make up the volume through paid. While we did hear some sentiment around fears in rising CPAs and CPCs, it’s worth noting Optmyzr customers for the most part saw cheaper CPAs and greater ROAS (with legal being a major exception).
We investigated how many ads per ad group each vertical had and were not terribly surprised all but Auto had a median of 1 (Auto has 2). This speaks to the trust among most advertisers (53%) to follow Google’s advice on the number of assets.
Many advertisers focus on Google first, regardless of whether that channel will serve them well. If you’re going to advertise on Google you need to make sure you can fit enough clicks in your day to get enough conversions for the campaign to make sense.
One of the reasons Optmyzr builds beyond Google is we see the importance of harnessing social and other search channels. Don’t feel trapped by habit.
That said, despite upticks in spend, there are clearly winning verticals, and all verticals came in flat or up on ROAS.
The Time for Automation Is Now
There has never been a better time to embrace automation layering in PPC. Having the ability to put safety precautions on bids as well as the importance of honoring what tasks will yield the highest ROI on time is mission critical.
Whether you’re an Optmyzr customer or not, you should be empowered to own your data and your creative. PMax is a staple campaign type at this point and fighting it is just going to leave you behind. However, not every task needs to be done and ultimately budget should determine how much you segment.
Keywords may be dancing between relevance and history, but until the ad networks retire them, it is important to know that Exact Match is where performance is and Broad Match is where testing lies.
After the Display vs Discovery Ads challenge, we decided to run a new test in the last part of 2023 to compare Demand Gen campaigns’ performance to that of “regular” Display campaigns. As in the previous experiment, we set the same budget for about 30 days, using the same content & targeting options. Here’s what happened.
This time we promoted ADworld Experience video-recording sales. As some of you may already know, ADworld Experience is the EU’s largest all-PPC event. Its main target audience is seasoned PPC professionals, who work with Google Ads, Meta Ads, Linkedin, Microsoft, Amazon, TikTok, and other minor online advertising platforms.
During the previous test, we found that experienced PPC professionals could be effectively targeted using an expressed interest in any advanced PPC tool. So we selected the most renowned ones excluding those not directly related to the main platforms.
Here are the brands we targeted in alphabetical order: adalysis, adespresso, adroll, adstage, adthena, adzooma, channable, clickcease, clickguard, clixtell, datafeedwatch, feedoptimise, feedspark, fraudblocker, godatafeed, opteo, optmyzr, outbrain, ppcprotect, producthero, qwaya, revealbot, spyfu, squared and taboola.
Using this list we were able to set up 3 different audiences based on:
PPC professionals who searched for a PPC tool brand in the past on Google;
PPC professionals who are interested in a PPC tool;
Users who have shown interest in PPC tool website URLs in SERPs.
Then we created a Demand Gen campaign and a regular Display campaign, with 3 ad groups each, based on one of the above audiences. The key settings were:
In both campaigns we limited demographics to users aged 25 to 55 (the main age range of adwexp participants) + unknown (not to limit too much the audience) and in Display campaigns we excluded optimized targeting (to avoid unwanted overlapping).
The goals were: past edition video-recording sales and navigating 5 or more pages in one session (to grant Google’s smart bidding enough conversion data to work on).
Geotargeting was limited to the home countries of the majority of ADworld Experience past participants (a selection of EU countries + UK, Switzerland, Norway, and Finland). We targeted all languages used in these countries and scheduled ads to appear every day from 8:00CET to 20:00CET.
In Demand Gen we had to accept Google’s default filter for moderate and highly sensible content. In Display, we excluded all non-classified content, fit for families (= mainly videos for kids on YouTube), all sensible content, and parked domains.
The bidding strategy was set for both campaigns on Maximize Conversions, not setting (at least initially) any target CPA.
Text and images were almost exactly the same, even if placements were different (GDN for Display and YouTube, Gmail and Discover newsfeed for Demand Gen). We were forced to shorten some headings in display campaigns, but descriptions and images (mainly 2023 speakers’ photos) were exactly the same. In the Display campaign, we were able to select also some videos and left auto-optimized ad formats on.
Regular Display Ad Examples
Demand Gen Ad Examples
Once we started the experiment, in the Display campaign we were soon forced to set different target CPA to grant all different groups/audiences a more uniform distribution of traffic, lowering it where it spiked and increasing it where it languished. In Demand Gen, we had to pause 2 out of 3 groups to give all of them a minimum threshold of traffic to count on (“Searchers of PPC Tools” adgroup in Demand Gen did 0 impressions for almost 20 days, until that).
In the Display campaign, we excluded all unrelated app categories (all except business/productivity ones) and low-quality placements spotted in the previous test, starting with almost 500 exclusions.
The Results
Here are the numbers we had about 5 weeks and 1.200€ spent after.
Regular Display Campaigns
Demand Gen Ads
If we look at global conversion numbers Google seems to have worked very well with Demand Gen. These AI-powered campaigns clearly outperformed both a professionally set Display campaign with the same content/setting and the old Discovery Ads we used in the previous test to promote the 2023 event registration (if we do not consider last week results, that were comparable).
Audiences performed in a fairly homogeneously way in Display, while there was a clear winner in Demand Gen, with the audience built on PPC Tools’ URLs, which Google was very fast to spot just 1 week after the kickoff, while Discovery’s latency on our previous test has been 3 weeks long. The only negative aspect of DGen traffic is the lower percentage of engaged sessions in GA4 (session longer than 10 seconds or with a conversion event or at least 2 pageviews/screenviews). It seems that GDN can still bring to your website more in-target users.
Almost all Demand Gen placements were on YouTube (both the converting ones and the rest), making me say that probably would have been better to compare this campaign with a Video Campaign, more than to a GDN one. The Display campaigns were totally on the other side of the channel, with very few placements alongside videos (& with incredibly high CPCs in some rare, but remarkable cases) and the large majority of impressions & clicks made on regular AdSense network sites.
I was also surprised to see that this time audience performances were comparable in both campaigns, while in the Discovery vs Display test “PPC Tool past searchers” achieved the best Conversion Rates in GDN. To explain that I can only suppose that this was due to the difference in the set goals. Joining an advanced event live is probably more attractive for a PPC pro than looking at its videos afterward. The most laser-targeted audience of someone who has recently searched for a valuable keyword should probably still be the best option in Display, while it is too narrow for DGen.
Final Takeaways
My final takeaway is that if your goal is not only to convert but to drive low-cost (but still well-targeted) traffic to your site with a set-and-forget campaign, then Demand Gen Ads are your must-go.
While, if you have a low budget but want to get results at an acceptable cost and have time and know how to optimize settings, then old-style Display campaigns may still be a good option. In both cases, tests with different audiences & assets are vital if you do not want to throw your money in Google’s vacuum!
If you are curious about specific aspects of the test, reach out to me, and we’ll be happy to drill down the data for you. Now it’s your turn. Did you do any comparison between Demand Gen and regular GDN campaigns? What are your findings?
Last quarter, we ran a test with Discovery Ads and “regular” Display campaigns to promote ADworld Experience event registrations. We spent the same budget for about 30 days using the same copy & targeting options. Here’s what we found.
As some of you may already know, ADworld Experience is the largest all-PPC event in Europe. The event’s main target audience is seasoned PPC professionals, who have been operating for some years in Google Ads, Meta Ads, Linkedin, Microsoft, Amazon, TikTok, and other online advertising platforms.
The experiment
The first key question to start the test was: how to effectively target experienced PPC professionals via Google Display channels?
An expressed interest in any advanced PPC tool could be one way to target them.
Creating audiences
So we made a list of the most renowned tools (in alphabetical order): Adalysis, Adspresso, Adroll, Adstage, Adthena, Adzooma, Channable, Clickcease, Clickguard, Clixtell, Datafeedwatch, Feedoptimise, Feedspark, Fraudblocker, Godatafeed, Opteo, Optmyzr, Outbrain, PPCprotect, Producthero, Qwaya, Revealbot, Spyfu, Squared, and Taboola.
Using this list we were able to set up 3 different audiences based on:
1. The PPC tool name searches in Google
2. The PPC tool’s interested users and
3. The users who’ve shown interest in a PPC tool’s website URLs in SERPs.
Campaign setup
Then we created a Discovery campaign and a regular Display campaign, with 3 ad groups each, based on one of the above audiences.
In both campaigns, we excluded optimized targeting (to avoid unwanted overlapping) and limited demographics for users aged between 25 and 55 (the main age range of ADworld Experience participants) + unknown (not to limit too much of the audience).
Campaign goals
The goals were:
Getting registrations for the 2023 event that happened on October 5 & 6,
Sales of past edition video recordings, and
Navigating 5 or more pages in one session (to grant Google’s smart bidding enough conversion data)
Geotargeting was limited to the home countries of the majority of ADworld Experience’s past participants (a selection of EU countries + UK, Serbia, Bosnia, Svizzera, Montenegro, Norway, and Finland). We targeted all languages and scheduled ads to appear every day from 8:00 CET to 20:00 CET.
In Discovery, we accepted Google’s default filter for moderate and highly sensible content. In display campaigns, we excluded all non-classified content, fit for families (= mainly videos for kids on YouTube), all sensible content, and parked domains.
Bid strategy
The bidding strategy was set for both campaigns on Maximize Conversions, not setting (at least initially) any target CPA.
The text and images were almost exactly the same, even if placements were different (GDN for Display and YouTube, Gmail and Discover newsfeed on Android devices for Discovery). We were forced to shorten some headings in display campaigns, but descriptions and images (mainly 2023 speakers’ photos) were exactly the same. In the Display campaign, we were able to select some videos and let auto-optimized ad formats turn on.
The daily budget was 20€ for each campaign (in Discovery the suggested budget was 40€/day, but we launched it and then later lowered it to 20€/day).
In a previous test with Discovery Ads, we found that URL-based ad group/audience was definitely predominant in terms of traffic, so we decided to exclude in that campaign all the tools not directly related to campaign management in the most widespread platforms (Adroll, Adstage, Godatafeed, Outbrain, Qwaya, and Taboola).
Besides that, in both campaigns, we were soon forced to set different target CPAs to grant all different groups/audiences a more uniform distribution of ads, lowering it where traffic spiked and making it higher where it languished.
Both in Discovery and regular Display we had to closely monitor the geographical distribution of the ads to have a more uniform coverage, lowering Max Bids up to -90% in some areas and pushing up to +50% in some other ones (it looks like Romania, Serbia and Bulgaria have a lot of “spammy” placements, while central EU countries offer much more refined and expensive spots, with no relevant differences between the two campaigns).
In regular Display ads, we could exclude low-quality sites and apps, ending up with almost 500 exclusions. We decided not to apply a pre-existing list of spammy/off-topic placements we built from previous campaigns to avoid giving regular Display campaigns an advantage over Discovery since the beginning.
The results
Here are the numbers we had after about 5 weeks and 1,500€ of total expenditure:
Regular Display Campaigns
Discovery Ads
Exposed target CPA are the final ones (reached after several progressive adjustments)
If we look at global conversion numbers, it might seem that Google’s AI-powered placements still have a long way to go before competing with a professionally set Display Ad campaign.
Another interesting thing is the radically different performance of the same audiences in the two campaigns. The audience of past searchers of PPC tools and URL-based targeting have been respectively the best and the worst performers in GDN and… exactly the opposite in Discovery Ads!
You will find another interesting “surprise” when you isolate the same numbers for the last week of both campaigns.
Regular Display Campaigns Final Week
Discovery Ads Final Week
The first and most evident general conclusion is that Discovery AI-powered placements need more data (time/money) to really start auto-optimizing.
The second most obvious conclusion is that if you know exactly what you are doing and need your campaigns to perform soon and to be laser-targeted, old-school display campaigns are still very likely to be your best choice.
The third important consideration is that if your goal is not only to convert but to drive low-cost traffic to your properties, then you should have few doubts about pushing for Discovery Ads.
Drilling a little down into the data, I was really surprised to see how different we’re performing with the same audiences within the two campaigns. We can only suppose that topic searchers’ targeting fits better to lower automation-level campaigns (being the most focused targeting option you may use in Display Network), while probably URL matching gives the Google Machine Learning algorithm more space for auto-optimizing (when a good amount of data becomes available).
If you aren’t familiar with Responsive Search Ads, a good way to think of them is giving Google a bunch of different text components to mix and match while it finds the best combinations. There’s a learning period for any new RSA, which means performance may not be what you’re used to right away.
With this transition from Expanded Text Ads (ETAs) to Responsive Search Ads (RSAs) comes a host of questions about the performance of RSAs, the need to display key information in your ad text, and how to manage the transition to PPC campaigns composed solely of RSAs.
Of course, third-party tools like Optmyzr can help identify the best-performing components of your current ads and even help you build RSAs from scratch. But it never hurts to know where things stand as you plan to build your RSAs.
In this article, you’ll find the results of our study on RSA performance, answers to some pressing questions about the transition, and advice on how to retain control of your search campaigns with RSAs.
How and what we analyzed
Our 2022 study of RSA performance covers 13,671 randomly chosen Google Ads accounts in Optmyzr and answers questions like:
Is RSA usage as common among advertisers as you think?
How does RSA performance compare to that of ETAs?
What effect do pinned headlines/descriptions have on performance?
We’ve presented the results by category so you can quickly find what’s most relevant to your goals.
Watch Frederick Vallaeys present the study on PPC Town Hall below.
Get actionable PPC tips, strategies, and tactics from industry experts twice a month.
Key findings from our Responsive Search Ads data analysis
Here’s our CEO Frederick Vallaeys on what the study taught us about the relationship between PPC marketers and Responsive Search Ads.
“The biggest insight is that advertisers have focused on the wrong metric. Responsive Search Ads have a better click-through rate but a lower conversion rate. This upsets advertisers because when they A/B test, they assume that the ad group has a fixed number of impressions and that by showing lower-converting ads for these impressions, conversions will go down (and costs up). Google, meanwhile, is happy because there are more clicks.”
But this is an incomplete picture.
“What our study shows is that impressions for an ad group are highly dependent on the ad, and RSAs drive 4x the impressions of a typical ETA. Even with a slightly lower conversion rate, this 400% lift in impressions nets a lot of incremental conversions that should make advertisers very happy.”
Responsive Search Ads have a better auction-time Quality Score, so they help you qualify for more auctions. They also boost ad rank and give you access to entirely new search terms (and impressions). As a result, ad-level performance and metrics like click-through or conversion rate may not paint a full picture of your performance.
Evaluate the success of your ads based on the incremental impressions, clicks, and conversions your ad groups and campaigns receive.
Statistics on Responsive Search Ad usage
This year, out of the 13,671 accounts we analyzed:
7.7% have never built a single RSA
92% currently have at least one active RSA
0.4% had RSAs but stopped using them
Optmyzr’s Interpretation: Most advertisers are already well on their way to transitioning to Responsive Search Ads, and those who have experimented with the new ad format tend to like the results enough to keep RSAs active.
Statistics on Responsive Search Ads and pinning
Pinning – fixing headlines or descriptions to specific positions – gives you more control over how your RSAs appear to users. But it also reduces your ad strength, according to Google.
In our analysis of over 93,055 Responsive Search Ads, we looked at the impact of three ways to pin: no pinning, pinning only some ad positions, and pinning all ad positions.
We found that RSAs that pin every position have great metrics like CTR and Conversion Rate, which makes sense for advertisers who’ve done great A/B testing for years and have hyper-optimized ads.
CTR is much better when pinning one text.
But impressions per ad group are 3.9 times higher when giving Google the flexibility with multiple texts per pinned location.
Optmyzr’s Interpretation: Advertisers who’ve spent several years optimizing their ETAs are creating “fake” ETAs by pinning one text at every position to recreate those strongest-performing ETAs.
Statistics on Responsive Search Ads and number of headlines
Responsive Search Ads can have up to 15 different headlines for Google to combine in different ways. And we’ve found that more headline variants lead to more impressions per RSA.
We’ve also seen GPT-3 getting quite good at suggesting ads for PPC managers to review.
After analyzing 432,343 ads, we’ve also observed that adding Dynamic keyword insertion/ad customizers to RSAs increases the impressions per ad. On the flip side, there is a decrease in conversions per ad.
Optmyzr’s observation: The ads do look more relevant and hence get more clicks, but they can’t always deliver on the promise of what was automatically inserted in the text. Adding DKI or ad customizers to RSAs can decrease performance.
Statistics on financial performance of Responsive Search Ads vs. Expanded Text Ads
Responsive Search Ads can have up to 15 different headlines for Google to combine in different ways, but you only need to provide three – anything more is optional. We grouped each ad based on the number of headlines, further segmenting them by metric.
When each ad type wins its ad group, RSAs average out at a $1.48 higher cost per acquisition than ETAs. However, they also cost an average of $10.96 less when they lose.
This means that RSAs offer comparable winning performance to ETAs while saving significant costs when they lose. This trend extends to other financial metrics like ROAS and cost per click.
Responsive Search Ads Best Practices: Stay in control of PPC in the automation era
We don’t believe that either Responsive Search Ads or Expanded Text Ads are definitively better than the other.
So much of success in PPC depends on individual account needs, client relationships, global and market volatility, supply chains, and the expertise of the marketing and business teams involved.
However, the fact remains that you won’t be able to create any new Expanded Text Ads (or edit existing ones) now.
These next sections cover our recommendations to help you get started with managing this transition. As always, use them as thought-starters in the context of your client or brand’s specific goals.
1. Know the difference between ad strength and asset labels.
Ad strength is a best-practice score that measures the relevance, quantity, and diversity of your Responsive Search Ad content even before your RSAs serve.
Every increase in ad strength provides approximately 3% click uplift e.g. poor to average, average to good. However, it has no relation to performance.
Asset labels, on the other hand, give you guidance on which assets are performing well and which ones you should replace after your RSAs serve. These suggestions from Google are based on performance data, so if one of your assets doesn’t get impressions in 2+ weeks, you might want to replace it.
2. Build evergreen Expanded Text Ads (if you can).
While you can’t create new ETAs, any existing ones will continue to serve for as long as you like. You can pause and resume these ETAs, but you won’t be able to edit them in any way – that includes bids, keywords, ad text, targeting, and even budgets.
However, that won’t be an issue if you happen to have some evergreen campaigns or ad groups that you know can run without those modifications – possibly top-of-funnel brand campaigns or for a product line that you’re confident won’t go away.
Keep in mind that not every brand will have (or can afford) these opportunities, and even the ones that do may have to accept that those ads will need to be retired at some point – like if a key supplier goes out of business or the brand changes its name.
3. Start finding the pieces of your new Responsive Search Ads.
Ad Text Optimization lets you quickly find the best-performing text in your account
If your campaigns have been running for some time, there’s a good chance that you already have some quality RSAs floating around in different ad groups. It’s finding these individual components that can prove time-consuming and error-prone.
Fortunately, a tool like the Ad Text Optimization function in Optmyzr can make light work of that, allowing you to sort through single or multiple campaigns in minutes.
Our tool allows you to sort by element type (headline, description, path), individual placement, or even full ads to find the best-performing elements for the desired metric.
Once you have your ad text ready, you can bring the process full circle:
Build a new ad with our Responsive Search Ad Utility
Validate your findings in the AB Testing for Ads tool
4. Consider variety in your Responsive Search Ads.
Key metrics for RSAs vary by the number of ads in an ad group
While you can create up to three Responsive Search Ads in one ad group, it’s difficult to find a consensus on the optimal number.
On the one hand, too many RSAs can dilute your messaging variations – especially if each one carries the full 15 headlines and four descriptions. But limiting yourself may not always be the right move either, assuming each RSA is distinct in terms of what it addresses.
The findings from our study show that ad groups with more RSAs tend to get significantly more impressions, but ad groups with two RSAs experience a surge in conversion rate that single-RSA and three-RSA ad groups don’t.
Having 2 RSA ads per ad group seems to be the sweet spot mostly based on improved conversion rates
As always, consider the merits of every situation and ad group individually.
5. Decide whether to pin elements in your Responsive Search Ads.
Google identifies excessive pinning as one of the 8 causes of weakened RSA ad strength, and while it’s not clear at what threshold this changes, it’s safe to say that your results will get weaker the more elements you pin.
However, some advertisers will need to pin specific pieces of text, such as disclaimers and warnings for those in legal or pharmaceutical advertising. Google is yet to comment on whether these industries with obligations will be assessed differently, or whether a new element will be made available to cater to this need.
For now, advertisers will have to do what they must with what they have access to. Just reconsider if you’re thinking about gaming the system by pinning all your elements to create a pseudo-Expanded Text Ad.
6. Change how you think about A/B testing with RSAs.
The methodology of A/B ad testing has long been premised on the assumption that impression volume is determined primarily by keywords and is only minimally dependent on the ad. This assumption is false with Responsive Search Ads.
Old Way: Focused on conversion rates or conversions per impression
New Way: Focused on conversions within CPA or ROAS limits
7. Take out a PPC insurance policy with automation layering.
A list of active alerts at multiple levels in Optmyzr
Maybe you’ve had success with your search campaigns by determining large parts of their optimization strategies, or maybe you’ve been using automated bidding strategies in tandem with solidly built Expanded Text Ads that you control.
Performance Max in itself is not a direct threat to your account – you can always opt out of them unless you plan to use a Local or Smart Shopping campaign, both of which will be absorbed by Performance Max.
However, the double whammy of switching to Responsive Search Ads and running a Performance Max campaign together can be a risk for all but the most insulated PPC accounts. We suggest tackling one at a time.
Even then, the more Google automates their platform, the more vital it becomes for you to have a layer of automation working for the benefit of your account. A tool like Optmyzr makes that all the more possible – and effective.
Optmyzr users get access to all types of budget-related and metric-based alerts, giving them the ability to intervene as soon as signs of trouble begin to show. There’s also the Rule Engine, one of our most popular tools that lets you create rule-based automation for anything you can think of.
Best of all, you can switch it all off whenever you like.
But first, revisit your account structure.
Before doing anything, it’s important to understand how any brand’s individual transition to the Responsive Search Ad era will impact its account structure. Some of the questions you’ll need to answer include:
Which campaigns and ad groups will continue to serve Expanded Text Ads?
Which ad groups need new Responsive Search Ads? How many in each?
Do I need to create new campaigns to avoid mixing RSAs and ETAs?
How will I monitor the performance of legacy and new ads/campaigns?
One of the best places you can start is with Aaron Levy’s session from our UnLevel virtual conference in May 2021. In 40 minutes, Aaron shares a framework for building an account structure that is adaptable to the rapid change and increased automation that have come to define modern-day PPC.
This article repurposes portions of Frederick Vallaeys’ presentation on Responsive Search Ad performance from SMX Advanced 2022.
This article was originally written on Aug 17, 2022. It has been updated on April 7, 2023.
Get actionable PPC tips, strategies, and tactics from industry experts to your inbox once a month.