Your Responsive Search Ads (RSAs) are your brand’s first impression on the search results page. It’s the moment when a potential customer decides whether to click, explore, or move on to someone else.
Yet too often, RSAs are treated as an afterthought- hastily built, rarely tested, and left to “figure themselves out.”
The result is weak messaging and performance that never reaches its full potential. That’s why I decided to take a closer look at what truly makes Responsive Search Ads perform.
And here are the eight rules of thumb I personally follow when working with RSAs:
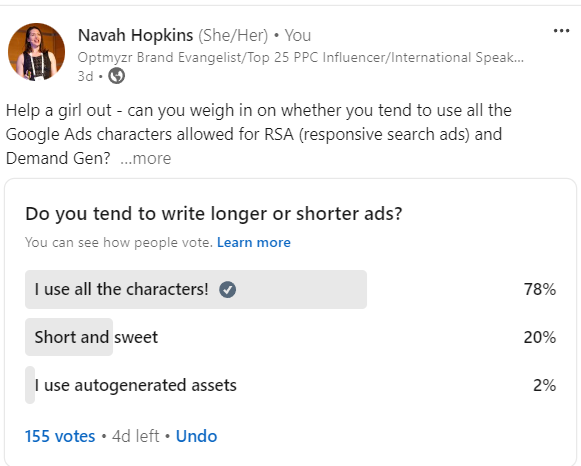
1. Should you use all the available headlines?
“Google recommends 15 headlines, so I should use all 15, right?”
Actually, it’s the opposite. I usually stick to around five strong headlines. This saves time, sharpens your messaging, and helps Google’s machine learning find winning combinations faster.
When you add too many headlines, you often dilute your message. Instead of 15 average lines, focus on 5 that clearly communicate your offer, product value, and intent.
Think of it less as “filling all the slots” and more as curating a set of your best angles.
Once those are live, the key is to understand which headlines are actually pulling their weight. Not every idea will perform equally well, and that’s okay.
The trick is to identify your winners and replace the weaker ones without wasting hours in spreadsheets or the Google Ads interface.
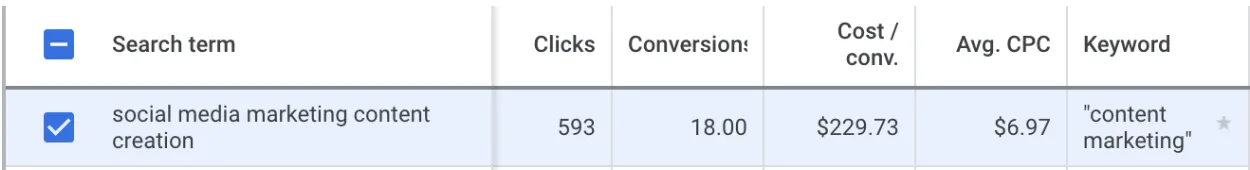
This tool breaks your Responsive Search Ads into individual parts: headlines, descriptions, and complete ads, and shows you how each is performing. You can instantly spot which headlines attract clicks/conversions and which ones might be holding you back.
It also offers AI-powered headline and description suggestions based on your ad data.
You can review, tweak, or apply those ideas directly, making it simple to test new variations without starting from scratch.
And if you need to clean up your ads in bulk, say, update an outdated offer or replace “AdWords” with “Google Ads” across all your campaigns, the Find & Replace feature handles it in seconds.
2. Combine broad and specific messages
When writing RSA headlines, I always mix broad messages with specific, intent-driven ones. Broad lines like “Shop the Latest Running Shoes” or “Free Shipping on All Orders” help your ad match a wide range of searches.
But it’s the specific ones, “Buy Nike Pegasus 40 Women’s Shoes” or “Trail Running Shoes for Rainy Weather,” that drive real relevance when users know exactly what they want.
The balance between the two is key.
Too broad, and your ads feel generic. Too narrow, and you miss bigger audiences. If you’re doing this manually, it can take time. That’s where Optmyzr’s A/B testing tool can help.
It automatically compares your ads in the same ad group and shows which ones are performing better based on real data, like CTR, conversions, or cost per conversion.
You can quickly spot which ad copy is winning, pause the weaker ones, and use insights from the best performers to create new variations.
And if you’re short on time, the AI suggestions are always there to help!
3. Use pinning thoughtfully
Pinning can be a great tool, but it’s one of the most misunderstood parts of Responsive Search Ads. I often see advertisers pinning far too many headlines or descriptions, trying to “lock in” what they think will perform best.
However, every time you pin, you reduce Google’s ability to test combinations and learn what actually works.
Pin only when it’s absolutely necessary, like keeping your brand name or a key promo message in a specific position (“Save 50% During Black Week,” for example).
Beyond that, trust the system to do its job.
Of course, it helps to have visibility into what’s pinned and how those assets perform, and that’s where the ad text optimization can help again!
4. Ensure relevance to keywords
I cannot emphasize this rule enough: include your main keywords in your headlines.
When someone searches for “Nike running shoes,” it feels natural and reassuring to see that exact phrase appear in the ad. It signals, “Yes, this ad matches what I’m looking for.”
Even small changes like swapping “Shop the Latest Shoes” for “Shop Nike Running Shoes” can lift your CTR and make your ads feel more personalized.
This isn’t just about optimization metrics; it’s about user experience.
People want to see their own language reflected back to them. It builds trust and helps Google understand your ad’s relevance, which can improve your Quality Score too.
So before you launch, take a moment to check: do your headlines truly echo what your customers are typing into the search bar?
5. Test, test, test
Responsive Search Ads are never “finished.” That’s the mindset I always keep. You don’t write a few headlines, launch the ad, and move on.
You test, learn, and adjust continuously. The trick is not to overhaul everything at once.
Small, gradual changes teach you more over time. Replace one weak headline, try a different call to action, or test a more specific message against a broader one.
Every small improvement compounds.
If you’re starting fresh or want to add new variations, the Create Responsive Search Ads tool can help you build them quickly.
It automatically looks at your existing ads, finds which headlines and descriptions have the best click-through rates, and suggests new combinations. You can review those suggestions, make tweaks, and upload them straight to your Google Ads account (without manual copy-pasting).
Once your new versions are running, you can also use A/B Testing for Ads in Optmyzr to compare their performance.
6. Use assets and extensions with RSAs
Responsive Search Ads work best when you support them with the right assets and extensions. Think of your RSA as the headline (the main story), and your extensions as the supporting details that make the ad more complete.
Sitelinks, callouts, structured snippets, and image extensions don’t just make your ads bigger; they make them more useful.
A sitelink can guide people to your most popular products or landing pages. A callout like “Free Returns” or “24/7 Support” adds confidence.
And image extensions help you stand out visually on a crowded results page.
These extra pieces do more than fill space: they give your ad context, personality, and a stronger reason to click.
7. Focus on a clear CTA
Even though Responsive Search Ads combine multiple headlines and descriptions, you still need one clear, consistent call to action.
Your CTA should tell the user exactly what to do next: “Shop Now,” “Book a Demo,” “Get a Free Quote.” Simple and direct always beats clever but confusing.
The mistake many advertisers make is trying to include too many CTAs in one ad. When every headline says something different: “Learn More,” “Buy Today,” “Sign Up Now,” the message becomes scattered, and the intent gets lost.
Pick one direction, make it visible in at least one headline and one description, and let the rest of the copy support that message.
A clear, confident CTA is like a final nudge; it turns attention into action.
8. Avoid pitfalls
If you can offer next-day delivery, definitely use it; it’s a strong selling point.
But if your delivery time is 14 days, it’s better to leave that out of your headline. Overpromising might win the click, but it will cost you trust later.
The same goes for exaggerated claims or outdated offers.
Your ad copy should be as honest as it is persuasive. If a competitor is promising something you can’t realistically match, focus instead on what you do best, maybe reliability, product quality, or customer service.
Still, mistakes and weak ads can slip through, especially when you’re running hundreds of campaigns. That’s where Optmyzr’s Rule Engine can save you time.
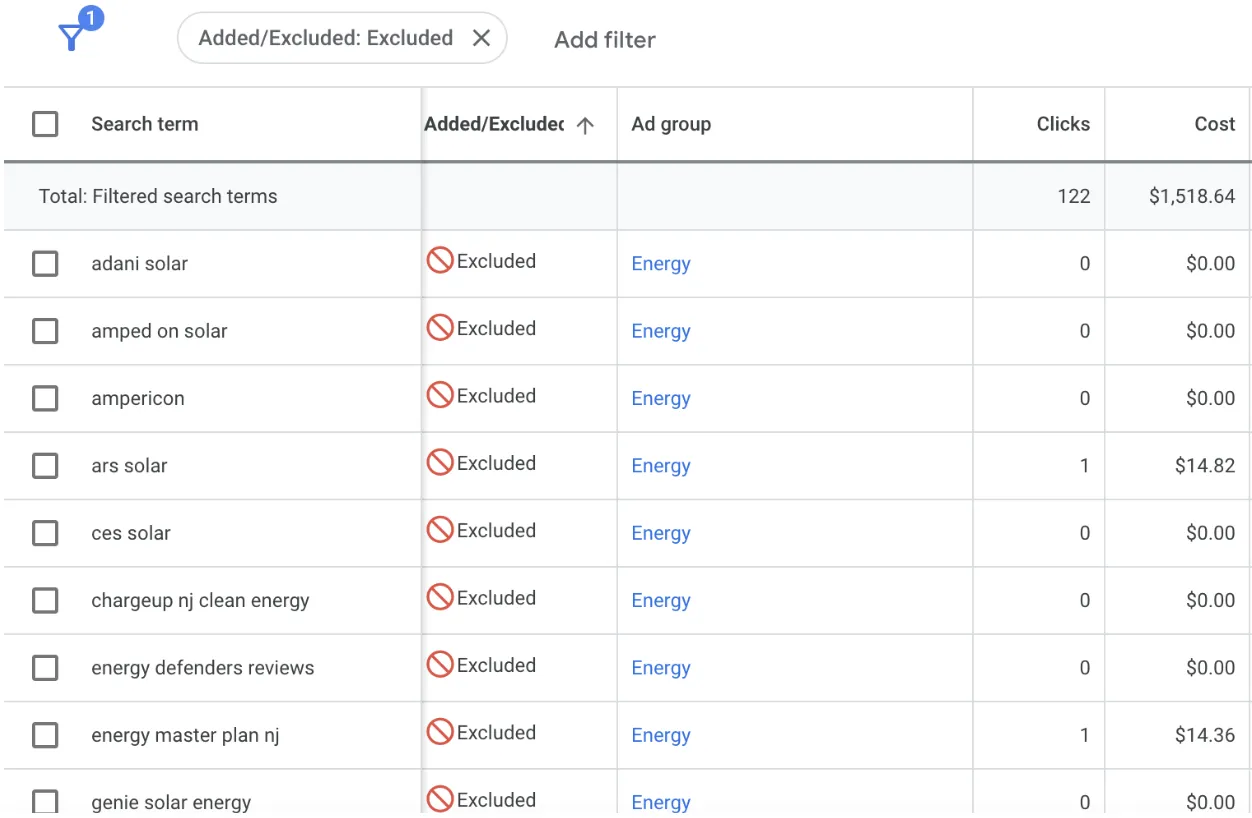
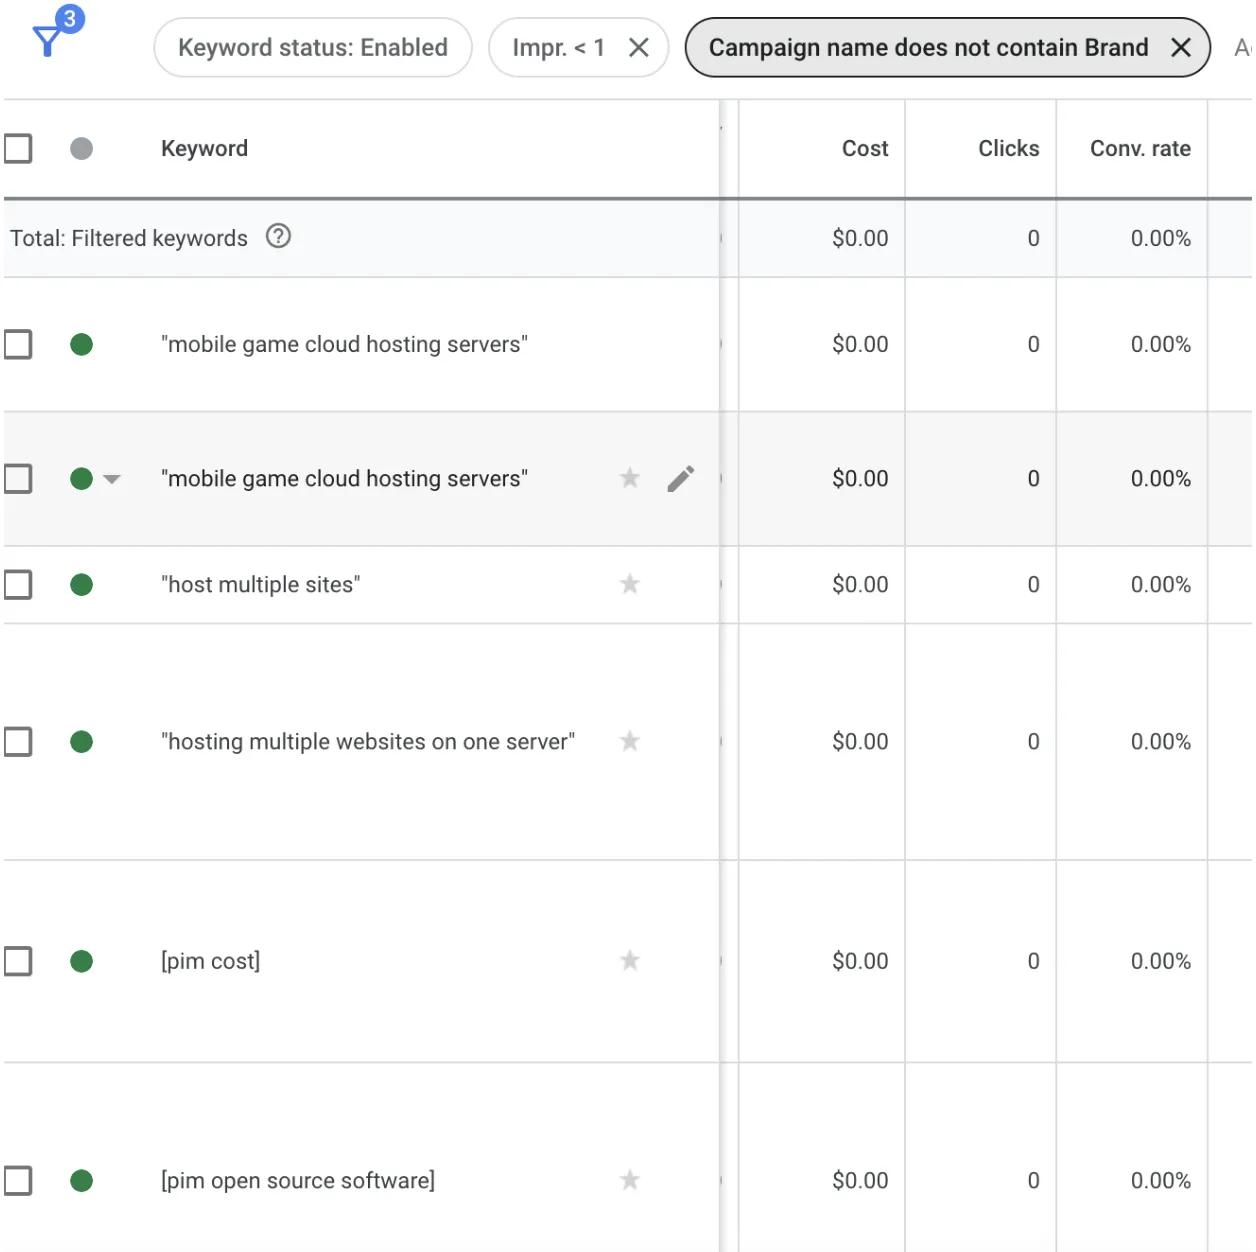
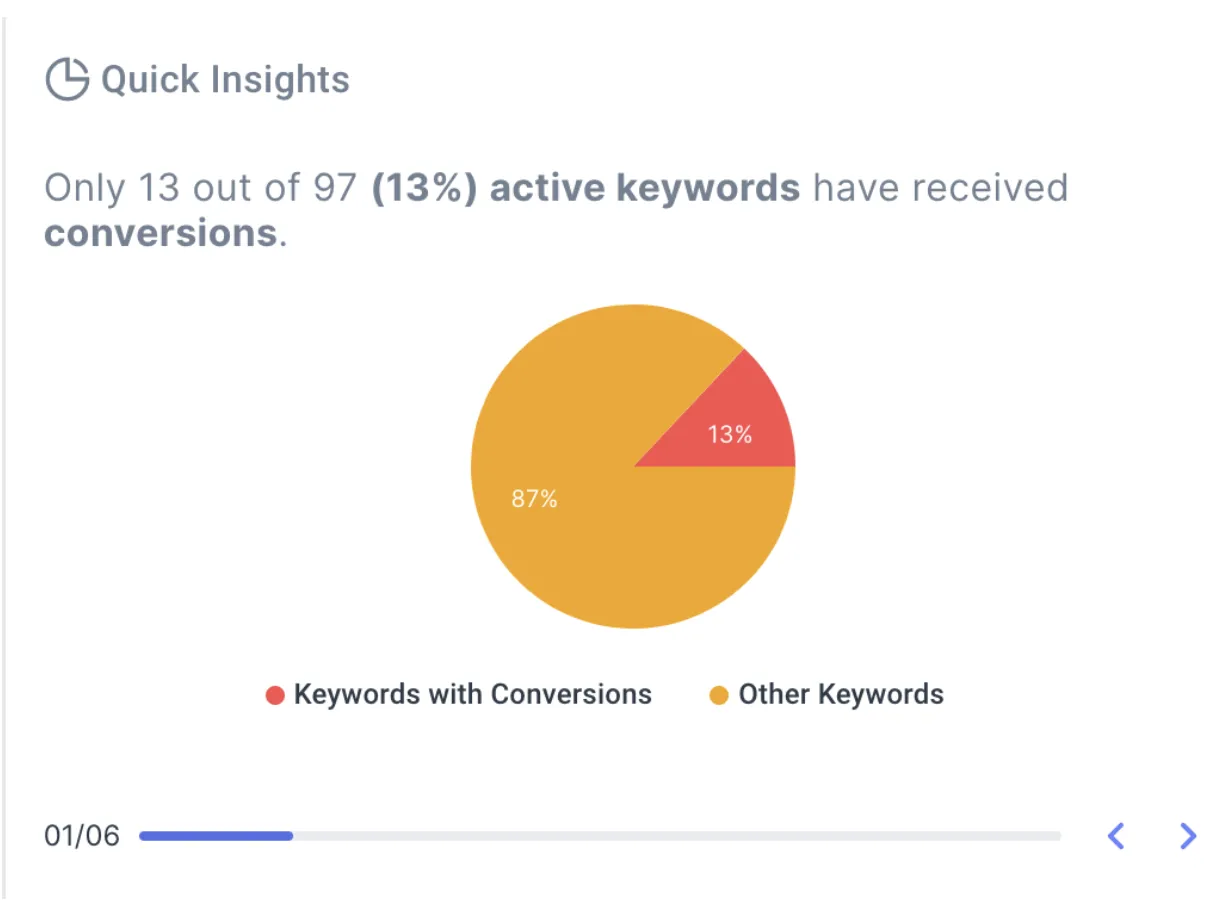
You can set simple rules, like “show me all RSAs that haven’t had any conversions in the past 30 days but are still getting clicks.”
Once you set that rule, Optmyzr will automatically flag those ads and group them in a report, so you can review and fix them before they waste more budget.
It’s a quick way to spot underperforming or risky ads early, whether that means poor ad strength, outdated messaging, or just a copy that’s not connecting anymore.
That way, you spend less time hunting for problems and more time improving the ads that actually work.
Make every RSA work smarter with Optmyzr.
Responsive Search Ads can look unpredictable from the outside, but once you understand how they learn, they become much easier to shape.
Follow these rules, keep testing, and stay honest in your messaging. Over time, small improvements add up to big wins.
And when you combine a clear strategy with the right tools, RSAs start feeling like one of the most powerful parts of your account. That’s exactly where Optmyzr can help.
Start your 14-day free trial today and see how smarter automation and better insights can take your RSAs and your overall account to the next level!
Sign up for more Google Ads tips at SavvyRevenue’s newsletter.
Morten Paamejer is a Senior PPC Specialist at SavvyRevenue, where he helps eCommerce brands grow through data-driven Google Ads strategies and smart account optimization. With a background in digital marketing and several years of experience at agencies like LAZZAWEB, Morten has developed a strong focus on scaling campaigns efficiently while keeping profitability top of mind.
This article is a reflection of the author’s experiences and opinions. Optmyzr believes that there are many ways to win in digital advertising, and is committed to presenting a diverse range of ideas and approaches.
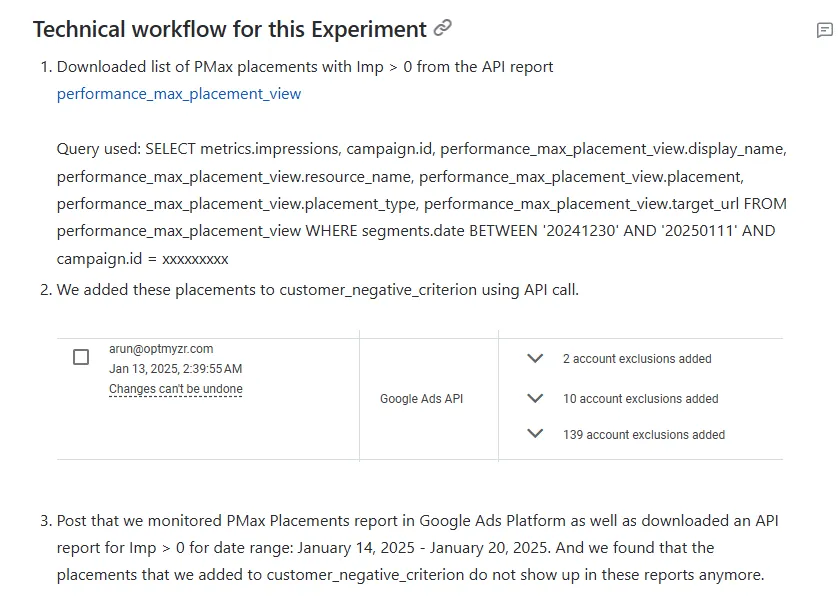
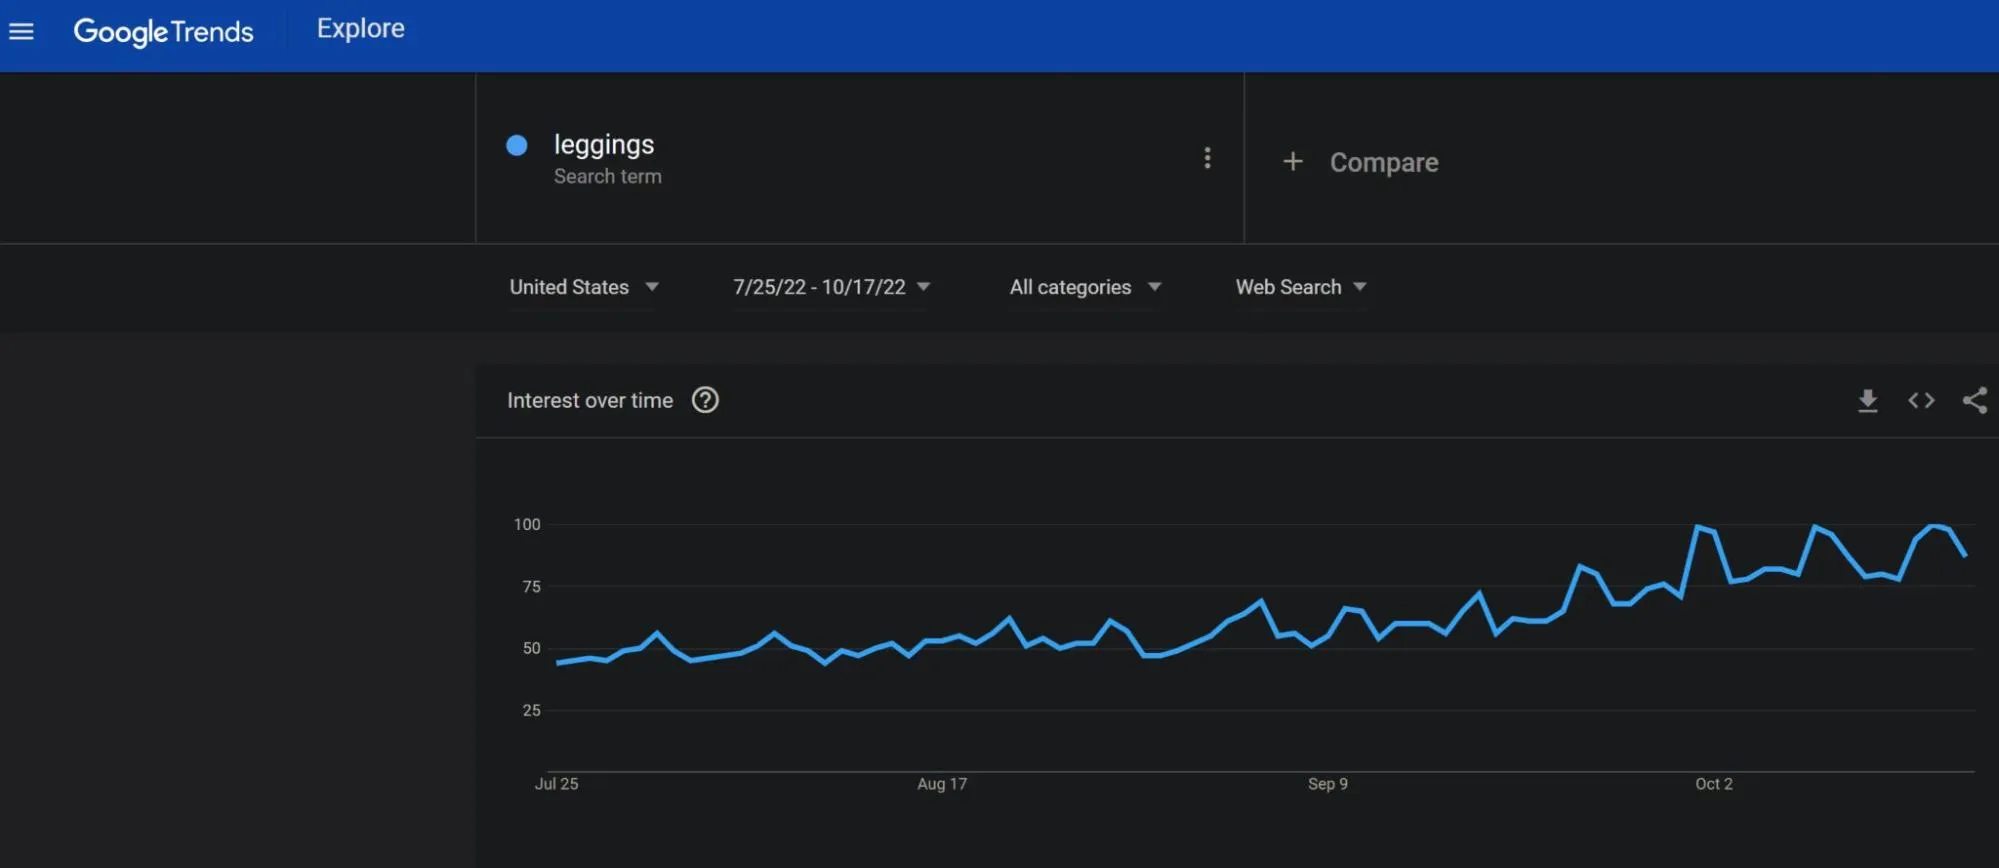
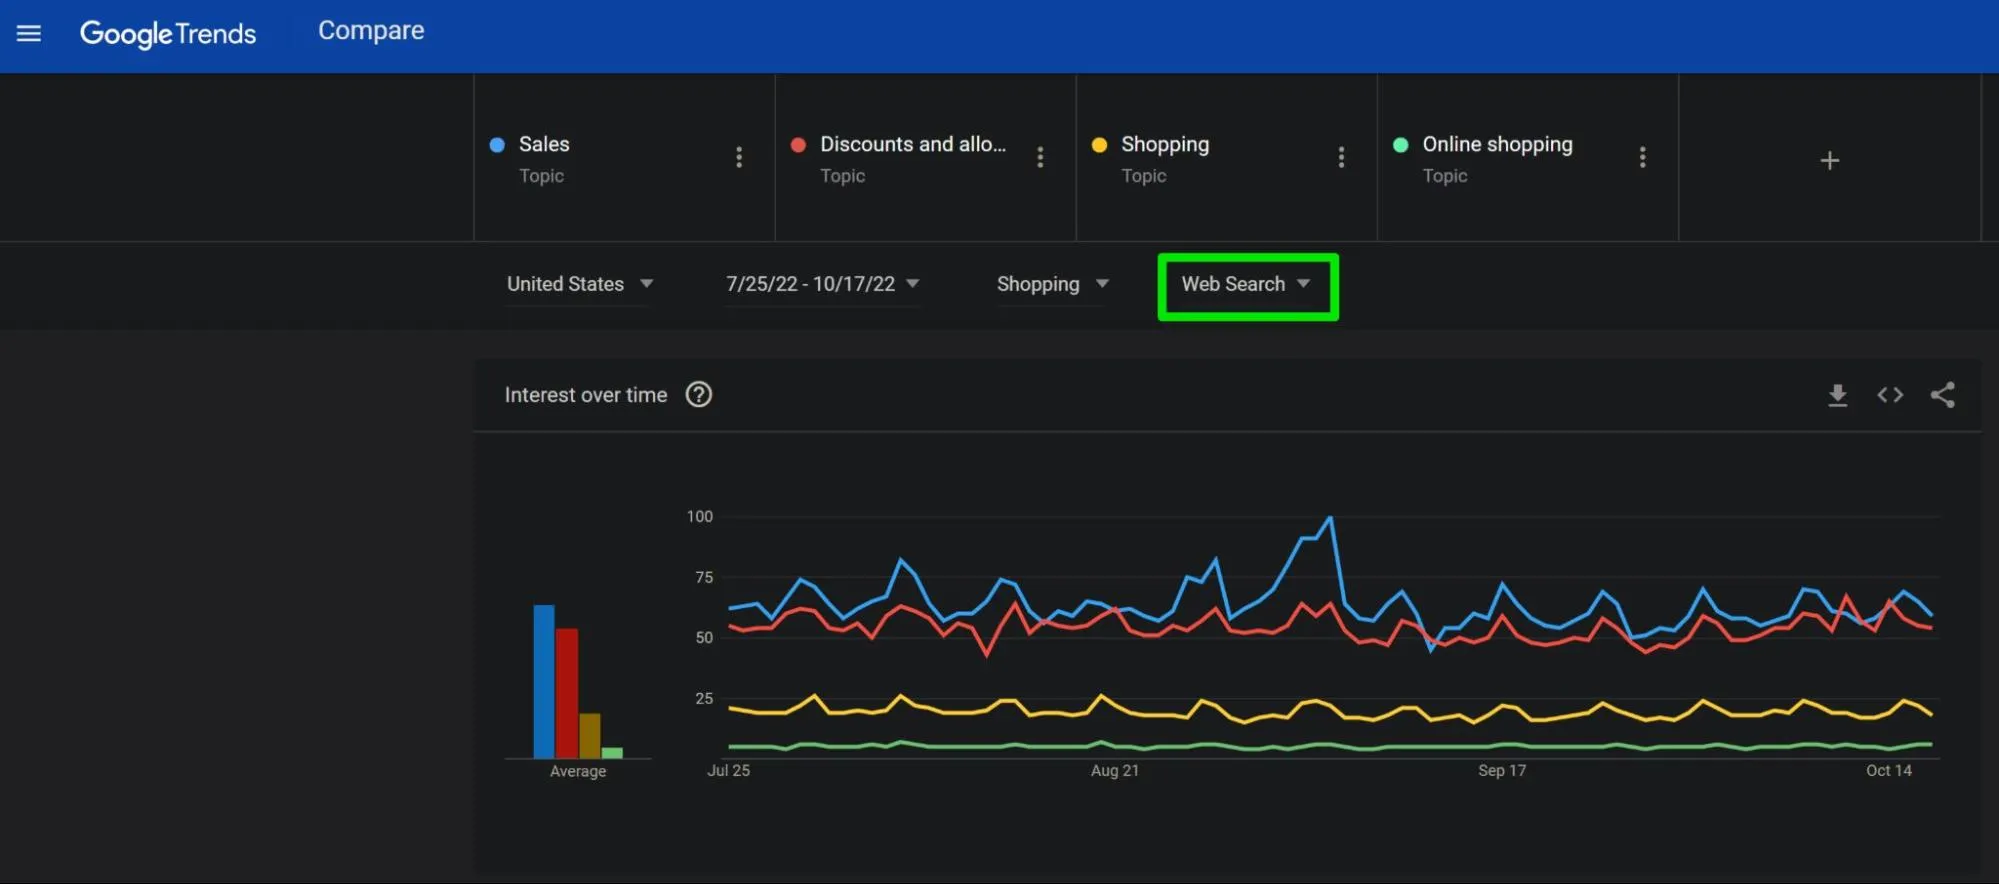
On July 23, 2025, Amazon abruptly pulled all its ads from Google shopping. The move disrupted the paid search ecosystem almost overnight. As one of Google’s biggest and savviest advertisers, Amazon’s exit gave us a rare look at what happens when a major player disappears from the auction.
At Optmyzr, we analyzed data from thousands of advertiser accounts to understand the immediate impact. The results challenge a familiar belief: that less competition means better outcomes. They also offer lessons for brands adjusting to sudden market shifts.
Amazon didn’t wind things down or test a new strategy. They pulled out of Google shopping ads completely and without warning. That created a rare chance to see how Google’s ad auctions respond when a major bidder suddenly vanishes.
In Google’s auction system, advertisers compete in real-time for ad placements based on their bids, ad quality, and expected impact. When a major player like Amazon exits, they don’t just free up a few ad slots. Their absence reshapes the competitive landscape across every keyword, audience, and placement they used to touch.
Our analysis methodology
To isolate the true impact of Amazon’s departure from seasonal effects, we used a precise 7-day comparison methodology with the strictest account matching criteria:
Study period: July 16-22, 2025 vs July 23-29, 2025 Why this matters: We skipped Prime Day (July 8–11) and balanced the weekdays across both weeks. Dataset: Perfect account matching with identical advertiser pools in both periods Requirements:
Accounts must have 3+ days overall in both periods
Accounts must appear in the same shopping ads category in both periods
Accounts must have 3+ days within that category in both periods
This clean comparison lets us tie changes to Amazon’s exit rather than promotional calendar effects, day-of-week variations, or account churn.
Caveats: Conversion lag in ecommerce
Some ecommerce categories have longer paths to purchase. This means part of the conversion value may not have shown up in our initial 7-day window. A lower observed conversion value doesn’t always mean poor performance — it might just reflect a time lag.
To account for this, we’ll re-run the study using the same time window but pull data 30 days later. That way, we can measure any additional revenue that accrues over time and ensure the findings reflect true long-term performance.
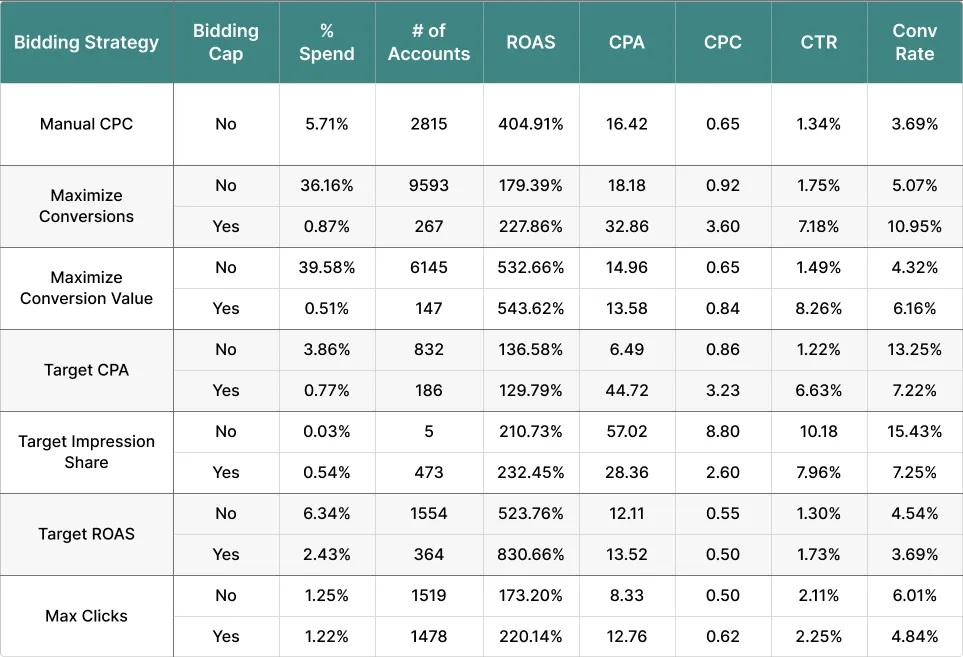
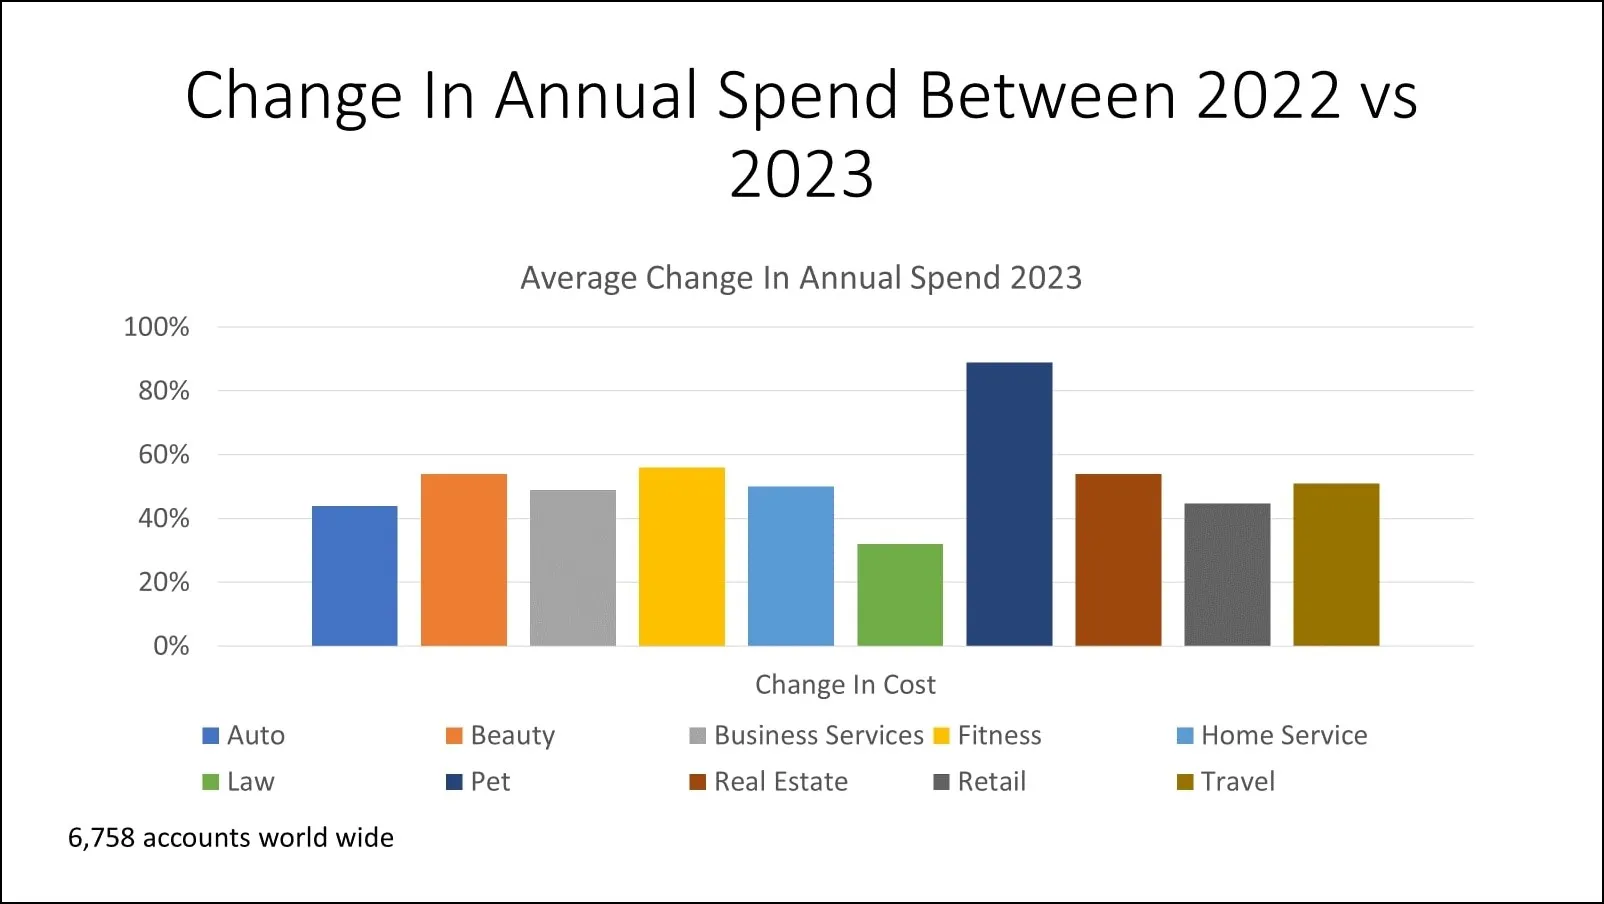
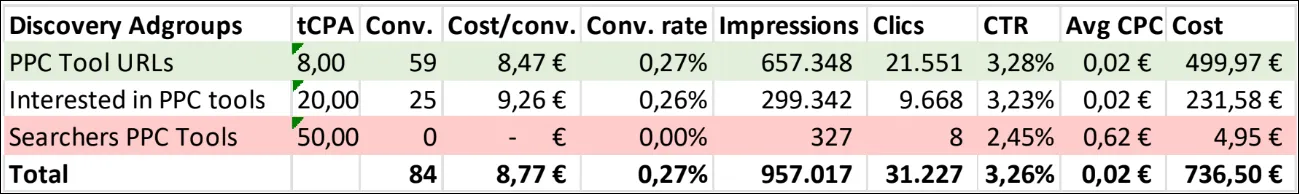
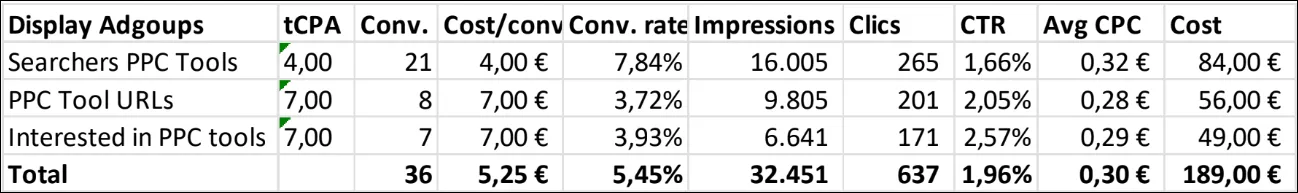
Overall market impact: More volume, less value
The data tells a surprising story: less competition doesn’t always help the advertisers left behind.
Key Insight: Advertisers got more clicks for less money, but the value of those clicks dropped. It suggests many of those extra clicks came from people looking for Amazon. When they landed on competitor ads, they brought expectations around price, shipping, and convenience that few brands could match.
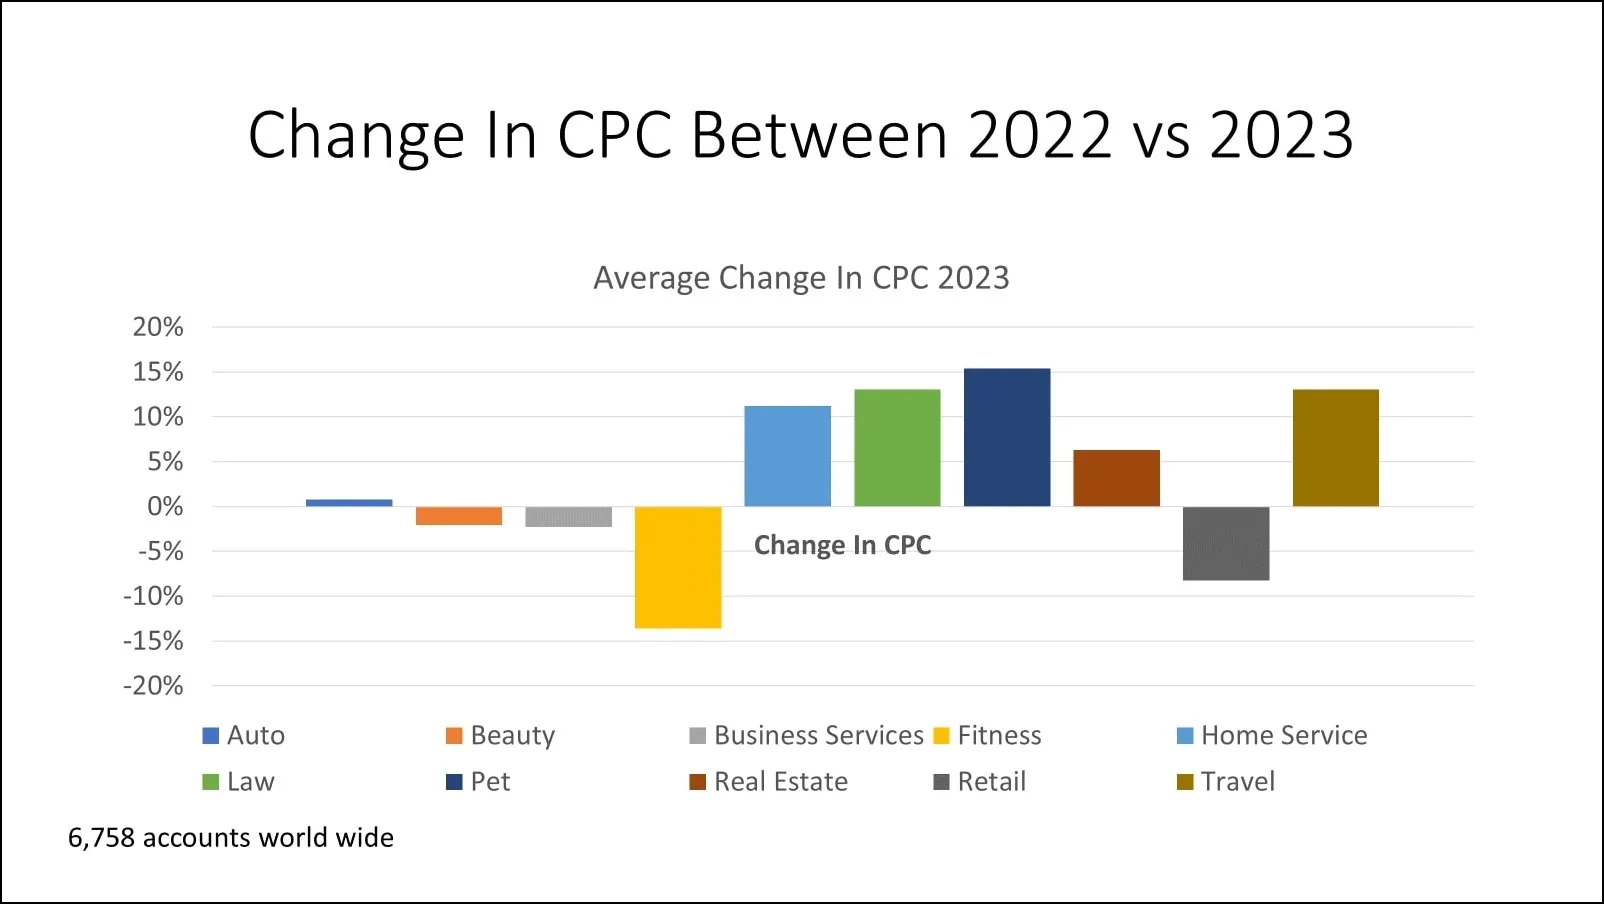
The consumer expectation trap
The standout insight: volume went up, but value went down. Advertisers saw:
8.3% lower CPCs — looks good on the surface
7.8% more clicks — more traffic, more chances
5.5% drop in conversion value — less revenue from that extra traffic
The pattern points to buyer behavior. Shoppers looking for Amazon clicked elsewhere, but still expected Amazon-level pricing, speed, and ease. When competitors couldn’t match these expectations, conversion rates and values suffered.
For PPC managers, this highlights the danger of the “volume trap”—celebrating increased traffic without considering whether that traffic genuinely aligns with your value proposition.
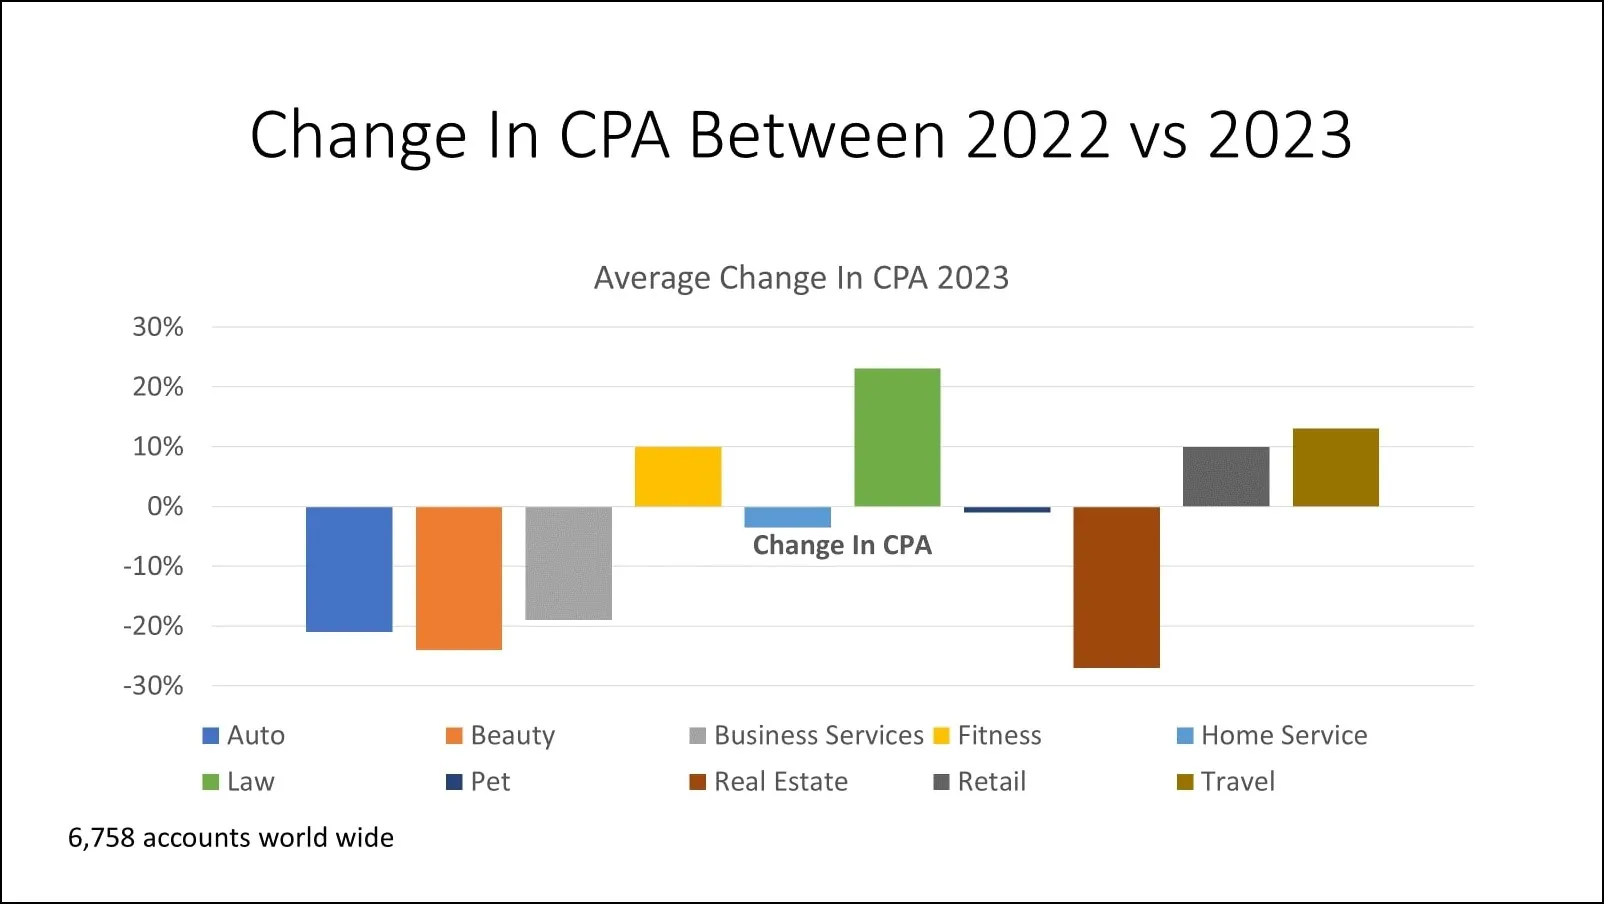
Category-by-category breakdown: Winners and losers
The impact varied dramatically across different industry verticals, revealing which types of businesses were best positioned to capitalize on Amazon’s departure.
Electronics: The clear winner
Electronics brands were best positioned to gain from Amazon’s exit. Big players like Best Buy and Apple can compete on the same things Amazon excels at: fast delivery, strong pricing, and trusted fulfillment.
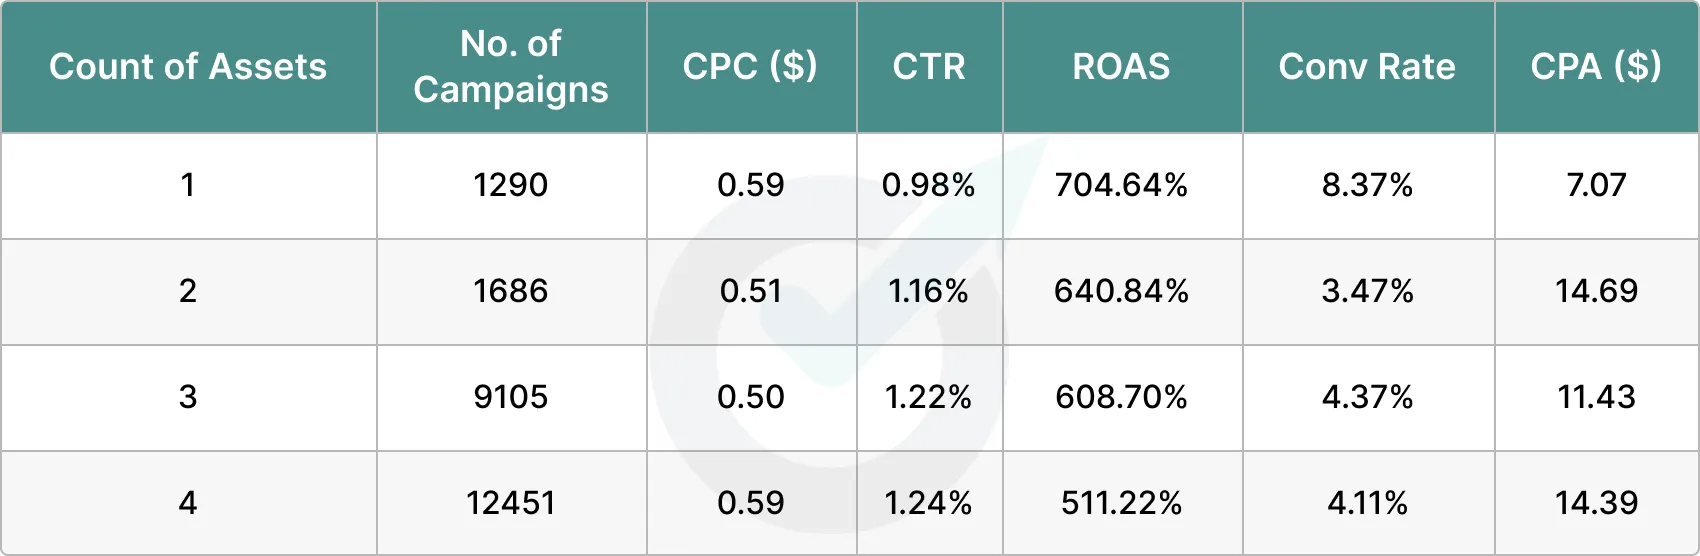
Electronics was the only major category to see increases across all key value metrics: conversions (+81.3%), conversion value (+10.9%), and ROAS (+7.1%).
Despite a moderate increase in impressions (+11.4%) and clicks (+11.5%), these advertisers successfully converted the Amazon-displaced traffic at higher rates and values, likely because they could satisfy consumers’ expectations for fast, convenient delivery and competitive pricing.
Home & Garden: The volume puzzle
Home & Garden presents an interesting case study in the volume trap phenomenon, with significant traffic increases but declining value metrics.
The pattern—significant click growth (+13.1%) and stable cost (+0.2%) but declining conversion value (-7.5%) and ROAS (-7.7%)—suggests Amazon-seeking consumers found home & garden alternatives but made lower-value purchases or were more price-sensitive than typical customers.
Sporting Goods: The volume trap exemplified
Sporting Goods represents perhaps the clearest example of the “volume trap” phenomenon we’ve been describing.
This category saw substantial conversion volume increases (+20.7%) and improved conversion rates (+15.7%) with minimal traffic growth (+4.3% clicks), yet experienced significant value decline (-9.9%) and ROAS deterioration (-8.0%).
Likely explanation: shoppers landed on competitor sites, but bought cheaper gear or held back due to price.
Health & Beauty: Stable volume, flat value
Health & Beauty brands picked up the extra traffic, but couldn’t hold onto revenue per sale.
Despite achieving 14.6% more conversions from Amazon-displaced traffic, conversion value remained essentially flat (+0.3%). Translation: those new conversions were worth a lot less than usual. If quality stayed the same, revenue should have risen in lockstep. But thanks to new clicks being cheaper (-11.5%), ROAS slightly rose (+1.1%).
Tools and Hardware: Similar consumer expectation challenges
Tools and Hardware followed the same pattern as Sporting Goods — more conversions, but lower value.
Like Sporting Goods, this category captured significantly more Amazon-displaced conversions (+14.7%) with improved conversion rates (+7.1%) but struggled to extract the same value per conversion (-6.3% value, -5.9% ROAS), likely due to consumer expectations around pricing and convenience that Amazon had established.
Vehicles & Parts: High-value category decline
Vehicles & Parts showed concerning trends across both volume and value metrics.
Despite modest click growth (+4.8%) and reduced costs (-5.3%), the category experienced declining conversion value (-5.3%), suggesting that Amazon-seeking consumers in this category had different purchase behaviors or price expectations. But like Health & Beauty, the reduction in CPC (-9.6%) helped protect the ROAS (+0.1%)
Apparel & Accessories: Large volume, declining value
As the largest category by volume, Apparel & Accessories demonstrates the volume trap at scale.
Despite representing the largest volume of traffic, Apparel & Accessories saw declining performance across key metrics, with conversion value dropping 9.5% and ROAS declining 7.3%. This suggests that Amazon-seeking fashion consumers had strong expectations around pricing, selection, and return policies that competitors struggled to match.
Arts & Entertainment: The content value challenge
Arts & Entertainment showed mixed results, with increased traffic but declining conversion metrics.
This category achieved significant click growth (+15.4%) but saw concerning declines in conversion rate (-19.9%) and ROAS (-8.3%), suggesting that displaced Amazon traffic in entertainment categories had different engagement patterns or value expectations.
Furniture: Stable volume, value concerns
Furniture presents an interesting anomaly with stable click volume but declining conversion value.
The pattern—stable clicks (+0.8%) and conversion volume (+2.0%) but dramatically lower conversion value (-11.7%) and ROAS (-8.8%)—suggests a fundamental shift in purchase behavior. Despite reduced costs, the significant value decline indicates consumers may have been purchasing lower-priced items or single pieces rather than complete furniture sets.
What this means for your Google Ads strategy
Different categories reacted in different ways — but the patterns offer clear takeaways for PPC teams:
1. Assess your competitive position against Amazon’s value proposition
Electronics succeeded because major players like Best Buy and Apple can match Amazon’s delivery speed and pricing. In contrast, most other categories saw the classic “volume trap”—more traffic but less value as Amazon-seeking consumers brought different expectations.
2. Recognize the volume trap early
Categories like Sporting Goods (+20.7% conversions, -9.9% value) and Health & Beauty (+14.6% conversions, +0.3% value) show how increased traffic can mask underlying performance degradation. Always track value, not just volume.
3. Learn from true success vs. volume traps
Only Electronics truly succeeded with positive conversion value (+10.9%) and ROAS growth (+7.1%). Everyone else hit some version of the volume trap — more clicks, but less to show for it.
4. Understand your category’s vulnerability
If you compete on Amazon’s turf — price, speed, convenience — you’re more exposed. The data shows widespread expectation mismatches across these categories.
5. Focus on sustainable competitive advantages
Rather than simply trying to capture displaced Amazon traffic, develop positioning that attracts consumers who genuinely value your specific offerings.
Why displaced traffic isn’t free traffic
Amazon’s exit highlights something critical: traffic doesn’t shift cleanly when a dominant player leaves. It drags along expectations most brands can’t meet — fast shipping, low prices, and frictionless buying.
That creates the volume trap: cheaper clicks, more traffic, and worse results. Unless you can actually match Amazon’s offer, you’ll struggle to turn those clicks into value.
For the Google Ads ecosystem, this suggests that major ecommerce advertisers play a crucial role not just in competing for inventory, but in training and conditioning consumer expectations. When they leave, shoppers don’t reset. They carry their shaped expectations into your funnel, whether you can meet them or not.
Takeaways for PPC advertisers
What PPC managers should take from all this:
Distinguish true success from volume traps
Only Electronics achieved both volume and value growth. Most categories experienced some form of the volume trap with declining efficiency.
Monitor ROAS alongside conversion metrics
Flat or growing conversion volume can hide declining profitability if conversion values decline or costs increase.
Evaluate displaced traffic quality
Amazon-seeking consumers bring specific expectations that most categories couldn’t meet profitably, leading to either lower conversion values or conversion rate declines.
Consider lifetime value implications
The only justification for accepting lower immediate ROAS is if the additional traffic represents new customers with strong repeat purchase potential.
Focus on sustainable differentiation
The successful Electronics category could match Amazon’s value proposition, while others struggled when competing on Amazon’s core strengths.
Displaced traffic isn’t neutral — it’s shaped by the brand that left. And unless you can meet those expectations or grow LTV fast, it’s traffic you’ll struggle to monetize.
As technology advances and privacy legislation evolves, Meta Ads has adapted accordingly, altering how we reach and connect with audiences on the way to accomplishing our advertising goals.
Behind the scenes, we have Andromeda, Meta’s next-gen ML engine that processes billions of signals to match ads with users in real time. Then we also have the Advantage+ campaigns on the front lines. These span sales, app installs, and now even lead gen. It can automate targeting, creative testing, and budget allocation for peak efficiency
Clearly, we have moved from the hyper-segmentation of audiences and reliance on interest and behavioral targeting to seeing the rise and fall of many custom audiences, such as lookalikes. Now, AI does the heavy lifting, excelling at identifying our target audiences that are most likely to take the actions we specify.
In this guide, we’ll walk through the latest Meta Ads targeting strategies that will help you successfully find and engage customers.
Demographic and detailed targeting for all brands
Before we cover the strategies that I (and many other advertisers) find works best at the moment, let’s address all currently available targeting options—both new and old.
Understanding all of the options helps you determine what type of targeting you want to test to see what works best for your brand, goals, budget, and time so you know exactly where to start.
Depending on the selected campaign objective, in the ad set level, under “Audience controls,” you will see demographic targeting options that include location, age, and language (if you only see location targeting, click the “show more options” link to see age and language options). These are the primary controls for your targeting.
“Choosing a broad area to show your ads within can improve results,” Meta recommends within Ad Manager, “For example, by adding a country instead of several cities.” In my geo-targeting tests, I’ve found that to be accurate as well.
Interest and behavioral detailed targeting
When it comes to detailed targeting, you can target by interests, behaviors, and other demographics. Meta has long been renowned for its precise targeting capabilities, enabling advertisers to find innovative ways to reach their audiences.
However, with the evolution of privacy laws, advertisers have lost many detailed targeting options, decreasing their effectiveness over the last few years.
This doesn’t mean you should abandon these options entirely, but it’s important to note that targeting has (and will continue to) evolve. This shift might indicate a future where traditional targeting methods, such as detailed targeting, may be obsolete. Instead, we’ll likely rely more on machine learning to identify the individuals most likely to achieve our campaign objectives.
If you’re interested in using these targeting options as a standalone test or in conjunction with Advantage+ audiences, you can access them in the “Advantage+ audience” menu (if you don’t see it, click the “Audience suggestion (optional)” button to reveal it).
Detailed targeting for niche brands
If you work for a brand targeting specific job titles (e.g., nurses) or selling niche products (e.g., specialized automobile parts, solar panels, wine), consider using detailed targeting.
This approach can help you gauge effectiveness against broader targeting options, like Advantage+ audiences (which I’ll cover in a later section). You can manually input relevant keywords to see related suggestions, bundle these audiences together for a larger audience to target, and explore other demographics, such as education, relationships, finances, and more.
Make sure to test various strategies to more accurately determine the best approach to reach your desired audience.
It’s also important to remember that niche targeting often means smaller, so you need to watch it closely. If your audience is too narrow, your campaigns may struggle to exit the learning phase, resulting in higher CPMs and inconsistent performance. Track performance visibility and delivery metrics early to decide whether to expand your audience or rethink your segmentation.
Test a few combinations to see what drives the best engagement, then double down on the highest-value segments.
Ecommerce should use Advantage+ shopping campaigns
If you work in ecommerce, consider using Advantage+ Shopping Campaigns (ASC), which offer a more streamlined approach. These campaigns utilize broader targeting, and the only option you can edit is location.
If you’re not in ecommerce, other campaign types (such as the one for leads) feature a more simplified setup with fewer targeting options at the ad-set level. These AI-driven, simplified targeting campaign structures rely on broader targeting and fewer restrictions to deliver better results.
Also, since targeting is largely locked down, your creative becomes your main lever for differentiation. Test multiple variations—formats, messaging, visuals, to feed Meta’s AI with the data it needs to optimize performance. Larger creative libraries can help campaigns exit the learning phase faster and stabilize performance.
💡Pro Tip: Optmyzr’s Rule Engine allows you to automate monitoring. For example, you can create a custom strategy that flags ads with rising cost per result or dropping CTR. Both are early signs of fatigue. The Rule Engine shows suggestions and even lets you automate fixes, so you don’t have to manually check performance every day.
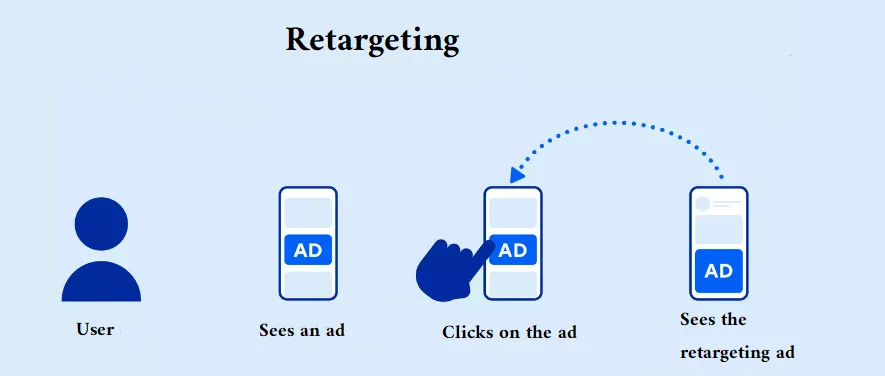
Create custom audiences for prospecting and retargeting
Meta offers an option in the Audiences area of Ads Manager where you can set up custom audiences using customer or lead contacts, website traffic, app users, or Meta’s data (e.g., engagers) for your inclusion or exclusion targeting, for both prospecting and retargeting campaigns.
You can set up a variety of custom audiences using your sources or Meta sources, such as:
Each of the available custom audience types has a retention time lookback window. I typically recommend a longer lookback window so that you have a larger audience pool—this helps the system better serve your ads, with more people seeing your ads, so they will not be saturated as quickly as smaller audiences.
In Optmyzr’s Social Campaign Manager, you can create and organize your custom audiences, then link them directly to new or existing campaigns.
Commonly used custom audiences
Here is a list of some common custom audiences advertisers use for prospecting and retargeting that you may also want to consider:
Website visitors
Leads
Newsletter subscribers
Customers
People who viewed your products in your catalog
Facebook engagers
Instagram engagers
Many of the above are warmer audiences that you can use in your retargeting efforts (or exclude from your prospecting campaigns).
While some advertisers still swear by exclusions, others do not, as some have found that (with privacy changes) they are not as effective as they once were. But again, I encourage you to test; the worst that may happen when implementing them is that they won’t actually exclude some people.
You can also create lookalike audiences from the custom audiences above and utilize them in your prospective campaign targeting to reach new people.
Lookalike audiences and how to use them
A ‘lookalike’ audience is an audience that looks like your original audience, but is composed of new people. For example, if you create a customer lookalike audience, Meta will create a new audience of people that look like your customers—based on the interest and behavioral data that Meta Ads has—which you can use to find more people that may be more likely to convert.
You can designate a percentage of deviation when setting up a lookalike audience. The lower the percentage, the more similar the new audience will be to your initial audience. The larger the percentage, the broader and less similar it will be to your initial audience. I typically recommend testing 1% first and then gradually testing larger percentage lookalike audiences to see if you can achieve more or better results.
Leverage Advantage+ audiences for scalable growth
Although you still have access to the targeting options I explained above, you may have noticed that Meta is making detailed targeting less accessible (often hiding it within dropdown menus). Many advertisers, including myself, foresee detailed targeting eventually disappearing, given the gradual removal of older options.
Even so, don’t let this trend deter you from testing detailed targeting. Instead, use it in conjunction with broader targeting options, such as Advantage+ audiences.
The Advantage+ audience option in the ad-set level uses Meta’s ad technology to automatically find your audience, and it does so quite efficiently.
With Advantage+ audience targeting, you can add a suggested audience to help the system identify your target audience more effectively. This enables the system to prioritize specific criteria to find individuals that closely match your desired profile before broadening the search. Additionally, you can adjust the age and gender of your audience and apply detailed targeting (as discussed earlier).
Over the past year of testing with Advantage+ audiences, I’ve tested targeting some warmer custom audiences (like website visitors, leads, and engagers) to using no suggested audiences at all. My findings indicate greater success when I leveraged Meta’s data-rich, in-platform audiences over my client’s email lists and pixel data. In particular, Facebook and Instagram engagers over the last 90 days were the top-performing audiences.
This means that you will target both warmer and cold audiences in one ad set, so your creatives need to work double duty—balancing credibility and brand trust with clear value props for new users. A/B testing different creative formats and messaging is especially crucial here, since Advantage+ campaigns optimize based on performance signals.
When it comes to targeting, this has become my go-to strategy to find more customers that convert at higher volume, rates, and returns compared to all of the others that are currently available and shared in this article. I highly recommend testing this approach in your account(s) while also testing others (if your budget allows).
To make that process easier, you can use the Ad Analyzer to track creative performance across Advantage+ campaigns. You can filter ads by declining CTR or rising costs per result, helping you catch fatigue early and pinpoint which formats or messages are pulling their weight.
Use saved audiences for better efficiency and consistency
Save time by saving audiences whenever you create manual audiences to test alongside broader targeting campaigns and ad sets. This allows you to easily resume the audience in the future for other campaigns, without the need to recreate it from scratch, allowing you to launch your social campaigns faster.
In the ad-set level (under Advantage+ audience, below all of the targeting options), there is a “Save audience” button you can click. A pop-up window that summarizes the audience will appear and give you the option to name it so you can easily locate it later.
Improve ad spend efficiency with exclusion audiences
While exclusion audiences don’t flawlessly exclude every person in them (due to the nature of privacy, technology, and match rates), they can still help improve your ad spend efficiency by not targeting some people. This can also help prevent ad fatigue among existing customers, avoid showing ads to irrelevant users, and improve performance —especially when you’re looking to scale without letting wasted spend sneak in.
How to Create Exclusion Audiences
To create an exclusion audience, follow the same steps (from above) as you would to create any custom audience. When it’s set up, populated, and ready to use, go to the ad-set level and under “Audience controls,” enter the name of your custom audience in the “Exclude these custom audiences” field.
Use Cases for Exclusion Audiences
During the hyper-segmentation era of paid marketing, exclusions were much more commonly and effectively used; but now, they are less effective in excluding people. At the same time, however, Meta’s targeting has improved.
In some instances, the most common use of exclusion audiences these days is in retargeting campaigns where advertisers exclude recent customers, leads, or purchasers, in order to preserve budget but also to avoid bombarding existing customers with more ads.
Create high-impact ads
Well-crafted ad copy increases the likelihood that your message resonates with your prospective customers, while creative elements like images and videos complement and enhance engagement to drive higher conversion rates.
Together, they create a cohesive, persuasive, and successful ad experience that effectively reaches and motivates your intended customers.
Best Practices for Compelling Ad Copy
When writing ad copy, consider your audience. Craft your ad copy to speak directly to them using language, tone, and references that resonate with pain points, their interests, familiarity with your brand, and how your product or service is a solution or benefit to them.
Use clear and concise copy so that people take the action you want them to (such as learning more, signing up, or shopping now). Get to the point quickly and avoid jargon so that there is no confusion.
While ads contain automatically embedded call-to-action (CTA) buttons, it’s also effective to clearly state what you want the viewer to do in the ad copy (e.g. learn more, sign up, shop now). Make it easy and intuitive for people to know what they should do next, leading them from the ad to the landing page.
If you are running sales or promotions, highlight these alongside unique selling points, special product features, limited time offers, or free shipping details.
Lean in to persuasiveness by adding customer testimonials, reviews, and statistics as that can increase trust and credibility.
Additionally, use urgency (especially in retargeting ads) to encourage immediate action so people don’t miss out on the sale or before a product runs out. Here is a great example of a customer review used very effectively in a clothing ad.
I too, often use five-star emojis on review ads to help draw more attention to them and to visually portray that it’s a well-rated product.
Tips for Creating Effective Images
For images, take high-resolution shots that are clear and visually appealing from various angles.
Make sure the focus remains on the product to prevent any confusion about what you are advertising.
Often, in full-body model images, I’ve seen comments on ads where people ask about where they can purchase various parts of the outfit when the brand intended to promote their jewelry. By concentrating on a single, clear message or product, you can improve performance.
Use minimal text overlays to ensure legibility on small screens and make sure the text complements your visuals.
Tips for Creating Effective Videos
Put your best foot forward in the first three seconds so that you can hook people in and they know exactly what you are advertising. No matter how interesting, entertaining, or helpful your video content is, people will drop off and continue scrolling if it’s not clear what they’re watching.
To improve view-thru rates and conversions, start with an intriguing question, compelling statement, or a striking visual in the first few seconds.
Optimize your video for silent viewing by including text overlays or captions so that your message is clear, even without sound, as this is essential for hearing-impaired viewers or those watching on mute.
The visuals alone should tell the story effectively. Here’s a great example from Ruggable, where the video ad starts with a compelling question:
As for video length, keep it short and ideally about 15–30 seconds. Shorter videos help you maintain viewer interest and convey more of your message concisely.
Lastly, close out your video with a strong call-to-action.
As you get started on creative asset development, understand the various ad placements across Meta’s properties and their specs, so your ads appear optimally and increase your chances for success.
Bringing it all together: Craft a comprehensive strategy for success
Understanding the various targeting options within Meta Ads will help you determine which ones are worth prioritizing for your advertising goals. Lean into the newer features to see what they are capable of so that you don’t fall behind on your advertising skills (which can ultimately hinder campaign success).
If your budget is limited, prioritize testing the more streamlined, AI-assisted targeting campaigns first alongside your current (or older) top performers and, as you gain more conversions, phase out the under-performing campaigns and assets.
Perpetual testing is a big portion of our role in social media advertising, so get comfortable in doing so and creating a process.
As you move forward, the ability to adapt and get creative will be key to your growth and success. By merging strategic targeting with high-impact creatives, you can create a comprehensive strategy that both engages and converts your audience.
As Meta Ads continues to evolve, test new ideas and targeting options, as that will help keep your campaigns thriving.
If you’re looking for a smarter way to manage Meta Ads across campaigns and clients, Optmyzr for Social brings everything under one roof—campaign setup, performance tracking, and optimization. Try it free for 14 days and see how much smoother your social workflow can be.
People also ask
Q. What are the different targeting options available in Meta ads?
Interest and behavior-based targeting, which spans interests, purchase behavior, tech usage, and more
Custom audiences, including website visitors, app users, CRM lists, and engagement-based segments
Lookalike audiences, which target new users resembling your custom audiences using Meta’s modeling
Advantage+ audiences, Meta’s AI-driven targeting option that automates audience matching using broad signals instead of manual settings
Q. What types of custom audiences can I create in Meta Ads?
A. You can build diverse custom audiences in Meta Ads, including:
Website visitors tracked via Meta Pixel
App activity users based on in-app actions
Customer/contact lists using email, phone, or user ID matches
Engagement-based audiences, such as people who’ve interacted on Facebook or Instagram (e.g., likes, comments, video views) These audiences are useful for both prospecting and retargeting campaigns, and can be used to create lookalike audiences for expansion
Q. What’s the best targeting strategy if I have a limited budget?
A. With constrained budgets, it’s recommended to:
Test Advantage+ audience campaigns first, as Meta’s AI handles much of the optimization work
Pair these with well-performing custom audiences like recent engagers or past buyers
Pause manual targeting sets if they underperform, ensuring spend is focused on strong signals
Keep creative quality high—since AI relies heavily on signal inputs, your creatives help Meta learn faster. This mix of broad AI-assisted reach balanced with targeted retargeting maximizes efficiency and results
Akvile DeFazio is the President of AKvertise, an award winning social media advertising agency. With 16 years of experience, she works with eCommerce, lead gen, app, travel, and event clients to reach their goals through future-forward strategies.
This article is a reflection of the author’s experiences and opinions. Optmyzr believes that there are many ways to win in digital advertising, and is committed to presenting a diverse range of ideas and approaches.
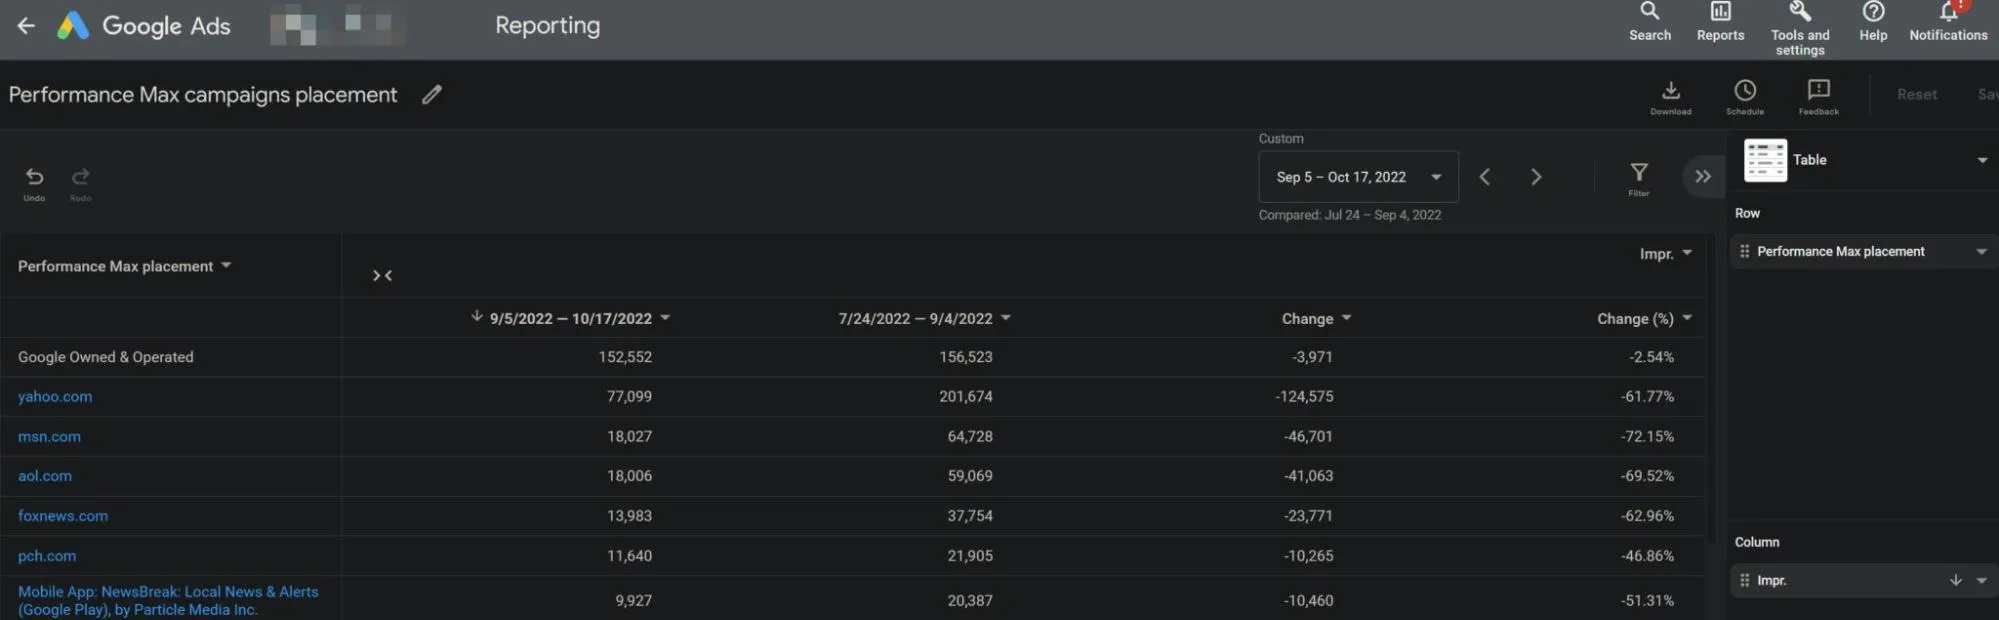
When Google launched Performance Max (PMax), it was positioned as the ultimate automated campaign, designed to unify and optimize ads across all of Google’s channels: Search, Shopping, YouTube, Display, and more.
But as many advertisers have found, adding PMax to the mix isn’t always additive. In fact, it might be quietly cannibalizing the performance of your most valuable Search campaigns.
At Optmyzr, we wanted to know just how often this happens and how much impact it has. So we dug into performance data from hundreds of accounts to see where and when PMax overlaps with Search.
The results might surprise you…
Why we ran this study
Advertisers love the control and predictability of Search campaigns. Performance Max, on the other hand, provides less control and is, by design, more opaque.
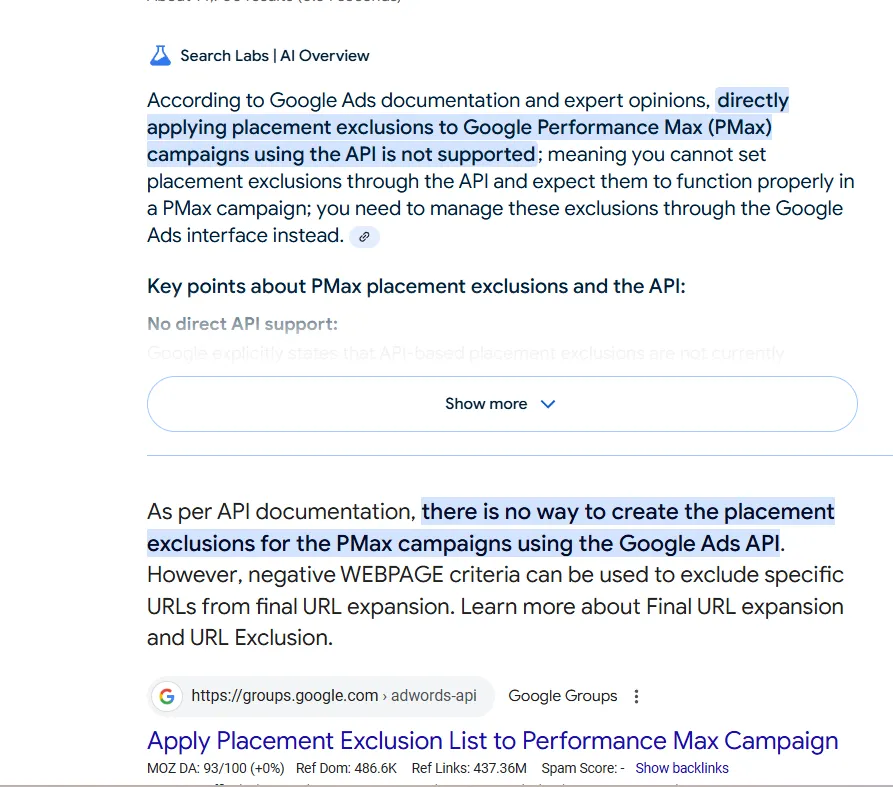
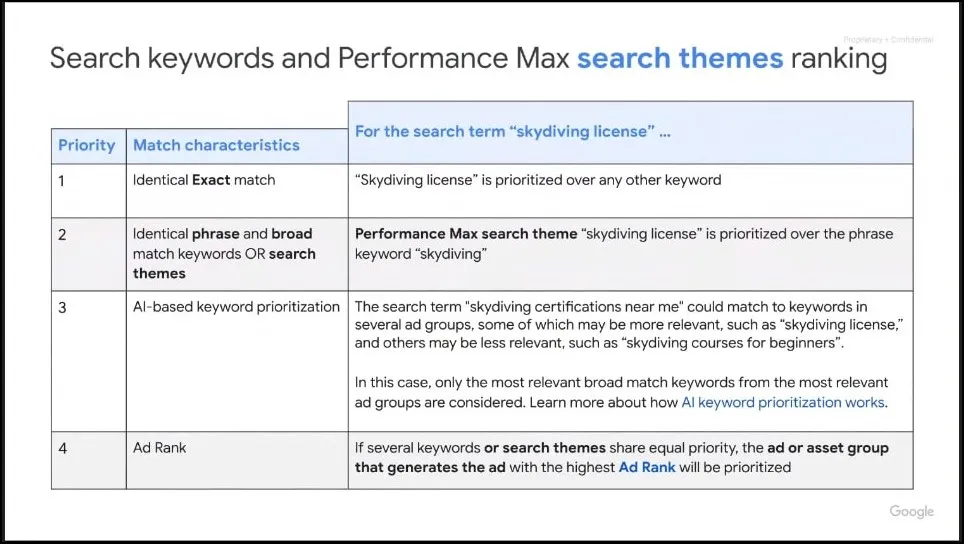
However, advertisers are encouraged to use both campaign types in tandem, with Google advising that the keywords added to a search campaign should nearly always take precedence over the automated matching done by PMax. They even tell us, “If the user’s query is identical to an exact match keyword in your Search campaign, the Search campaign will be prioritized over Performance Max.”
Scenarios 1-3 in the following table illustrate what that prioritization is supposed to look like.
Prioritization of Ad Serving When Search and Performance Max Compete
Scenario
Keyword
Keyword Match Type
Search Term
Which campaign serves the ad?
Why?
1
Flowers
Exact
Flowers
Search campaign is prioritized
The keyword text is the exact same as the search term text
2
Flowers
Phrase
Flowers
Search campaign is prioritized
The keyword text is the exact same as the search term text
3
Flowers
Broad
Flowers
Search campaign is prioritized
The keyword text is the exact same as the search term text
4
Flowers
Phrase
Flowers Near Me
Depends - Campaign with better ad rank wins
The keyword and search term text are different
5
Flowers
Broad
Deliver Roses
Depends - Campaign with better ad rank wins
The keyword and search term text are different
Scenarios 4 and 5 show what happens when a keyword with the same text as the query doesn’t exist in the search campaign, but a broad or phrase match could have triggered the ad. In those scenarios, auction-time signals are used to decide whether to serve an ad from Search or PMax.
But in practice, many advertisers suspect that PMax is crowding out their Search campaigns, even for keywords they specifically target. They suspect that what actually happens is different from what is explained in the table of what is intended to happen.
So we set out to answer key questions like:
How often does the PMax campaign show an ad for a keyword that exists in a search campaign?
Are the same search terms showing up in both PMax and Search?
Does this overlap happen across all match types?
Which campaign delivers better performance when there is an overlap?
How we ran our search term overlap study
For this study, we reviewed data from February 1 to February 28, 2025, across 503 accounts managed in Optmyzr.
Our analysis had two parts:
Part 1: Exact keyword overlap
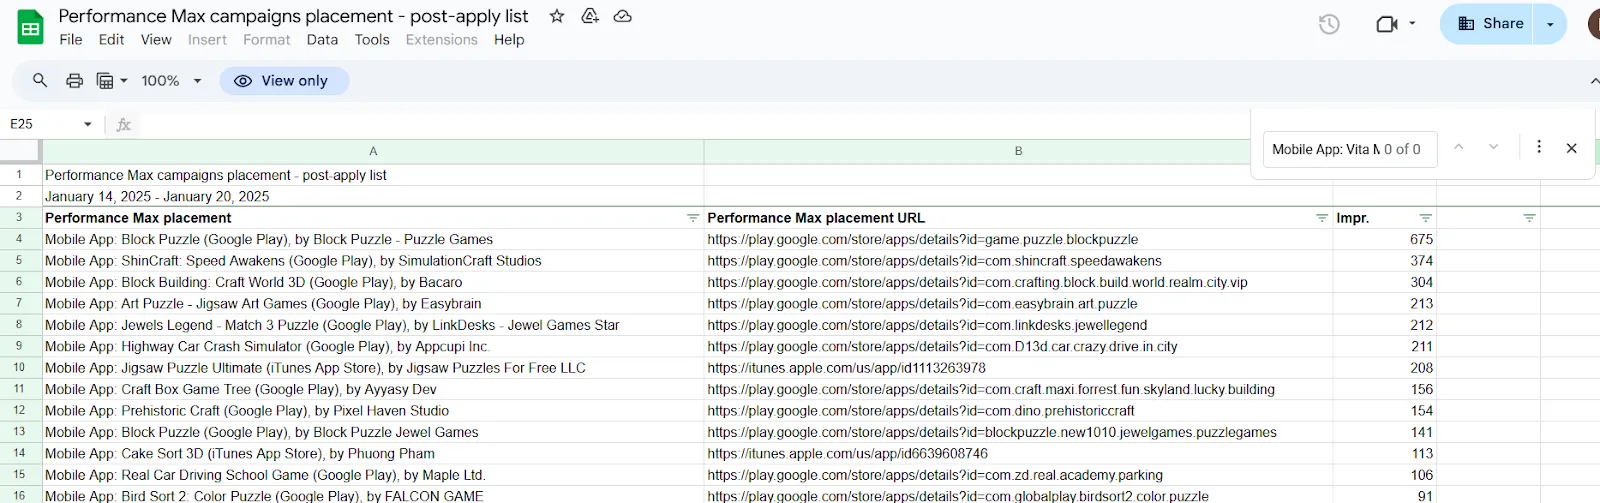
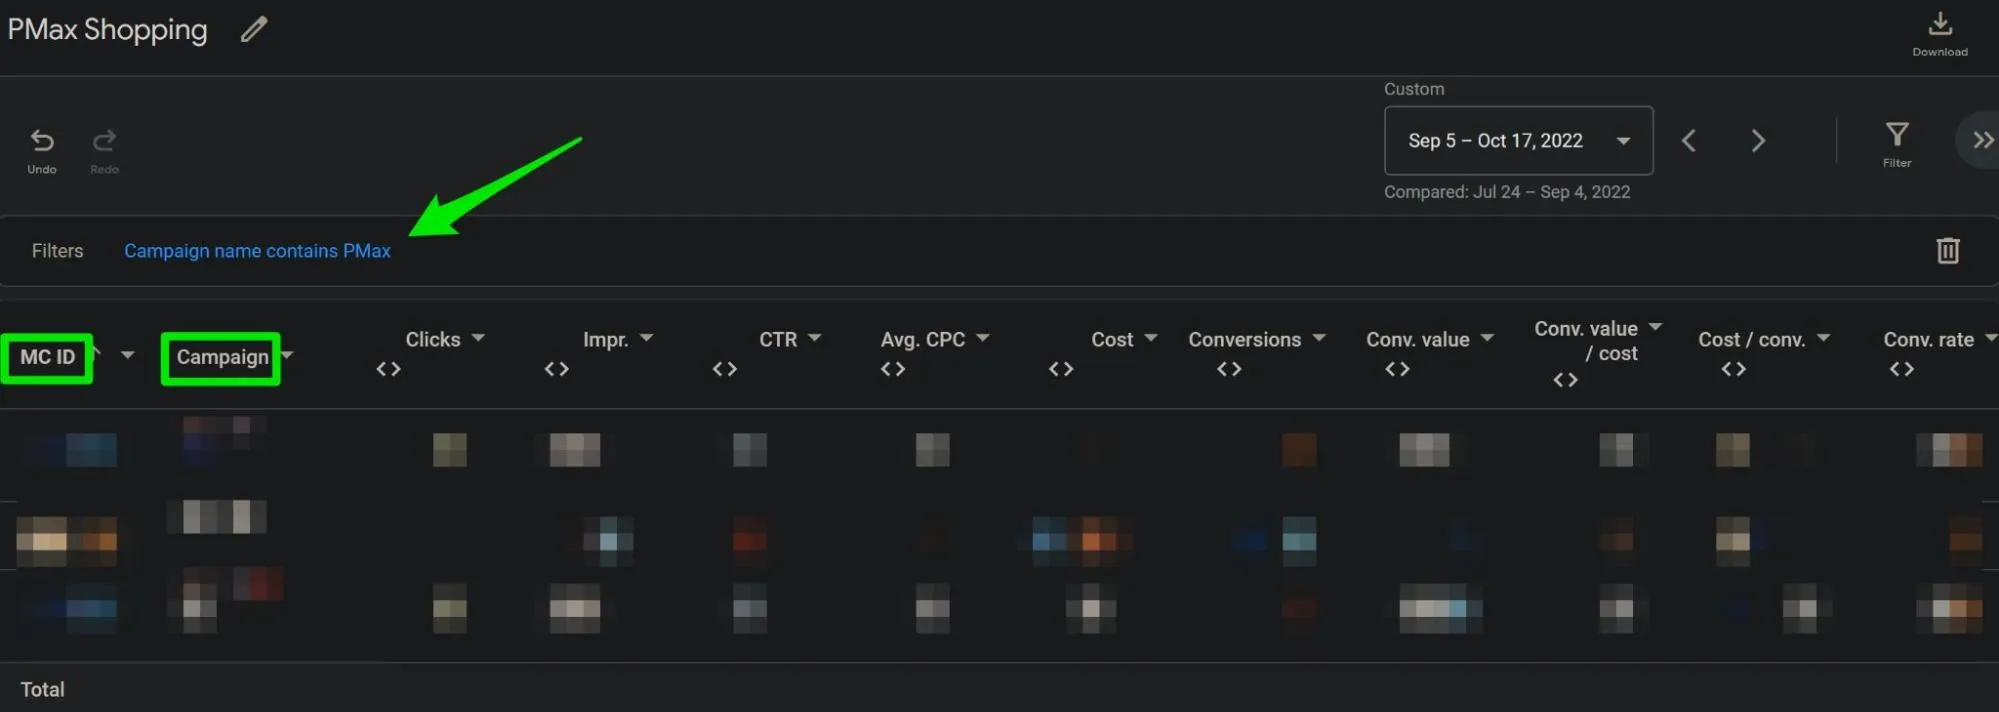
We looked for keywords in Search campaigns that also appeared in the PMax search terms report, indicating that PMax triggered ads for keywords explicitly targeted in the advertiser’s Search campaign.
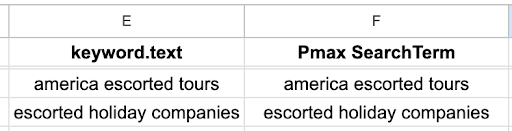
Here’s what that looks like in reports we pulled:
A sample from the data we pulled shows when a search campaign’s keyword text is exactly the same as the search term’s text that triggered a PMax ad.
Note that the text of the keyword is the exact same as the text of the search term that triggered the PMax campaign to show an ad. The keyword match type doesn’t matter; we just check that the text is an exact match.
In our table of scenarios, this would correspond to scenarios 1, 2, or 3.
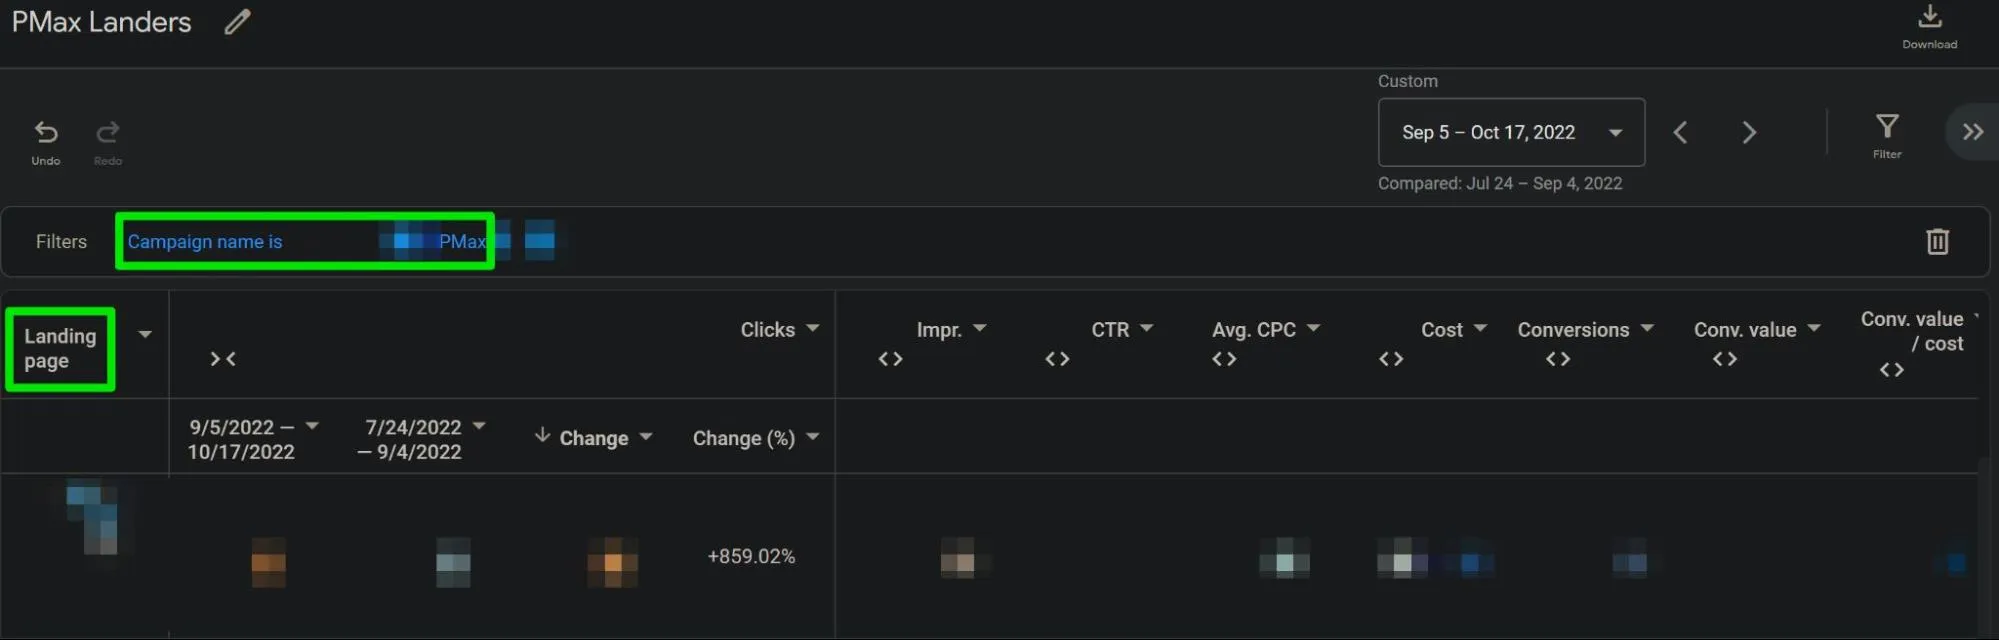
Part 2: Search term overlap
We checked for search terms that showed up in both PMax and Search campaign reports, and that were not exact matches for an existing search campaign keyword. This indicates that the search campaign contained relevant keywords that could have shown the ad, but sometimes the PMax campaign won the auction and showed the ad for that query.
In our table of scenarios, this would correspond to scenarios 4 or 5.
In both parts, we compared performance for CTR and Conversion Rate. We defined performance differences as “insignificant” if they were under 10% different. We did not include CPC, CPA, and ROAS because Google did not report cost data for PMax search terms at the time of our analysis.
The findings: Keyword overlap is real
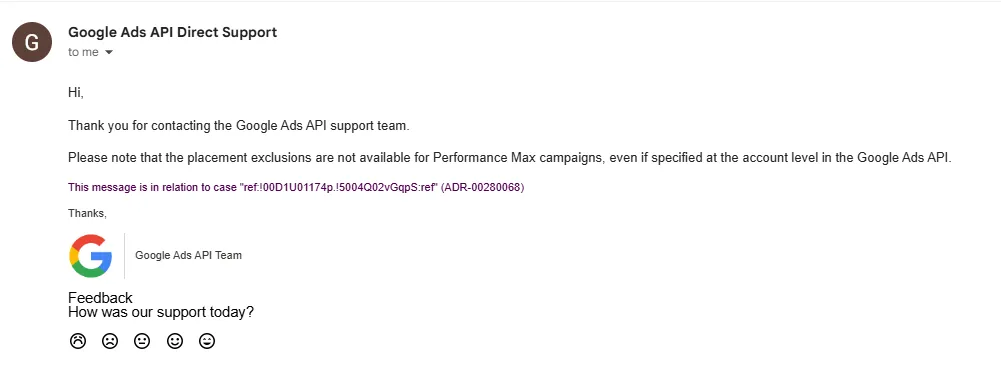
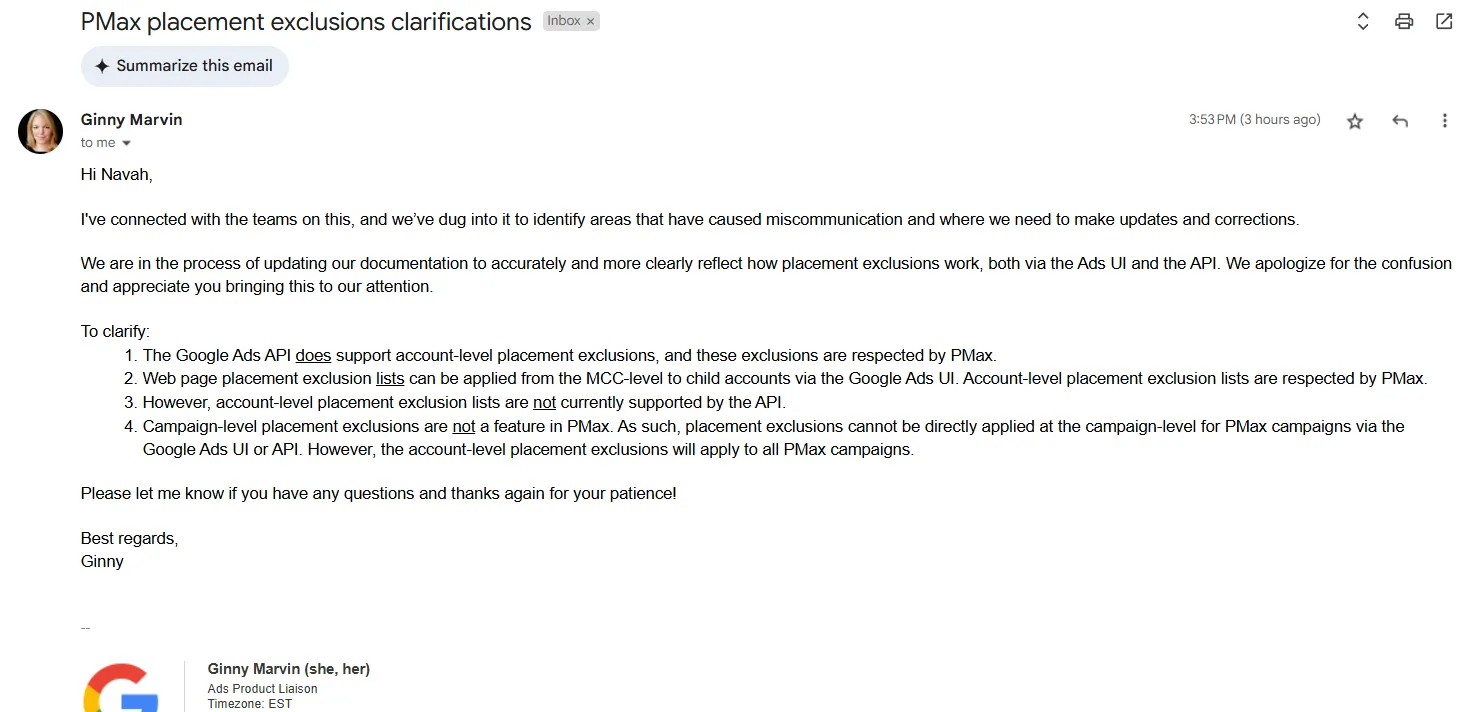
When a search campaign contains a keyword whose text matches the search term exactly, Google says the search campaign should be prioritized. What we observed indicates that this prioritization is not what advertisers would expect, and Performance Max frequently cannibalizes the search keyword.
The reason could be that the search campaign was ineligible to show an ad due to targeting or budget constraints. We did not analyze that possibility in this study.
Prevalence of Performance Max cannibalizing search keywords
Accounts: 91.45% of 503 accounts had keyword overlap between Search and PMax.
Campaigns: 56.29% of 5,768 Search campaigns showed this overlap.
Ad Groups: 27.86% of 40,642 ad groups were impacted.
The overlap was identified for all match types, including exact match keywords. So, having a keyword with the exact text of a search term, and making it an exact match keyword, does not guarantee that the overlap won’t happen.
Performance difference when Performance Max cannibalizes search keywords
Ultimately, advertisers care about performance and would likely not complain if Google’s automation did something that led to better financial outcomes for their campaign.
Unfortunately, it’s not possible to measure ROAS differences because PMax campaigns don’t report revenue data at the search term level. So we analyzed two important metrics for which data is available: CTR and conversion rate.
CTR results:
Search campaign performed better: 28.37%
Performance Max campaign performed better: 15.98%
No significant difference: 55.65%
Conversion rate:
Search outperformed PMax: 18.91%
PMax outperformed Search: 6.17%
No significant difference: 74.92%
Takeaway
In most cases, when PMax overlaps with existing search keywords, the performance difference is not significant. However, when the difference exceeded 10%, the search campaign was more often the campaign type with the better performance.
Search term overlap between PMax and search campaigns
This is part 2 of the study. There was also an overlap between Performance Max and Search campaigns when there was no keyword that matched the search query exactly.
This was expected and aligns with Google’s guidance that Ad Rank is the determining factor in these instances. We measured how often this type of overlap exists and how the performance differs.
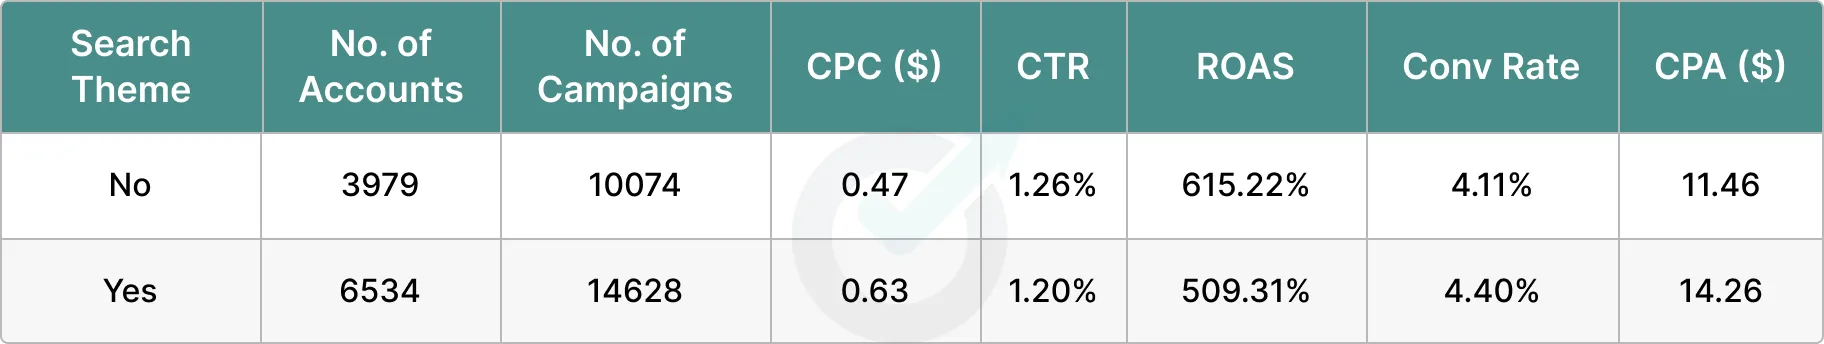
Accounts: 97.26% of 511 accounts had search term overlap.
Search Campaigns: 76.17% showed overlap with PMax.
PMax Campaigns: 97.40% overlapped with Search campaigns.
Performance difference when Performance Max and search overlap
CTR (424,820 search terms analyzed):
Search won: 32.37%
PMax won: 24.21%
No significant difference: 43.42%
Conversion rate:
Search better: 7.66%
PMax better: 4.32%
No significant difference: 88.03%
Takeaway
Overlap is nearly universal, but performance differences are usually minor. But again, when there is a difference greater than 10%, Search is more likely to be the better-performing campaign type.
Why this matters: Efficiency and control
When PMax runs alongside Search and targets the same queries, it creates internal competition. That means:
You might pay more for clicks that Search could have delivered more efficiently.
You lose control over which creative or audience drove results.
You can’t fine-tune performance as easily because PMax aggregates reporting across channels.
And while PMax is supposed to avoid this overlap, our data shows otherwise.
What advertisers should do
If your Search campaigns are losing impressions to PMax, you’re not alone, and you’re not powerless. The key is to understand that cannibalization isn’t just a function of overlapping keywords. It often happens because your Search campaign becomes ineligible to serve ads in the first place.
That ineligibility can stem from mismatches in location targeting, ad schedules, audience exclusions, or budget constraints. For instance, if your Search campaign doesn’t have enough daily budget to stay active or is limited by a narrower geographic focus, Google won’t even enter it into the auction, leaving PMax to pick up the traffic by default.
To protect your Search performance and regain control:
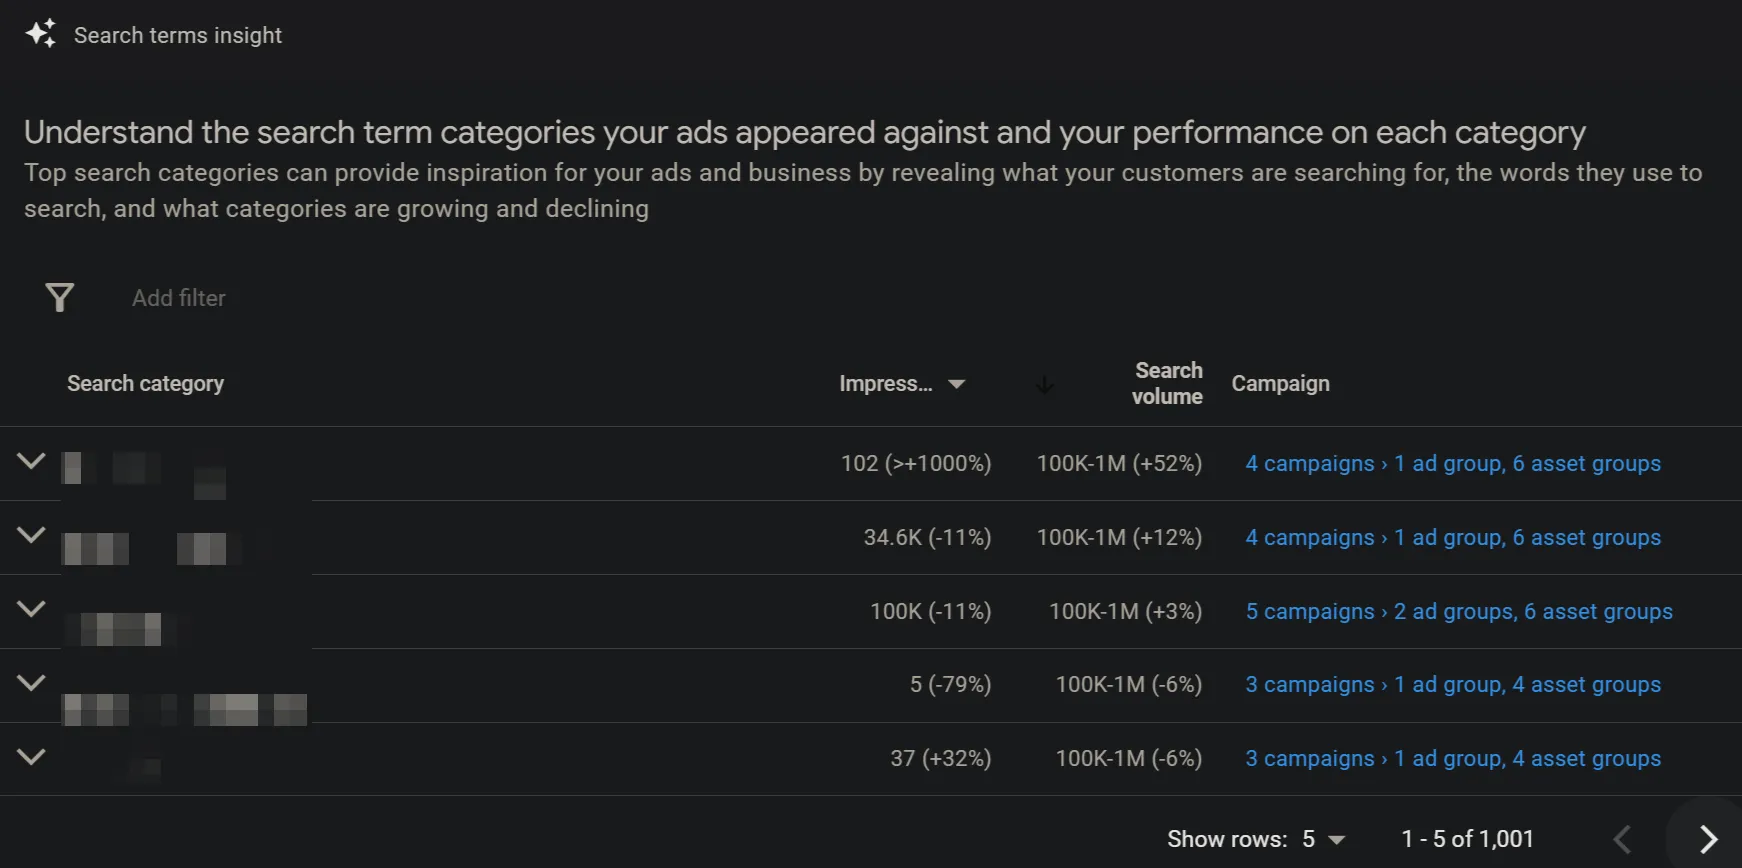
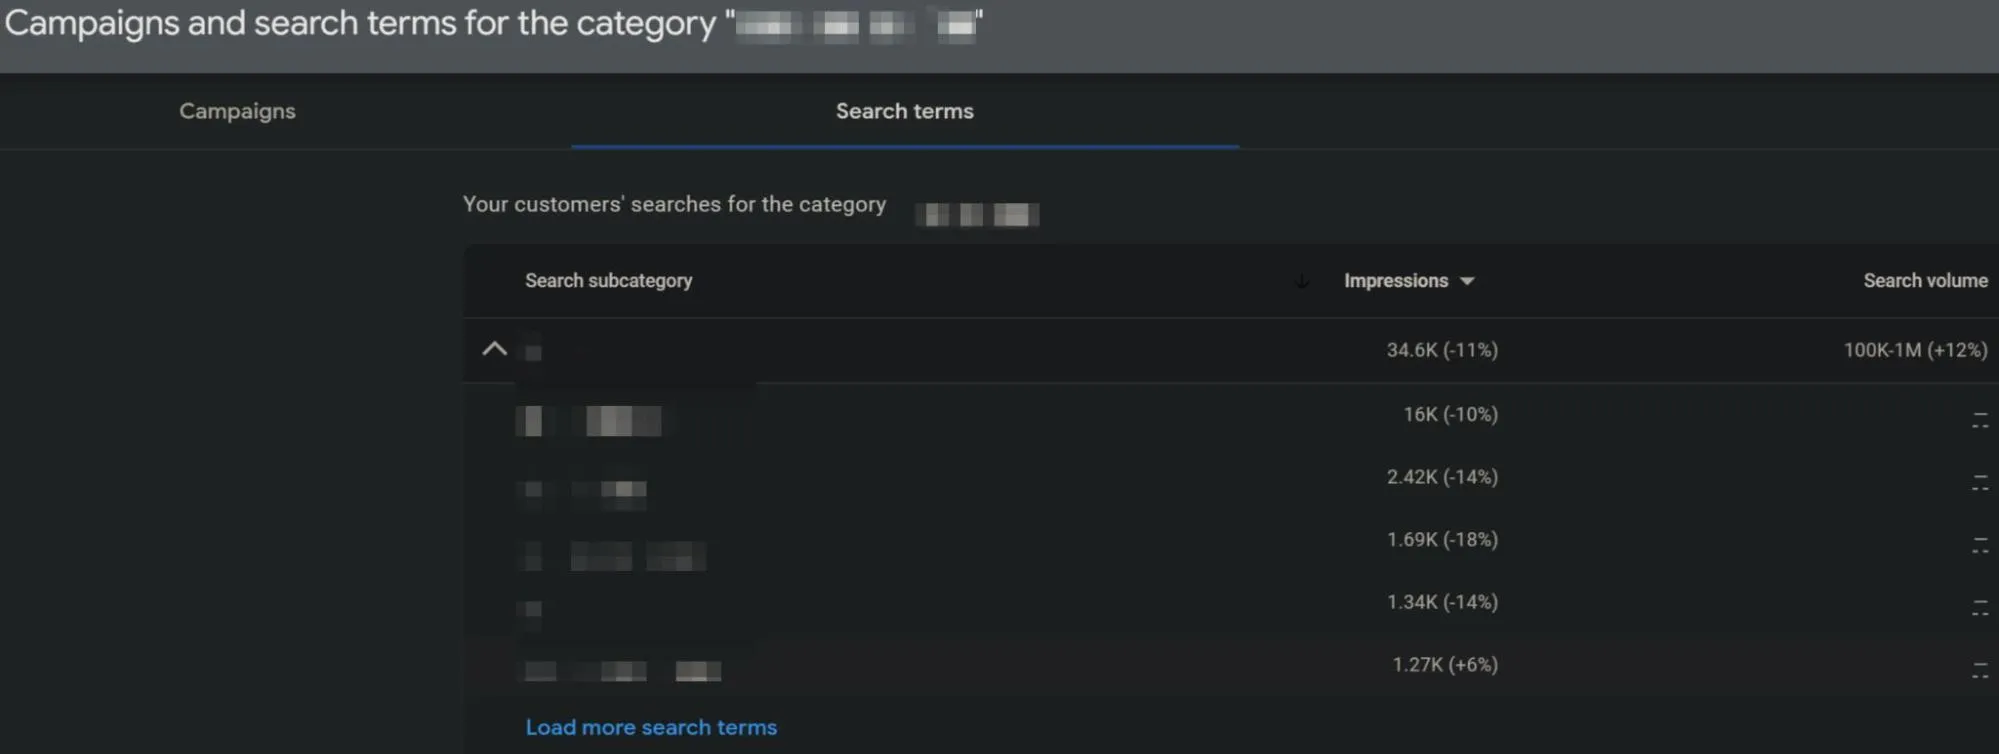
Use Search Term Insights (e.g., from Optmyzr) to identify where PMax overlaps with Search. When you find converting terms in PMax that aren’t in your Search campaigns, add them as exact match keywords to shift priority back to Search.
Align your campaign settings — check your targeting, bids, and budgets — so Search campaigns remain eligible across the full range of impressions you want to capture.
Turn off auto-apply recommendations that remove “redundant” or “non-serving” keywords. These automated changes often strip your campaigns of the very keywords that protect them from PMax encroachment.
Add branded misspellings as exact match keywords to Search. Even with brand exclusions enabled, PMax can still trigger ads for fuzzy matches that dilute your brand’s performance data.
Remember, PMax thrives when there’s a gap, either in eligibility, bid competitiveness, or keyword coverage. Your job is to close those gaps. Use PMax where it performs best: as a complement to your Search campaigns, not a replacement for them.
Final thoughts
Performance Max can be powerful, but only when it complements, not competes with, your Search campaigns. As this study shows, Google automation’s promise still needs human oversight to reach its full potential.
Search campaigns give you control. PMax gives you scale. But only when you manage both thoughtfully can you truly maximize performance.
Most people assume Q4 is the busiest time of year. But assumptions aren’t analysis.
Every business experiences seasonality differently. Understanding your specific demand patterns—when performance surges or slumps—is how you allocate budgets smarter, optimize campaigns, and predict what’s next.
You don’t need a data science team. You don’t need a PhD in statistics. You need a clean export, a bit of prep, and GPT. Let’s break down how to do seasonality analysis using ChatGPT.
This approach draws heavily on insights shared by Cory Lindholm during one of my PPC Town Hall podcasts, where he talked about seasonality analysis, offering a straightforward way to sharpen your PPC strategy.
What is seasonality analysis?
Seasonality analysis is about pattern recognition. It uncovers recurring spikes and dips in performance over time, helping you stop reacting and start planning.
If you’ve ever wondered:
“Why did conversions tank last May?”
“When should I start ramping budgets for the holidays?”
“Are these results an outlier or a trend?”
Then you’re already looking for seasonality. A formal analysis just answers those questions with data, not guesswork.
What is seasonality decomposition?
It’s the process of splitting your time series data into three parts:
Trend – the long-term movement (up or down)
Seasonality – the predictable ups and downs (e.g., Q4 spikes)
Residual – the randomness (e.g, a one-off campaign anomaly)
Multiplicative: when changes grow with volume Y(t) = T(t) × S(t) × R(t)
That’s the math out of the way. Here’s how GPT does the heavy lifting for you.
How to perform a seasonality analysis using GPT
Here’s the step-by-step process I followed, including a few important checks to ensure reliable results.
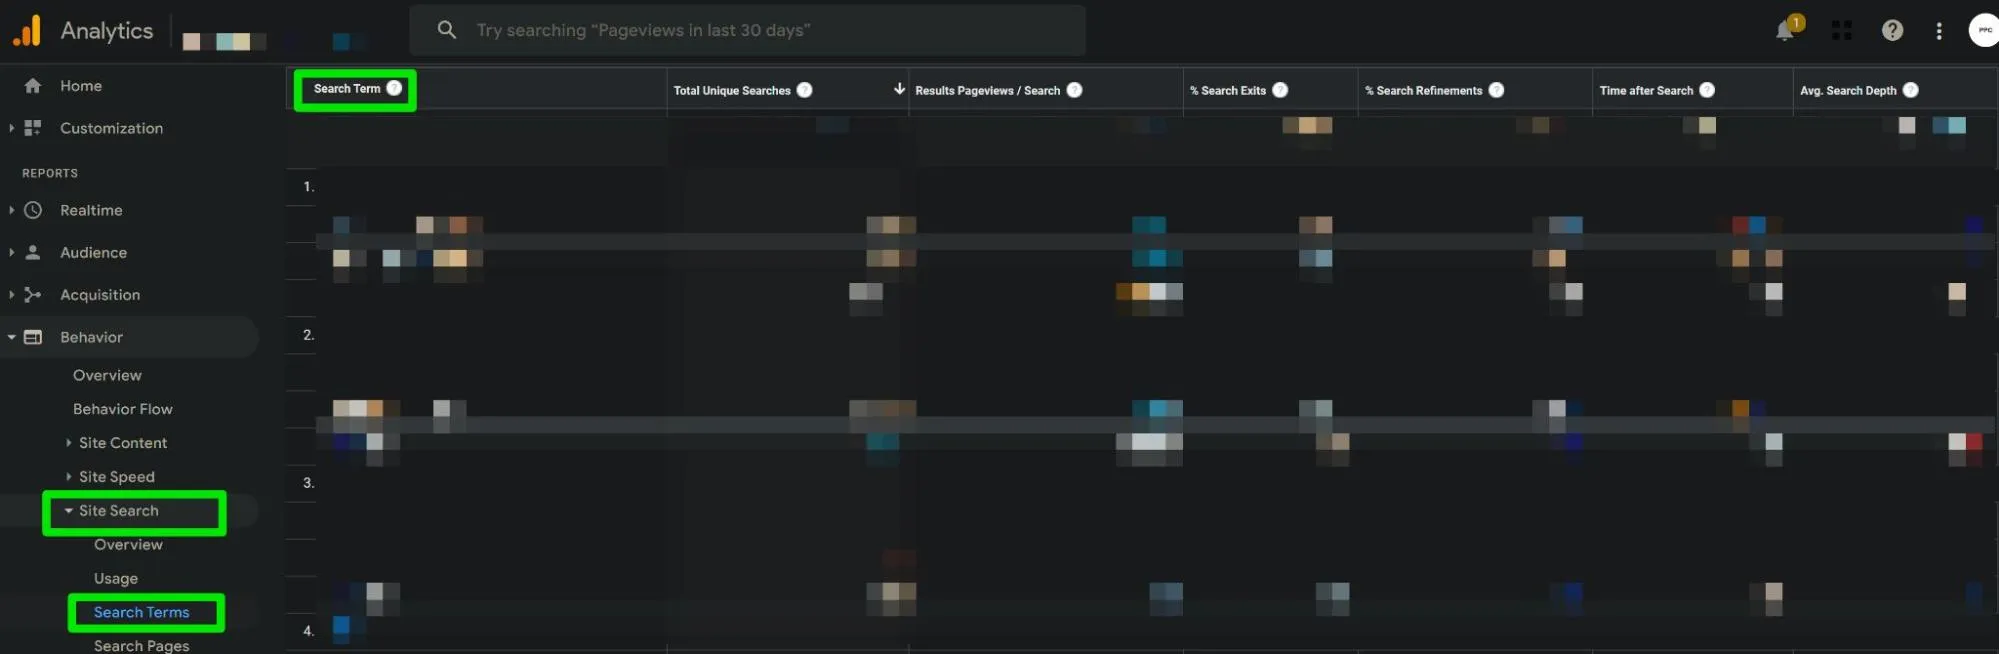
Step 1: Export your weekly PPC data
Start with Google Ads Report Editor. Create a report that includes the metrics you want to analyze, such as clicks or conversions, and include “Week” as a row dimension. This creates the time series structure needed for analysis.
Export the report as a CSV file. To get the most out of GPT’s analysis, use at least one full year of weekly data. Seasonality decomposition relies on repeated patterns, so anything shorter may produce misleading or incomplete results.
Step 2: Ensure your data is clean and complete
Before uploading the file, review your data for inconsistencies. Check for missing weeks, duplicate entries, or formatting issues such as commas in column headers or entity names.
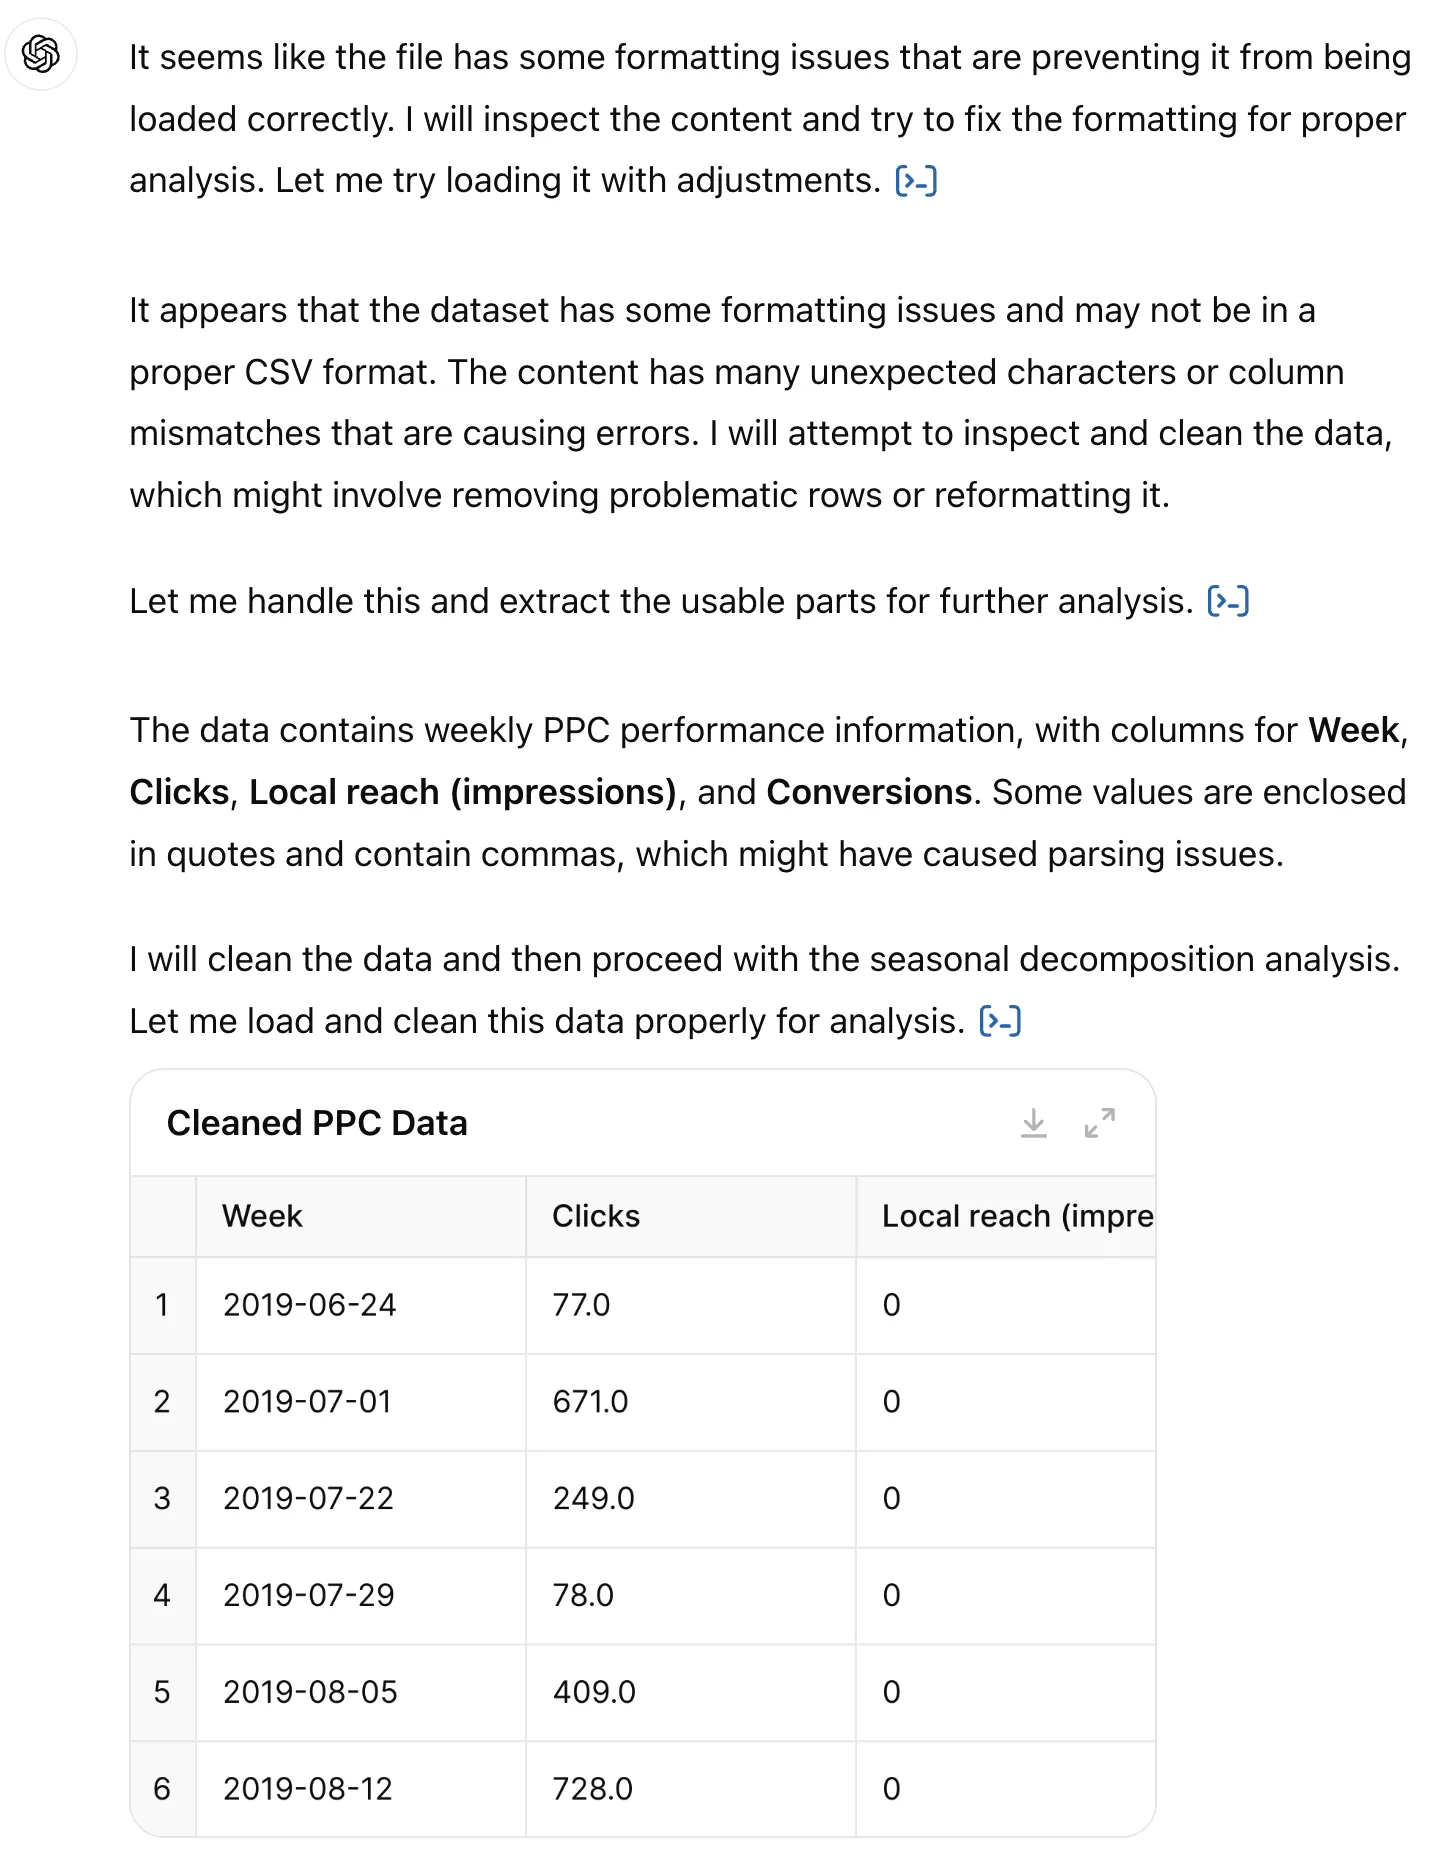
In my test, GPT detected and corrected formatting problems automatically. However, starting with clean input data improves reliability and reduces the chances of errors during analysis.
Step 3: Upload the dataset to GPT-4o
Use GPT-4o with the Advanced Data Analysis model. After uploading your CSV, use a prompt like: “I have weekly ads data. Can you perform a seasonality decomposition on it?”
GPT will load your data and ask which metric you want to analyze. You can choose clicks, conversions, or any other time-based KPI included in your report.
Then it asked me which of the KPIs I wanted to analyze for seasonality and replied with: “The data has been cleaned and displayed for your review. Now, I’ll perform the seasonal decomposition on one of the metrics, like Clicks or Conversions, depending on which one you’d prefer to analyze. Should we proceed with Clicks, or would you prefer a different metric?”
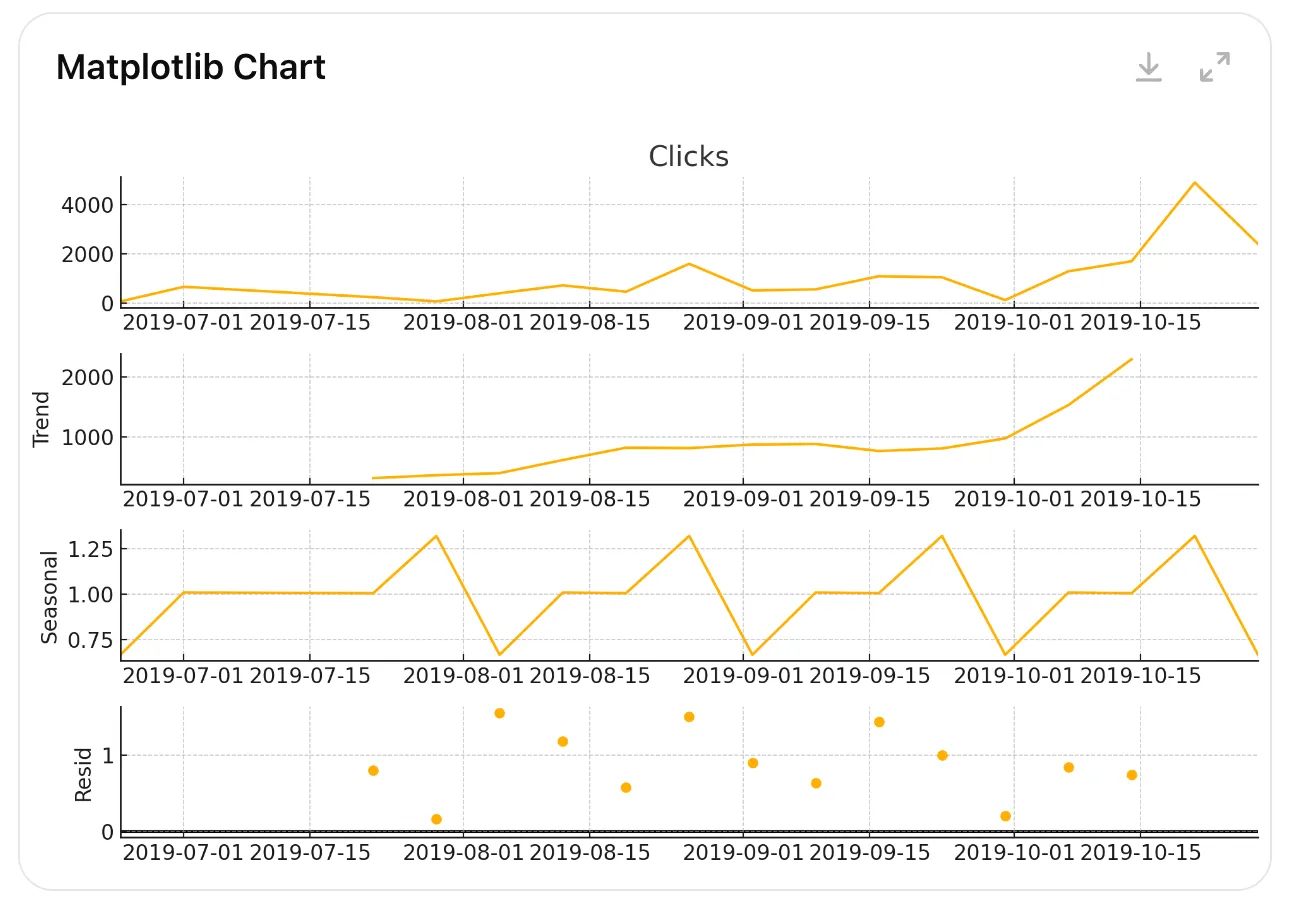
I responded with the prompt: “Please perform decomposition on Clicks.”
GPT then responded with the following chart:
Additional tips:
If you want to explore the underlying trends, seasonal patterns, and residual variations in your dataset (like clicks, conversions, or other metrics) across weekly time periods, you can perform time series decomposition.
Clicks Decomposition Example: Decompose your clicks data to understand the trends (e.g., steady growth or decline over time), seasonal patterns (e.g., weekly or monthly peaks and troughs), and residuals (random fluctuations).
Data Characteristics: Based on your uploaded data (with Week as a time series indicator), decomposition can show how much of your clicks or conversions are driven by long-term trends versus recurring patterns.
Model Type: You can use an additive model if the seasonal variation remains consistent over time. Alternatively, use a multiplicative model if the variation grows proportionally with the level of the data (for example, during periods of high traffic).
There are several ways to expand on this.
Analyze by product lines or business segments
Break Down by Product Categories: Segment your analysis by product lines or business units instead of looking at overall data. This helps identify which products or services are more seasonally affected, allowing for precise budget allocation.
Sample Prompt: “Can you help me run a seasonality decomposition on my weekly data, but split by product categories?”
Brand vs. Non-brand analysis
Compare Performance: Separate your data into brand and non-brand traffic or sales, then decompose each time series. This can reveal if branded campaigns follow different seasonal patterns than non-branded ones.
Sample Prompt: “Can you help me decompose my time series data into brand and non-brand categories?”
Agency-level analysis: Vertical vs. advertisers
Vertical Trends vs. Individual Clients: As an agency, you can run a vertical-wide seasonality analysis and then compare individual advertiser data against these industry benchmarks. This allows you to provide insights into how clients perform relative to the industry and make tailored recommendations.
Sample Prompt: “Can you help me analyze a vertical’s seasonality and compare individual advertiser data to it?”
Forecasting PPC budget requirements
Predict Budget Needs: Use the trend and seasonal components to forecast future performance. This will help you predict when budget increases will be necessary to maximize return on ad spend (ROAS). This is particularly useful for managing Q4 budgets effectively.
Sample Prompt: “Can I use the trend and seasonal data to forecast my PPC budget requirements for the upcoming months?”
Seasonality insights for inventory management
Optimize Stock Based on Seasonality: For businesses with physical or e-commerce products, understanding seasonality can help forecast inventory needs, ensure enough stock during peak periods, and reduce surplus during off-peak times.
Sample Prompt: “Can seasonality analysis help me forecast inventory requirements by product line?”
Optimize marketing strategies
Tailor Campaigns to Seasonal Peaks: Use the seasonal component to adjust your PPC or display advertising strategies, targeting higher-intent periods for specific products, and plan remarketing efforts during off-peak times.
Sample Prompt: “Can you suggest strategies to adjust my marketing campaigns based on seasonal trends?”
Cross-compare channels
Analyze Seasonality Across Multiple Channels: To gain deeper insights into your marketing efforts, you can run seasonality analysis across different channels (e.g., Google Ads, Facebook Ads, organic traffic) to identify patterns such as which channels perform best at different times of the year. This lets you optimize your ad spend and focus on the most effective platforms during key periods.
This process is made easier by simply swapping the datasets you use for each channel. Whether you’re analyzing clicks, impressions, or conversions for Google Ads or Facebook Ads, the same approach applies; just change the dataset to reflect the relevant channel.
Sample Prompt: “Can you help me run seasonality analysis across different marketing channels?”
Fine-tune your PPC campaigns for maximum efficiency.
You already have the data. Seasonality analysis turns it into leverage.
It’s how you stop chasing performance and start anticipating it. With a single GPT prompt, you can surface trends your competitors are still guessing at. Forecast demand. Time your spend. Outsmart seasonality instead of getting blindsided by it.
No more “gut feels.” No more blown Q4 budgets. No more surprises.
Just sharper campaigns, better timing, and marketing that actually plans ahead.
You’re not just reacting to seasonality. You’re using it.
It goes without saying that the key to growth for ecommerce businesses is selling more products. Sounds simple. And obvious. But a lot of businesses aren’t looking closely enough at each product when planning how to achieve sustainable growth and stand out amongst the competition.
Product feed optimization is increasingly important for AI-driven signals and intent in search results.
Yes, having an aesthetically pleasing website with good UX, easy navigation, desirable high-quality products, and good customer service is important.
But search engines don’t focus on the pretty stuff.
First, they read the details. The words. The descriptions. The most identifiable attributes and information that make your products unique and in demand. Think function over form.
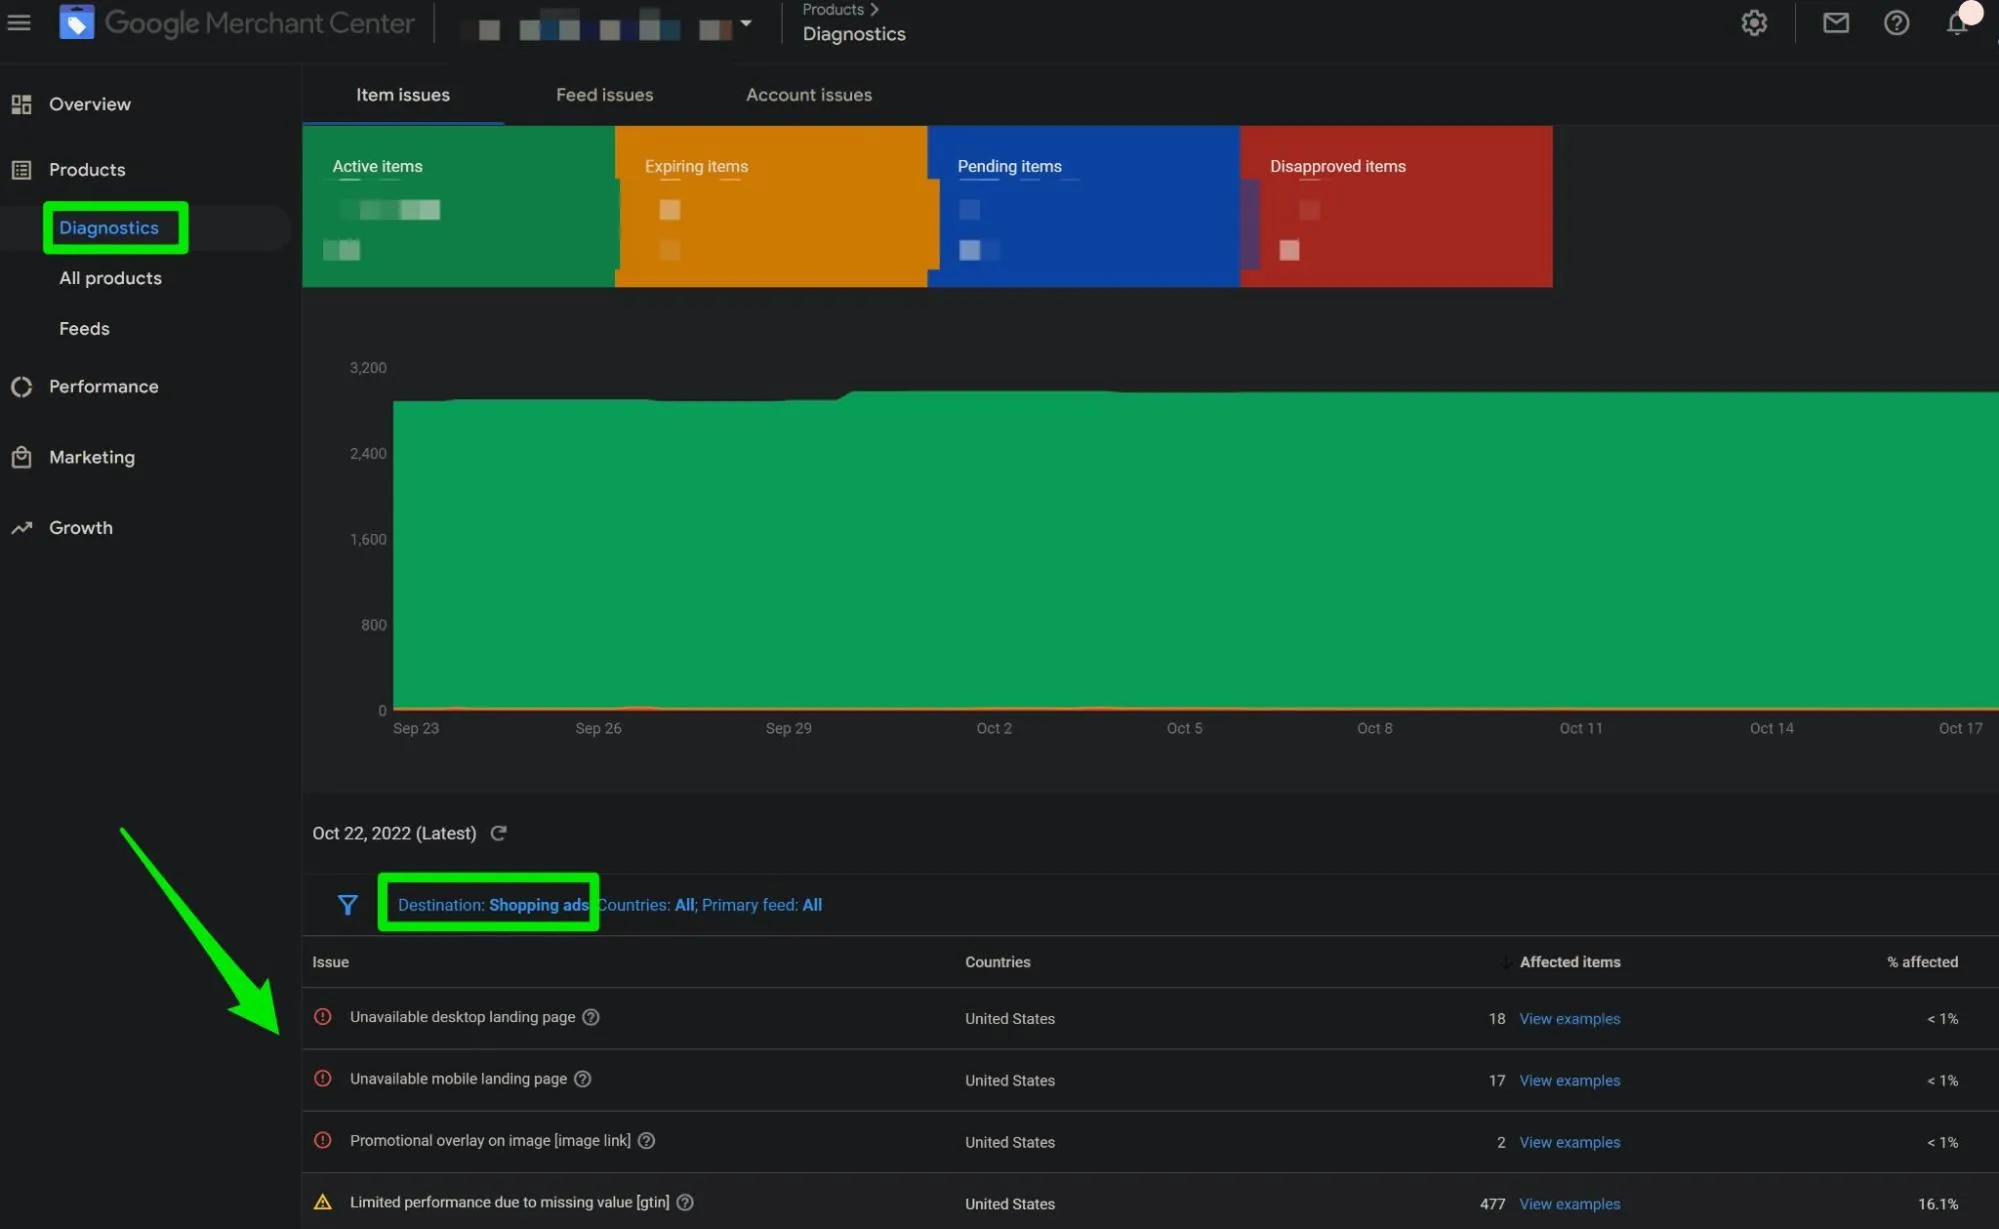
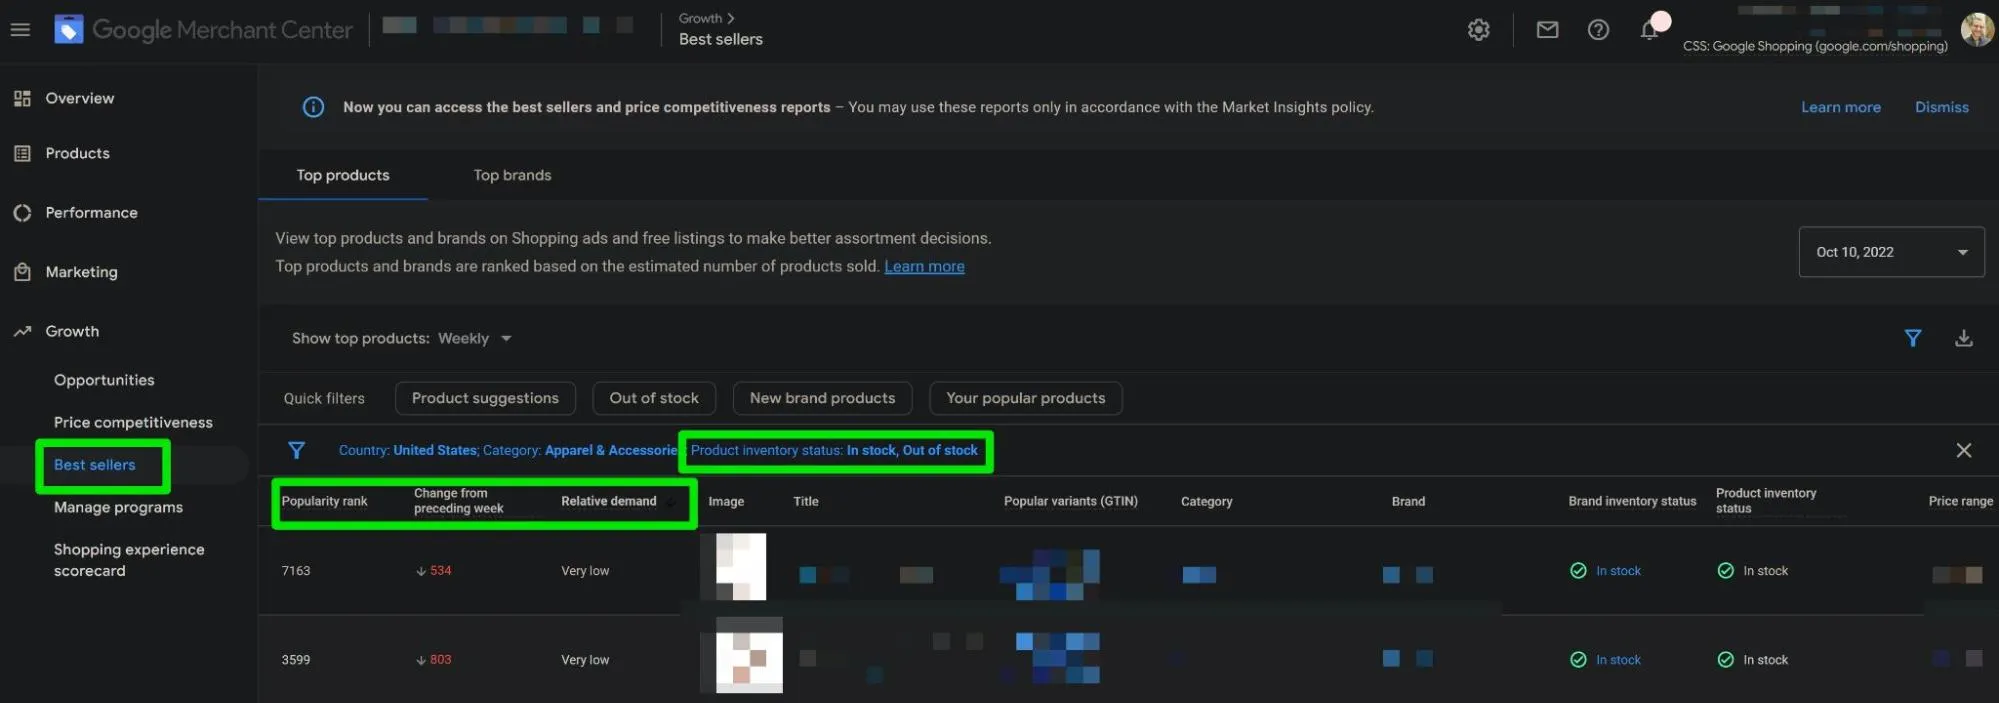
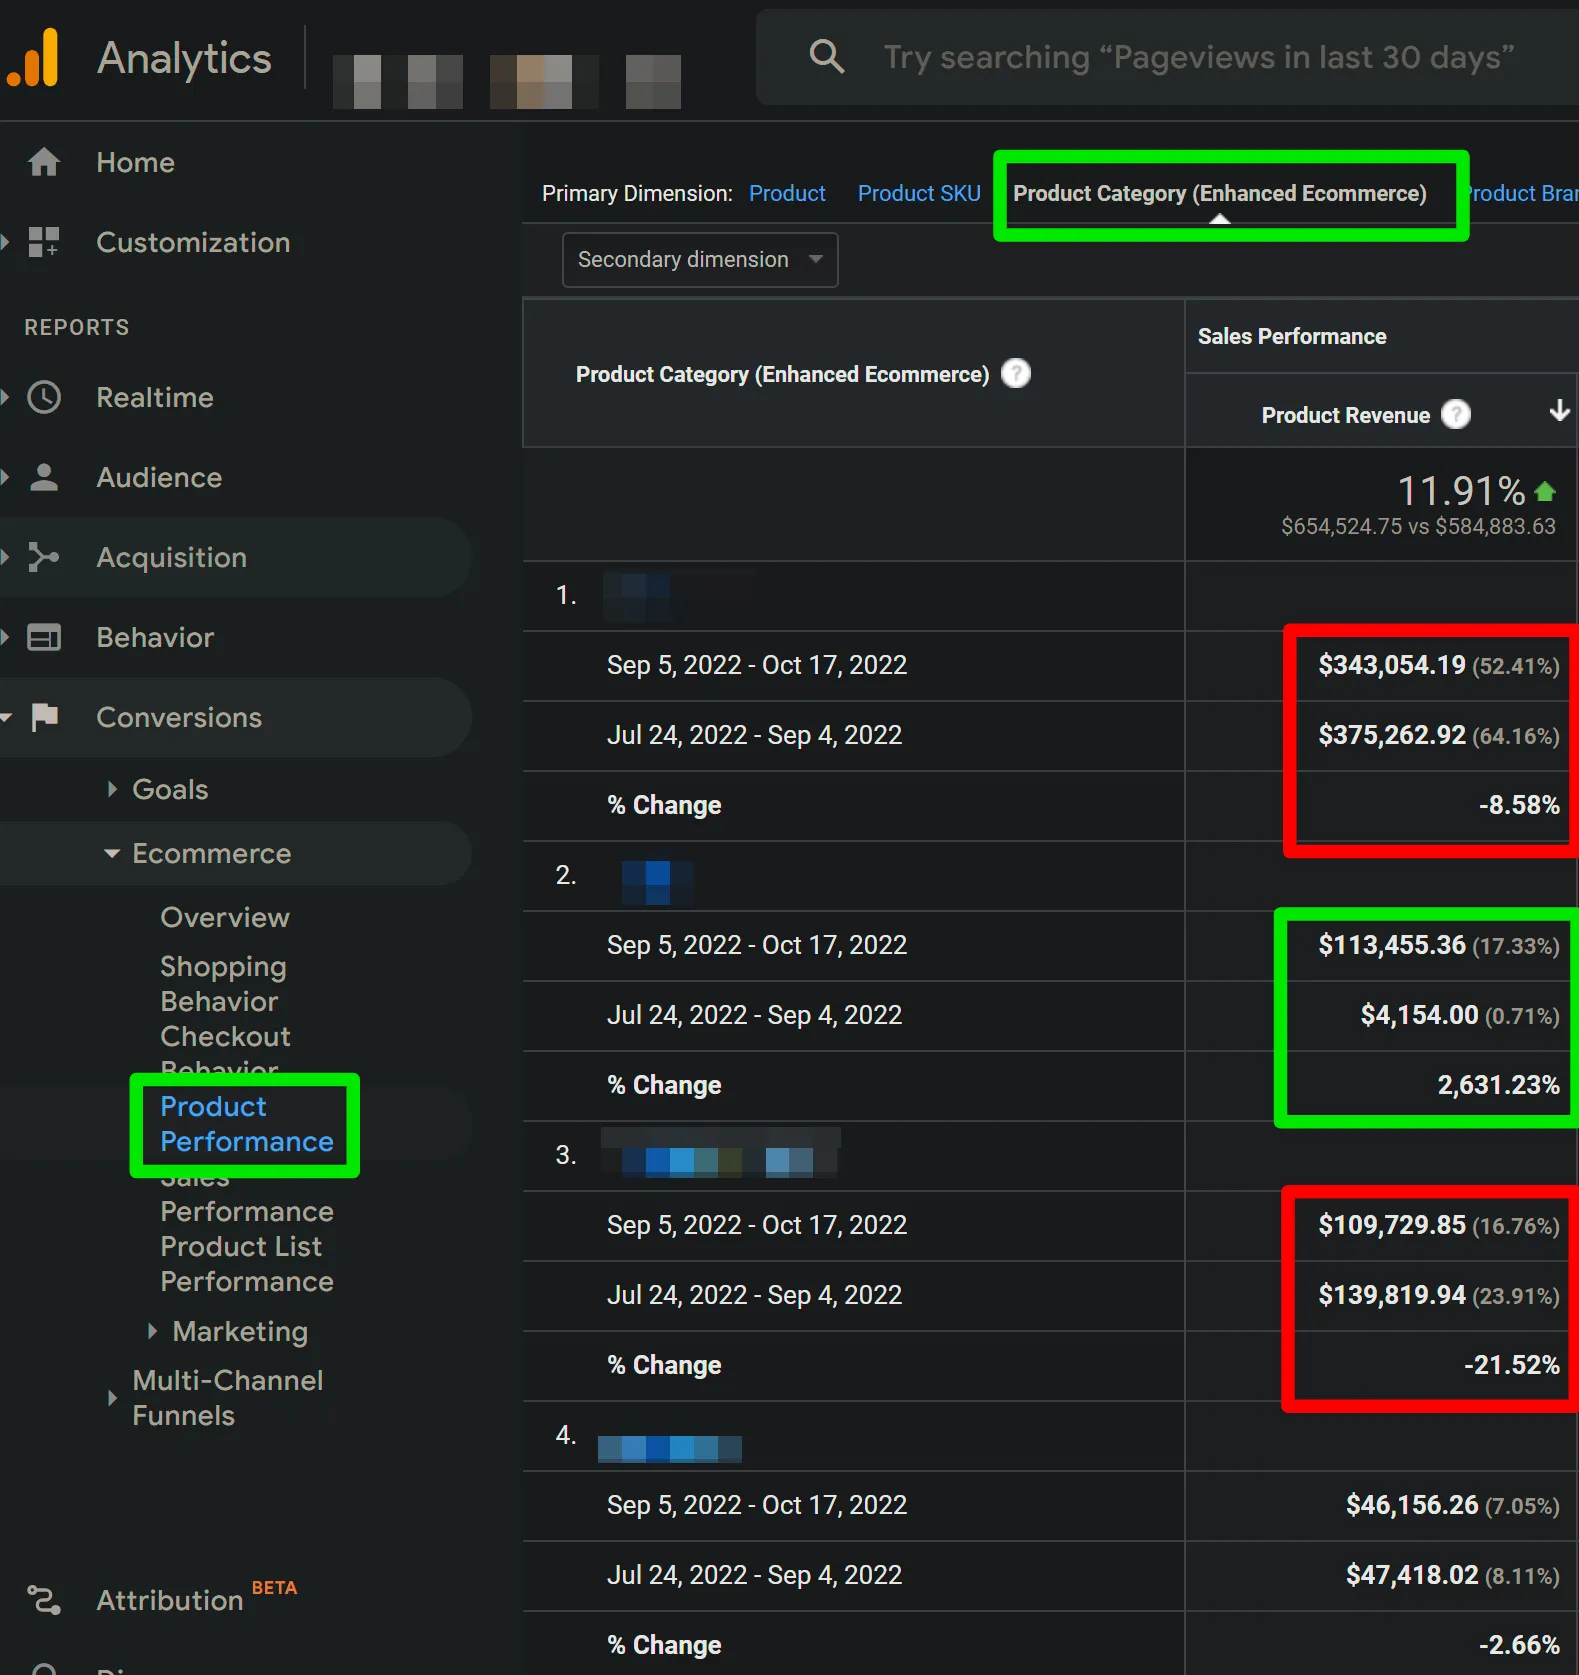
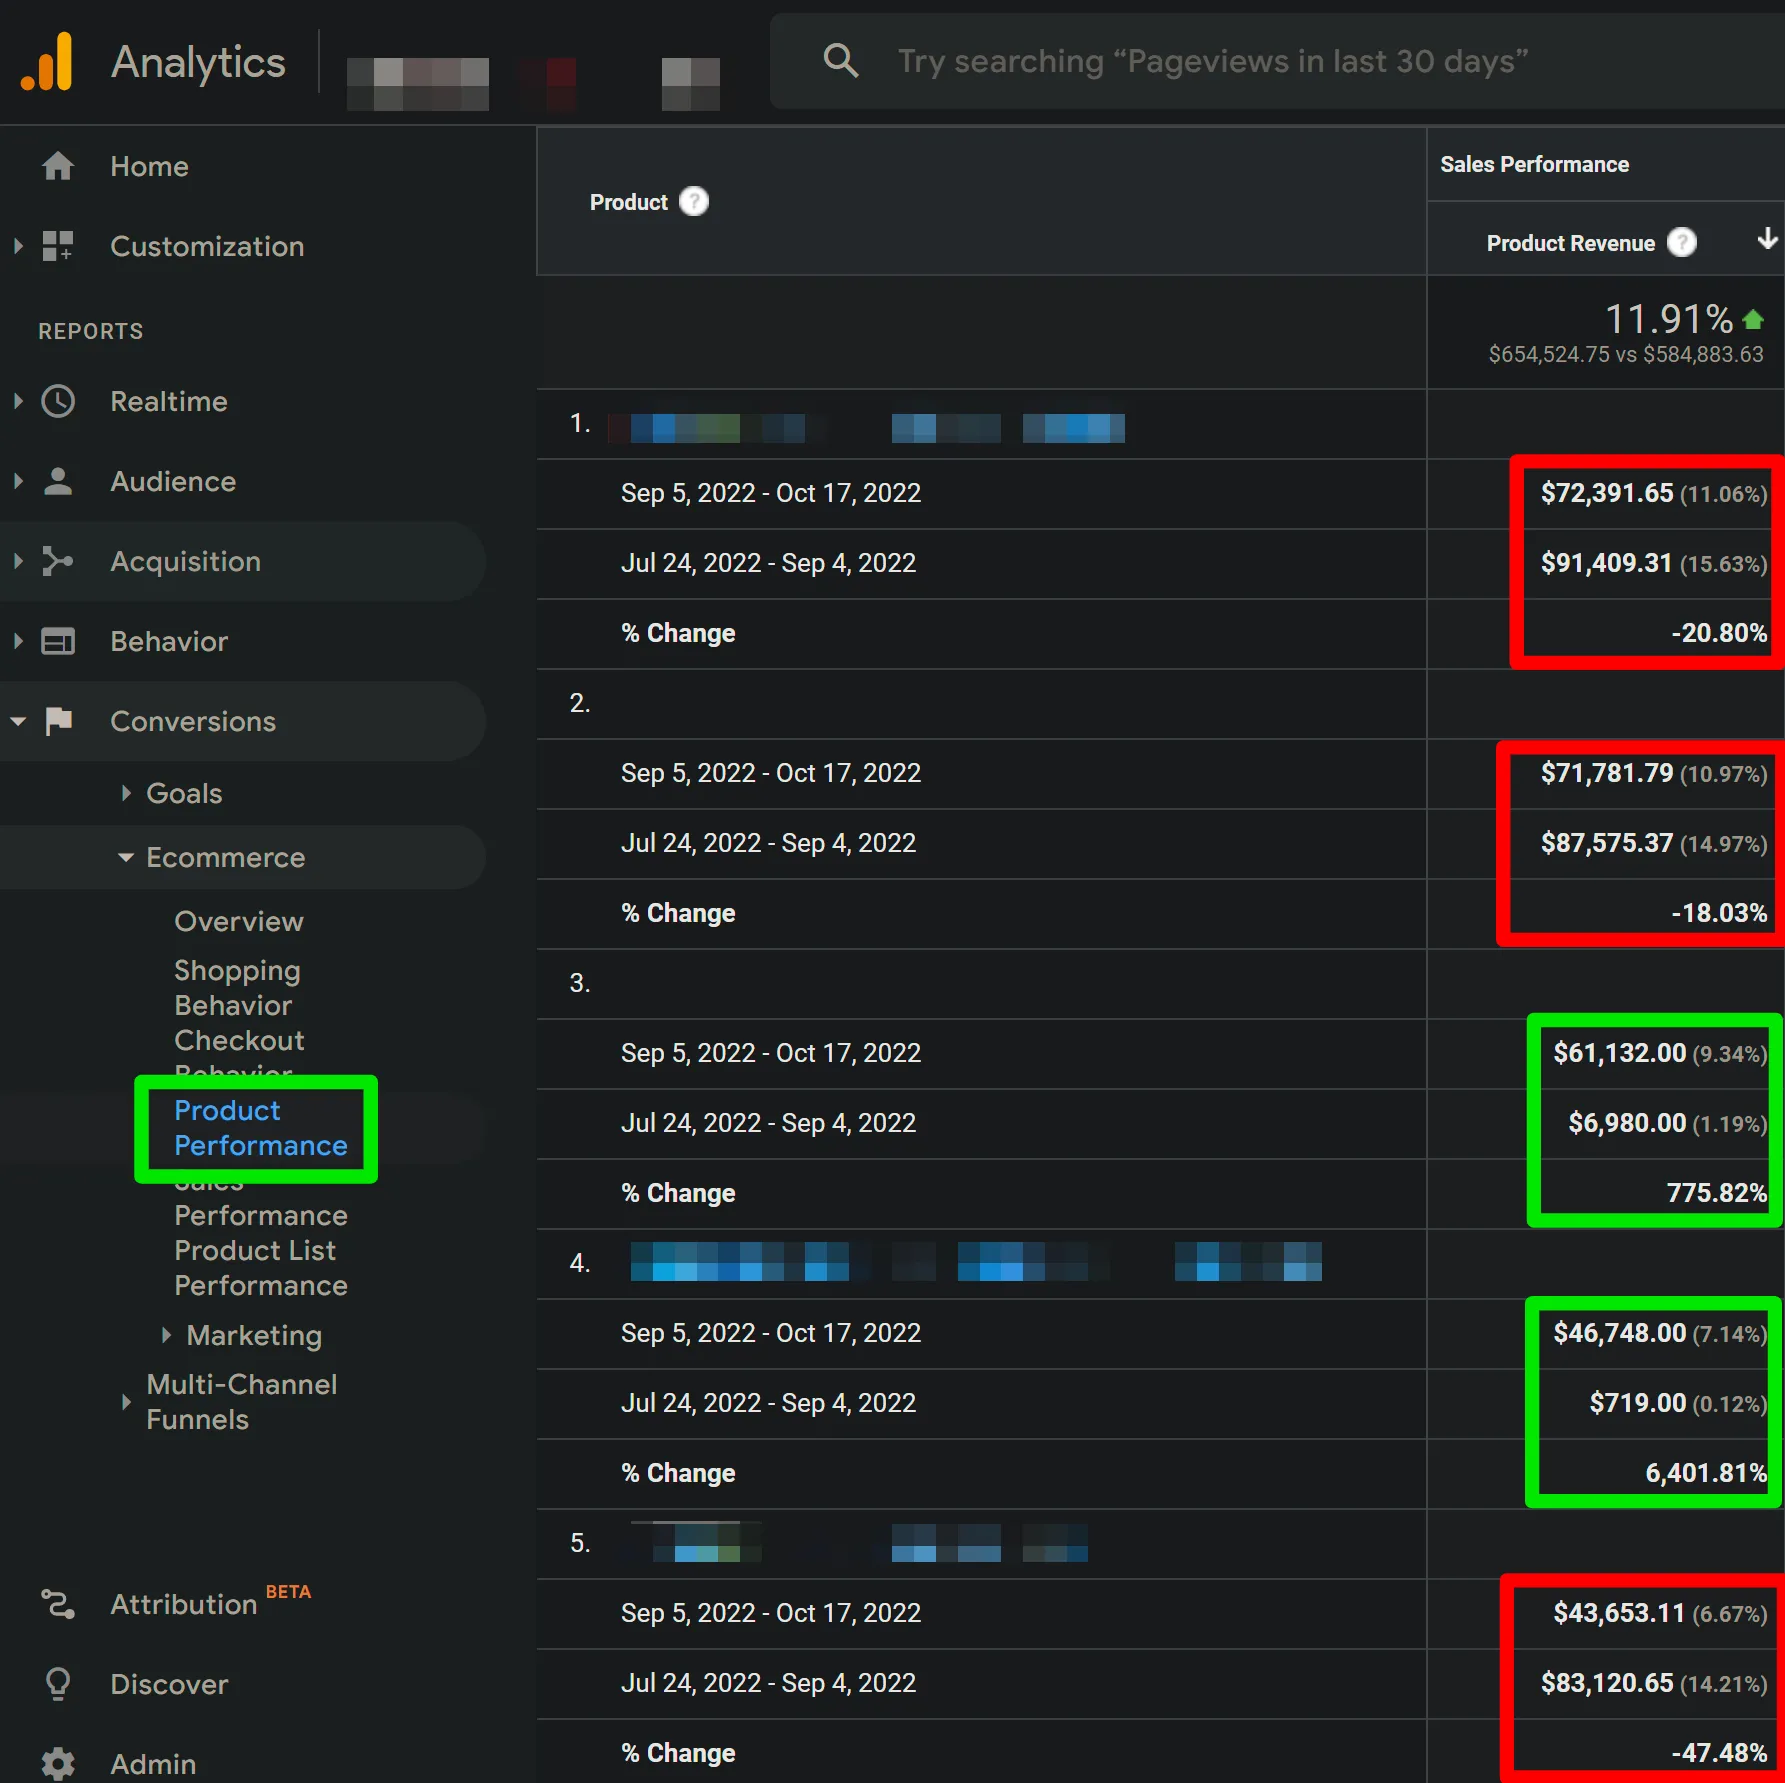
Screenshot shows improvements after simple product feed optimizations completed for a high-value furniture manufacturer
Why is feed optimization so important?
In basic terms, a product feed (or datafeed) is a structured way of submitting product information from your website to another source, such as Google Merchant Center.
One of the best ways to improve results for ecommerce businesses is to focus on product feed optimization to increase visibility, relevancy, conversion rate, and conversion value. This is crucial for businesses running Google Ads, particularly Shopping and/or Performance Max campaigns.
Not only can this positively impact performance for paid shopping placements, but it can also improve results in organic search (free listings).
Note: While this also applies to Microsoft Ads and other PPC channels, this article focuses on opportunities specifically within Google Merchant Center (GMC).
Here are four ways to optimize your product feed for Google:
Directly add & optimize rich product attributes for all products.
Create feed attribute rules in GMC.
Create and upload a supplemental feed.
Use a 3rd party tool for feed management and support.
Now, let’s see what the most important attributes you should be using to improve your product listings, examples of attribute rules in GMC, supplemental feeds, and some of the shopping ads solutions offered by Optmyzr to help make management easier and more efficient.
Key product attributes for feed optimization
There are obvious things a customer needs to know before making a purchase, such as what a product does, what it looks like, and how much it costs.
Google specifications outline what information is needed to submit products to Google Merchant Center, including which details are required and which are optional.
Surprisingly, a lot of businesses only complete the minimum requirements for feed approval. This means there is an opportunity to further improve what is submitted, in addition to providing more meaningful and helpful product details that are optional.
From a paid search perspective, feed attributes have been a focus of optimization tactics for several years. There has now been even more awareness of the importance of product attributes for SEO since the launch of Google Merchant Center Next.
This is partly due to increased visibility and reporting capabilities in both Google Merchant Center and Google Search Console related to product performance and the buzz around product schema for rich organic results.
Note: Even newer AI-powered shopping experiences, like ChatGPT’s, are starting to rely on structured product data, which is another reason to get your schema in order.
Examples of key attributes for optimization include:
Product Title
Product Type
Google Product Category
Description
Inclusion of additional relevant attributes such as size, color, and material
Images
Let’s break this down in further detail for the most important opportunities.
Product Title
Product titles are weighted for search relevance. Do not ignore the opportunity to improve this for both paid and organic listings.
This attribute has a direct impact on user experience, CTR, and CVR, as well as influencing the algorithm. Include the most important details first, and note that the majority of users will only see around the first 70 characters of your title.
For most product categories, a well-optimized product title will use the following formula:
Brand + Product Title + Product Type + Attribute
Include rich keywords for long-tail visibility.
Keep it under 150 characters.
Include any attributes important for your product, such as size, color, and material, where appropriate.
Be consistent with the attributes you choose and the location within the title (ie, if you include color, don’t put it at the beginning of one title and at the end of another)
Avoid vague or duplicate titles.
Do not include promotional copy, such as free delivery.
Avoid using ALL CAPS unless part of a brand name or common abbreviation.
Note: In some cases, a business may wish to include the brand name at the end of the title if the business is a manufacturer or if the brand name is not significant.
Product Type
Product types are significantly weighted for search relevance and allow custom categorization. This optional attribute is one of the most underutilized and misunderstood attributes in a product feed.
Always include product type in your feed, even though it’s optional. This attribute operates behind the scenes and is not visible to users.
Use rich keywords to help the algorithm better understand how to categorize your product. This attribute helps organize and segment your shopping and Performance Max campaigns.
Keep it under 750 characters.
Aim to use at least 3 levels of breadcrumbs.
Use the greater than ‘>’ symbol to separate each level, similar to how Google Product Categories are shown. Usually, this would follow the breadcrumb structure on your website, so specify this with SEO in mind.
Google Product Category
This is another golden opportunity. Although the Google product category is automatically assigned by Google, in many cases, it can be improved. Product titles, brand, GTINs, and descriptions all influence the automated categorization, which is another reason it’s important to make these as accurate as possible. Be sure you check these using Google’s predefined taxonomy for the most specific option related to your products.
Choose the most specific category possible.
Only use product categories defined by Google; you cannot create your own.
Use Google’s product categories as a hint for how users might search. If you’re using older versions of Google product categories and updates are made to the taxonomy, Google will automatically map this to the latest version.
Understand the difference between Google product category and product type, as they are similar but serve different purposes.
In certain countries, such as the USA, UK, Australia, Germany, France, Italy, the Netherlands, Brazil, Norway, Sweden, Turkey, you can use the Google product category to segment shopping and PMax campaigns.
Here’s an example of an improvement we made for a client selling outdoor chairs:
Here’s how we optimized the category: Furniture > Outdoor Furniture > Outdoor Seating > Outdoor Chairs
Description
Descriptions add context to products and help both users and search engines better understand the purpose and intent of a product. The primary goal is to sell your product to the right customer. Use this as an opportunity to highlight what your product is, what purpose it serves, what it looks like, and why customers need it.
Imagine a user cannot see the picture. Create a description that allows the customer to visualize the product with their eyes closed.
List the most important features first.
Include up to 500 characters.
Use the product description to list key features and benefits.
Include technical specifications, such as dimensions or weight, if appropriate.
Describe other key attributes in the written product description for visibility, such as colors, textures, materials, patterns, and size.
Don’t keyword stuff your descriptions, and don’t include promotional copy such as “free delivery” or sale pricing.
Avoid using ALL CAPS or emojis and special characters - this looks spammy and less trustworthy.
Identify descriptions created using generative AI with the structured_description attribute.
Images
An image is worth a thousand words. It is also often the first thing that catches our attention when viewing a page full of products. With the rise in popularity of image search, multiple quality product images are more important than ever.
Additionally, with recent enhancements in shopping features such as 3D spin and virtual try-on, you can future-proof your business by improving product photos now.
Use tightly framed, bright, vibrant photos
Include up to 10 images
Test various lifestyle formats in addition to product shots
Do not use text overlay on product images
Other attributes, such as colour, material, and size
As with the attribute examples outlined above, use every possible attribute that applies to a product.
Clearly define attributes that help sell a product to the right customer.
Be consistent and concise to enable insertion into product titles and descriptions.
Use words and phrases that will be easily understood by users and search engines. For example, instead of a color attribute “Marshmallow”, consider using the word “White”.
⭐ Important note related to any product optimizations above:
While these capabilities are in place to assist with optimizing your product feed, it’s not recommended to change any product attributes frequently. Doing so can adversely impact product performance for both paid and organic shopping.
Additionally, attributes such as product type, brand, and Google product category are often used to organize and segment Google Ads campaigns, so please DO NOT make any changes here without communicating with your Google Ads folks.
It can wreak havoc on paid campaigns or even break them fully without proper communication between business owners, Google Ads, and SEO teams. So please play nice and over-communicate any optimizations before they happen.
How to update product data?
Now that you know which attributes to update, there are a number of ways you can put them to work. For some businesses, this information will be updated behind the scenes in the website CMS (ie, Shopify, WordPress, etc) and automatically submitted to GMC.
For other businesses, there may be some challenges with getting this information to sync in Google Merchant Center if feed plugins or 3rd party sources are outdated or aren’t correctly configured or managed.
Fortunately, management of product feeds and product information is becoming easier and less technical, which was one of the key objectives of upgrading from classic GMC to GMC Next.
If you don’t already use a feed API or a 3rd party feed solution, the following 2 ways are ideal for easy setup and management:
Feed attribute rules
Supplemental feed uploaded via Google Sheets
If you do not find the option to add either of the above solutions, check your settings to confirm the add-on is enabled.
Go to: Settings > Add-Ons > Advanced data source management
Feed attribute rules
Feed attribute rules work well when there is a large volume of products that require bulk optimization updates directly in Google Merchant Center.
To use this feature, go to:
Settings > Data Sources > Primary Sources(click on the feed name)> Attribute Rules
From here, a number of rules can be created to automatically apply to any feed or supplemental feed already used in Google Merchant Center. You can use a variety of different data source operations, such as:
“Set to”
“Set to multiple”
“Extract”
“Extract multiple”
For example, you can create rules to:
Automatically add a brand name to the beginning (or end) of all product titles
Automatically detect keywords used in product titles and assign a product type
Automatically add key attributes such as color, size, or material to product descriptions if they are not already included
Creating rules within Google Merchant Center is an easy way to manage accounts with a high volume of products while maintaining consistency. You can also preview and test what the rules look like, as well as remove or update them at any point.
If you have never used feed attribute rules, it is recommended to dive deeper to gain a better understanding of how they work before you start making changes. Review Google’s official documentation on attribute rules (previously known as feed rules).
Alternatively, you can reach out to a third party for advice and support or choose a more manual method, such as supplemental feeds.
Supplemental feeds
Another option for updating product information and overriding attributes submitted in the product feed is a supplemental feed. Personal preference will indicate which method you use, but Google Sheets is a straightforward option.
To use this feature, go to:
Settings > Data Sources > Supplemental Sources > Add Supplemental Product Data
If using Google Sheets, remember to set your sharing permissions to allow anyone with the link to view the sheet (otherwise, Google won’t be able to read it).
Supplemental feeds are an ideal solution if:
You don’t use an API, third-party tool, or if you don’t feel comfortable creating attribute rules in Google Merchant Center
You have a manageable selection of products
You want to add or modify information already submitted in your primary feed
You would like to use formulas in Google Sheets to combine columns and optimise product titles directly in the spreadsheet (ie, Brand + Product Title + Product Type + Attribute)
If you need to create custom labels for products that meet certain criteria, such as seasonal products, bestsellers, high-margin products, or promotional products
You would like to use the find/replace function to make bulk changes to specific attributes
How to know what’s working?
Now that you have worked so hard to optimize your product feed and everything is updated in Google Merchant Center, how do you know what’s working? Of course, you will be able to see the actual performance metrics in GMC analytics along with your shop quality score, but how do you get under the hood and actually see the strengths and weaknesses of your feed optimization efforts?
Optmyzr offers a suite of tools specifically for shopping, including:
The Shopping Dashboard is a comprehensive tool designed to provide an overview of all Shopping and PMax Retail Campaigns, as well as the merchant feeds that support these campaigns. It allows you to view, monitor, and optimize retail campaigns from a single, user-friendly interface.
Screenshot shows the Shopping and Performance Max Retail Campaigns widget on the Shopping Dashboard
Shopping Feed Audit
The Shopping Feed Audit tool grades your merchant feed and shopping campaigns based on common parameters to identify quick opportunities for improvement. By providing a series of product, campaign, and product/listing group audits, the tool helps you maintain a well-structured and organized campaign setup.
Screenshot shows the Shopping Feed Audit
Screenshot shows the Feed Audit Score
Smart Product Labeler
The Smart Product Labeler helps you simplify and enhance product labeling in your shopping campaigns. You can create custom rules to label your products based on performance metrics and feed attributes.
You can also get custom suggestions for performance buckets and labels to help you segregate your products more efficiently.
When did feed optimization become so important?
Feed optimization is not a new concept, but it is one that has been gaining more interest since the launch of Google Merchant Center Next and the rise of AI-signaling.
A few reasons for the increased interest are due to growing awareness of the power of feed optimization, the AI signals it provides to assist results and match user intent, along with the rising interest from businesses and SEOs who have discovered the true power of GMC.
Other reasons for increased interest in product optimization:
Improved visibility and product reporting metrics in GMC, including the ability to view both paid and organic shopping results
The merchant opportunities report in Google Search Console
The ability to create custom reports and dashboards in Merchant Center
Go to: Settings > Add-Ons > Custom reports
While this article focuses on product-specific optimizations, it is not intended to be an all-inclusive list of merchant opportunities.
Some other items that directly influence performance on Google Shopping include:
Overall shop quality score
Price competitiveness
Promotions
Shipping and returns
Product ratings
Payment methods
The full rollout of GMC Next replaced the classic Merchant Center experience for all retailers in September 2024, however, many businesses opted to begin using it earlier to become familiar with the newest features. If you’re still getting familiar with the latest version of GMC, roll your sleeves up to acquaint yourself with the navigation, reports, and settings available.
Optimized feeds, optimized performance.
Product feed optimization is one of the most powerful ways to improve performance across Google Shopping and PMax campaigns. When you give Google rich, accurate, and structured product data, you make it easier for your ads to show up in the right places and for the right people. That means more visibility, better clicks, and higher conversions.
Optmyzr’s suite of Shopping tools, like the Shopping Feed Audit, Smart Product Labeler, and custom dashboards, makes it easier to spot issues, apply improvements, and scale your feed optimization efforts with confidence.
Thousands of advertisers — from small agencies to big brands — worldwide use Optmyzr to manage over $5 billion in ad spend every year.
You will also get the resources you need to get started and more. Our team will also be on hand to answer questions and provide any support we can.
Let your bidding strategy scale with your ambition.
Casey Gill is a Senior Google Ads Specialist atWebSavvywith global ecommerce experience across the USA, UK, Europe, UAE, and Australia. She was recently listed as a ‘Top 100 PPC Influencer’ worldwide by PPC Survey.
This article is a reflection of the author’s experiences and opinions. Optmyzr believes that there are many ways to win in digital advertising, and is committed to presenting a diverse range of ideas and approaches.
A sweeping 10% tariff now applies to nearly all imports to the US, with a staggering 125% duty on goods from China (as of this post). While many prices haven’t surged yet, they will soon.
When they do, advertisers will be one of the first to feel the pressure.
Ad budgets will likely get cut, retailers will scramble, clients may panic and as always, marketing will be expected to do more with less.
Thankfully, history and our friends are a wealth of proactive advice!
We’ve dug into previous trade wars and gathered insights from top advertisers, agency leaders, and marketing economists.
In this guide, we’ll break down:
What history tells us about the impact of tariffs on marketing
What’s different (and more dangerous) in 2025
How to protect your budget, prove your value, and keep your strategy sharp — even in a downturn
What does history tell us about tariffs and ad budgets?
This isn’t the first time tariffs have shaken the economy. Here’s what we saw in the past:
“Steel tariffs” (2002–2003)
U.S. steel prices rose by ~30%
Auto and appliance industries slashed marketing and hiring
Ad spend dropped in durable goods and B2B categories
U.S.-China trade war (2018–2020)
25% tariffs on $250B in Chinese imports
Ad spending in retail dropped 5%, and auto ads fell 7%
The common thread here is that when margins get squeezed, advertising is one of the first things on the chopping block. Brands either pull back or shift to lower-cost, more trackable channels.
What makes 2025 different?
According to NRF and Deloitte, 2025’s economic outlook is more fragile than that of prior years:
Retail growth projections dropped to 2.7–3.7%, down from a previously forecasted 4.5%.
Ad growth projections were already revised down by Madison & Wall and MAGNA before the full extent of the tariffs was known.
The IAB reports that 94% of advertisers are worried about cuts, and 60% expect ad budget reductions of 6% to 10%.
Layer on continued inflation, geopolitical tensions, and inventory challenges, and we’re looking at a perfect storm.
What problems could you face, and how could you overcome them?
Here’s what you could be dealing with in the coming months and what today’s top experts suggest doing about it.
Problem 1: Budgets could disappear overnight.
“We had Q2 spend planned and ready — the next day, it was on hold indefinitely.”
— Casey Gill, WebSavvy
“We’re seeing panic responses. Some clients are scaling back before they even run the numbers.”
— Dii Pooler, Pooler Digital
Why this matters:
When headlines trigger panic, budget cuts often happen suddenly — and without warning. If you’re not pacing spend in real time or watching for campaign spikes, you could miss your window to adjust before the budget’s already gone.
What to do:
Offer weekly pacing + ROI check-ins to give clients a sense of control
Prepare “what-if” scenarios so you’re not caught scrambling
Show how even small budgets can still drive performance with the right optimizations
How Optmyzr helps:
Optmyzr’s Budget Pacing feature shows how spend is tracking relative to the ideal pace for the month, adjusting for seasonality, days elapsed, and linear benchmarks. It flags whether you’re underspending or overspending at any point, so you can rebalance before it’s too late.
On top of that, the Anomaly Detector script alerts you when key metrics (like cost, conversions, or impressions) suddenly deviate from expected levels, even down to the hour. That way, if a campaign starts to underperform or overspend before leadership cuts the budget, you already know, and you’re already acting.
“The Budget Pacing tool is a team favorite. It allows us to show visually where the money is going and helps us figure out where best to invest the budget for clients.”
— Mike Rhodes, WebSavvy
Problem 2: You’re optimizing for margins that no longer exist.
“Clients are still optimizing based on pre-tariff product costs. That’s a trap.”
— Duane Brown, CEO, Take Some Risk
“Some brands are upside down on containers they already sold. They’ll lose money on every order once tariffs hit.”
— Sam Tomlinson, EVP, Warschwaski
Why this matters:
If your campaigns are still built around old pricing models, you’re likely overbidding, overexposing, and over-promising. With tariffs pushing up COGS, even previously “profitable” SKUs may now be selling at a loss.
You need to realign your bids and targeting around current product profitability, not pre-tariff assumptions.
What to do:
Help clients recalculate post-tariff margins and rebuild campaign targets accordingly
Segment and prioritize products based on actual margin, availability, and pricing competitiveness
Optmyzr makes it easier to respond to shifting margins with tools that give you granular visibility and control over your product-level campaigns.
With the Shopping Feed Audit, you can catch issues like overlapping products, disapproved listings, missing data, or overpriced SKUs — all before they waste spend.
The Product Group widget helps you split large product groups into tighter segments, so you’re not bidding the same on high-margin and low-margin SKUs.
The Custom Label widget lets you tag products dynamically based on margin, stock level, or pricing competitiveness so your campaigns always stay aligned with your business goals.
“Optmyzr’s monitoring, alerting system, and shopping feed audit were incredibly helpful in keeping campaigns and product feeds optimized. The reporting features generate qualitative reports with one click, which is invaluable during high-demand periods.”
— Matthieu Tran-Van, Consultant
Problem 3: Global messaging needs to shift fast.
“We’re softening our U.S. brand voice when advertising in Canada.”
— Julia Vyse, Digital Director, Dentsu Digital
“Messaging that leans on ‘Made in America’ is landing differently across regions — sometimes not at all.”
— Marilois Snowman, CEO, Mediastruction
Why this matters:
Tariffs aren’t just an economic issue — they’re an emotional one. In times of global tension, how you talk can matter just as much as what you sell.
Messaging that worked three months ago might now feel tone-deaf or even offensive, depending on the market. Geo-sensitive campaigns are no longer optional; they’re essential.
What to do:
Run structured A/B tests across markets to learn what tone, phrasing, or offer resonates best
Experiment with angles like: “Inventory landed before tariff hikes.” “Local quality, global delivery”
Reassess ad copy weekly based on geo-specific performance
How Optmyzr helps:
Optmyzr gives you everything you need to adapt messaging and targeting by geography without guesswork.
The Geo Heatmap helps you spot which locations are driving ROI, and which ones are costing you without converting. You can visualize this data using a heatmap segmented by city, region, or country.
Geo Bid Adjustments lets you automatically raise or lower bids based on a location’s past performance, even if that region wasn’t previously targeted.
And if you’re managing multiple ad accounts, the Ad Analyzer helps you scan campaigns to find winning creatives and flag poor performers across locations, including Meta Ads placements.
Problem 4: Ad spend is being reallocated across channels.
“Search is still seen as gold in volatile times.”
— Ewan McIntyre, Gartner VP & Analyst
“Microsoft Ads is a smart play right now. Low competition, solid returns.”
— Casey Gill, WebSavvy
Why this matters:
When uncertainty hits, advertisers stop experimenting and go back to what works. Search, Shopping, and email/SMS retention tend to hold strong, while CPM-heavy or top-funnel channels often take the first hit.
The challenge is that many advertisers still have their budgets locked into legacy structures — channels that are now too expensive, or product groups that are no longer profitable.
What to do:
Rebalance toward ROI-driven channels like search + shopping
Test platforms with lower CPMs (Microsoft, Pinterest, Reddit)
Double down on email + SMS for retention
How Optmyzr helps:
Optmyzr’s Shopping Campaign Management tool gives you the flexibility and control needed to confidently shift spend where it performs best, especially during volatility.
Launch Google Shopping, Performance Max Retail, or Optmyzr Smart Campaigns (with Target ROAS baked in) all in just a few clicks
Use feed-based rules to filter which products go into each campaign based on performance or custom attributes like margin or price sensitivity
Restructure existing Shopping or PMax campaigns, even those created outside of Optmyzr, by splitting product groups or redefining ad group hierarchies
Reallocate budget dynamically across campaigns and ad groups using advanced bidding and targeting settings
Sync campaigns with real-time feed changes from your Merchant Center — keeping your product ads up-to-date, without constant manual intervention
Problem 5: Inventory gaps will tank your ROI.
“You can’t run ads on products that are out of stock. That kills trust.”
— Andrew Dimitriou, Global Marketing Strategist
“We’ve got brands promoting SKUs they literally don’t have anymore. That’s wasted spend.”
— Sam Tomlinson
“Inventory unpredictability is back, just like COVID. If your messaging doesn’t match your shelf, you’re in trouble.”
— Julie Friedman Bacchini, Founder, Neptune Moon
Why this matters:
Tariffs are already disrupting global supply chains, and as delays and stockouts increase, you risk spending real dollars promoting products that simply aren’t available.
This kind of misalignment doesn’t just waste budget. It confuses customers and erodes trust.
What to do:
Sync campaigns with real-time inventory feeds or Merchant Center updates
Prioritize products with healthy stock levels and solid margins
Monitor campaign performance weekly to catch unexpected drops tied to inventory or feed issues
How Optmyzr helps:
Optmyzr helps you stay ahead of inventory-related issues by surfacing exactly what’s causing your campaign performance to slip, so you can take quick, focused action.
The PPC Investigator analyzes your account’s data and pinpoints the root cause of performance changes, like a drop in conversions or ROAS. Whether it’s a paused product group, an out-of-stock SKU, or a feed issue, you’ll know exactly what’s driving the problem and where to fix it.
With the Cause Chart and Root Cause Analysis, you can drill down by campaign, keyword, product type, or placement to get full visibility on performance volatility, especially helpful when your feed or inventory status is in flux.
Pair this with the Shopping Feed Audit, which flags missing data, disapprovals, and products that have vanished from your campaigns before they create real revenue leaks.
What will smart marketers do differently?
The smartest advertisers right now are:
Running margin-aware campaigns
Shifting spend toward search, shopping, and retention
Offering preemptive messaging around pricing
Helping clients renegotiate SaaS and agency contracts
Automating what can be automated to buy back time
As Jasmine Enberg from eMarketer put it:
“This is a new era of uncertainty, and marketers are already playing defense.”
You don’t need to panic. But you do need to plan.
Tariffs may be outside your control. But how you respond is where leadership lives.
If you only do 3 things after this:
Re-calculate your margins and rebuild bids around profitability
Pivot your messaging to match shifting inventory and customer sentiment
Double down on automation to stretch your time and team further
And if you believe Optmyzr is the tool for you, sign up for a 14-day free trial today.
Thousands of advertisers — from small agencies to big brands — worldwide use Optmyzr to manage over $5 billion in ad spend every year. Plus, if you want to know how Optmyzr’s various features can help you in detail, talk to one of our experts today for a consultation call.
Ever looked at past PPC performance and wished you could tweak reality just a little? Now you can! Introducing Optmyzr RetroEdit™—the world’s first campaign-editing tool powered by quantum PPC technology and advanced time-travel algorithms.
How RetroEdit™ Works
Pick a Past Campaign: Choose any historical campaign.
Select Your Metrics: Want more conversions? Higher revenue? Lower CPC? Adjust any metric you like.
Edit the Results: Type in your desired number and hit “Apply Retroactively.”
Instantly, RetroEdit™ rewrites history to reflect your changes, updating metrics, financial reports, and even your actual bank balance!
Important (and slightly concerning) Warnings
Increasing Revenue: May lead to unexpected bonuses, spontaneous celebrations, or confused accountants.
Decreasing Metrics: Be cautious—reducing conversion values might lead to negative bank balances and awkward calls from finance.
“User Testimonials” from Alternative Timelines
“I boosted my conversions last quarter from 50 to 500. Now I’m employee of the decade and nobody seems to question it!”
— Marty McFly, Flux Capacitor Marketing
“Reduced CPC by 99% retroactively and started receiving random refund checks from Google. Thanks, RetroEdit™!”
— Doc Emmett, Founder, TimeTravel PPC Agency
Reality Check!
Of course, RetroEdit™ isn’t actually real—Happy April Fool’s Day!
While altering history isn’t possible (yet!), Optmyzr helps you optimize your PPC campaigns for real-world success with genuine insights and powerful tools.
Enjoy the laugh, and when you’re ready for real results (in this timeline), Optmyzr is here to help! Sign up for a14-day free trialtoday.
When ad platforms provide guidance, it is often taken as absolute truth. The expectation is that their help documentation and support channels offer accurate, actionable advice.
However, despite providing clear guidance after reviewing the findings from Optmyzr’s experiment, Google spent months telling advertisers PMax exclusions would not be respected if they came from the API.
Here’s Google’s previous documentation:
Here’s Google’s answer in their AI overviews:
The same was shared in their communications with advertisers.
This post outlines an experiment conducted to determine if API placement exclusions work for PMax campaigns, contrary to Google’s previous claims.
It’s worth noting that as a result of this experiment, Google did some digging into their own systems and came up with the following response:
As the screenshot shows, this is how to think about placement exclusions:
We’ll also explore what this means for advertisers and how to navigate support discrepancies moving forward.
What we uncovered from our experiment
Details of the experiment
Optmyzr conducted a controlled experiment to test whether placements excluded via the API would be respected for PMax campaigns. Here’s what we did:
1. Setting up the campaign
We launched a brand new PMax campaign in our brand’s ad account on December 30th 2024. We gave the campaign till Jan 13, 2025 to accrue clicks, impressions, and placements.
2. Applying exclusions
Identifying placements we wanted to exclude, we implemented these exclusions through our API connection. The exclusions appeared at the account level, despite Google’s documentation stating that placement exclusions must be done through the UI. We applied these exclusions on Jan 13, 2025.
3. Monitoring the results
No ad spend occurred on the excluded placements as of Jan 21, 2025, proving the API exclusions were effective. The example placement we chose to follow was “Mobile App: Vita Mahjong (iTunes App Store), by VITA STUDIO PTE. LTD.”
This experiment’s results reveal a stark contrast between Google’s official guidance and the platform’s actual functionality.
What are the implications for advertisers?
1. Documentation vs. reality
This finding underscores the importance of questioning and testing platform limitations. While help documentation serves as a baseline, advertisers can no longer treat it as definitive. PMax, as an evolving ad type, requires a proactive approach to testing features and functionalities.
2. Efficiency through the API
Excluding placements via the API is significantly more efficient than using the UI. The UI process involves cumbersome formatting and limitations, which can deter advertisers from making necessary exclusions.
The API’s effectiveness, as demonstrated in our experiment, offers a faster, more scalable alternative.
The miscommunication around how placement exclusions are respected came from the very real issue all SAAS faces: innovation happens faster than support documentation can keep up.
What advertisers should do next
1. Embrace testing
Treat every rule or limitation as an opportunity to test. The findings from this experiment reinforce the need to verify functionality instead of relying solely on documentation.
2. Leverage tools and expertise
If you’re an Optmyzr customer, rest assured that our rule engine and smart exclusions protect your accounts effectively. For non-customers, consider engaging with experts like Nils Rooijmans and Mike Rhodes, who offer many scripting solutions and insights.
3. Active account management
Ensure your accounts are actively monitored. Automated rules are valuable but should not replace ongoing oversight. Regular checks are critical to adapting to platform changes and discrepancies.
A balanced perspective
Despite these challenges, Google remains a meaningful channel for advertisers. Properly applied exclusions and strategic management can yield exceptional results. Optmyzr customers can use our Smart Exclusion tool to quickly identify and exclude wasteful exclusions. We also encourage testing alternatives like Microsoft’s PMax and exploring other platforms.
At Optmyzr, our mission is to safeguard your ad investments. By staying informed and proactive, you can navigate the complexities of digital advertising and adapt to the fast-changing industry
Not an Optmyzr customer yet? Now’s the best time to sign up for a full functionality 14-day free trial.
Thousands of advertisers — from small agencies to big brands — worldwide use Optmyzr to manage over $5 billion in ad spend every year.
You will also get the resources you need to get started and more. Our team will also be on hand to answer questions and provide any support we can.
For years, Cyber Monday has held the title of the biggest online shopping day, and recent reports like Adobe’s 2024 study confirm this with $13.3 billion in total e-commerce sales, compared to Black Friday’s $10.8 billion.
But here’s where things get interesting: when we narrow the focus to Google Ads-driven sales, the narrative flips. Optmyzr’s analysis of 11,423 accounts found that Black Friday consistently outperforms Cyber Monday in ad-driven conversion value.
Does this mean advertisers may be focused on the wrong day to drive most of their sales? Let’s dig into the findings and see what they mean for marketers.
The data that flips the script
From Optmyzr’s perspective based on a subset of accounts:
Black Friday 2024 (Nov 29) drove $94.62 million in Google Ads-attributed conversion value, eclipsing Cyber Monday’s $64.07 million.
The average value per conversion on Black Friday was $85.09, significantly higher than Cyber Monday’s $74.82.
These findings reveal that for advertisers leveraging paid media, Black Friday is the clear leader—not Cyber Monday.
Optmyzr’s study about Black Friday vs. Cyber Monday
Ad Spend
Conversion Value
Value per Conversion
ROAS
2024
Black Friday
$15,321,664
$94,624,043
$85.09
617.58%
Cyber Monday
$14,121,621
$64,070,399
$74.82
453.70%
Ad Spend
Conversion Value
Value per Conversion
ROAS
2023
Black Friday
$13,990,189
$101,574,600
$78.37
726.04%
Cyber Monday
$13,250,633
$71,587,342
$69.88
540.26%
This Optmyzr data is as of Dec 7, 2024 for 11,423 accounts that advertised on Google Ads on Black Friday and Cyber Monday this year and last year. Note that conversion values are self-reported by advertisers, and that the 2024 conversion value numbers are likely going to be higher than what is shown here due to conversion delays.
Why Cyber Monday isn’t always the clear winner for ecommerce
So, why does Adobe’s data crown Cyber Monday the overall e-commerce champion, while Optmyzr’s data gives the edge to Black Friday? The answer lies in segmentation and shopping behavior:
1. Broader ecommerce vs. paid media attribution
Adobe tracks all e-commerce sales, regardless of traffic source. Cyber Monday’s strength comes from organic and direct channels like email marketing, bookmarked deals, and returning visitors. Optmyzr focuses specifically on sales attributed to Google Ads, where Black Friday’s urgency and high-ticket deals drive stronger ad-driven performance.
2. The role of urgency in Black Friday ads
Black Friday is a high-advertising day, with retailers flooding paid media with aggressive promotions for big-ticket items. Shoppers are primed to click and convert, leading to higher ad-attributed sales.
3. Cyber Monday’s organic advantage
By the time Cyber Monday arrives, many shoppers have bookmarked deals or received email reminders, reducing reliance on ads. The day’s strength lies in smaller, follow-up purchases driven by organic and direct traffic.
Why should you care
For advertisers, understanding the segmentation between total e-commerce sales and ad-driven performance isn’t just an exercise in analytics—it’s the key to making smarter budget decisions. If you rely on Google Ads to drive your holiday sales, the conventional wisdom that Cyber Monday is the biggest online shopping day might lead you to misallocate resources.
Optmyzr’s data shows that Black Friday drives more value for paid media campaigns, suggesting that ad budgets and strategies should align with the day’s urgency and consumer behavior. Recognizing these nuances enables advertisers to optimize their campaigns for maximum return, standing out in a crowded holiday marketplace.
What you should take away
Advertisers should rethink how they approach Black Friday and Cyber Monday 2025 in their holiday strategies. Here’s how to act on these insights:
1. Double down on Black Friday ads
If you’re running Google Ads, Black Friday offers unparalleled opportunities for high-value conversions. Allocate larger budgets to capture the wave of motivated shoppers and focus on premium products and bundled deals.
2. Leverage Cyber Monday’s organic strength
Cyber Monday remains vital, but its strength lies outside of paid channels. Use retargeting and email campaigns to re-engage shoppers who browsed during Black Friday.
3. Reevaluate attribution models
The segmentation between total sales and ad-attributed sales underscores the importance of understanding your channel performance. A broader e-commerce win for Cyber Monday doesn’t diminish the fact that Black Friday delivers better results for paid media campaigns.
Tailor your campaigns based on data
The holiday shopping narrative has long been dominated by Cyber Monday’s total sales supremacy. But Optmyzr’s data suggests that for advertisers using paid media, Black Friday is the real champion.
This insight challenges conventional wisdom and opens up new possibilities for advertisers looking to make the most of their holiday budgets. By recognizing the strengths of both days and tailoring campaigns accordingly, you can drive performance that outpaces competitors who stick to the old playbook.
And after what you read here, if you think Optmyzr is the tool for you to drive higher performance, sign up for a 14-day free trial today.
Thousands of advertisers — from small agencies to big brands — worldwide use Optmyzr to manage over $5 billion in ad spend every year. Plus, if you want to know how Optmyzr’s various features help you in detail, talk to one of our experts today for a consultation call.
In Google Ads, attracting the right traffic isn’t just about selecting keywords—it’s about aligning those keywords with user intent. Understanding when to use exact match, phrase match, broad match, or negative keywords is crucial for maximizing ad spend and targeting effectively.
The stakes are high: the wrong match type can waste budgets on irrelevant clicks, while the right choice can drive higher click-through rates, return on ad spend, and quality leads.
This guide provides a clear, practical breakdown of each match type. You’ll learn the strengths and weaknesses of exact, phrase, and broad match, along with the best use cases and key findings from our latest match type study which analyzes data from Q3 2024 (July to September) on advertiser preferences and performance.
What are the different keyword match types in Google Ads?
Google Ads offers three main keyword match types, each with unique targeting criteria:
Exact Match (EM): Targets searches that closely match the keyword, delivering high precision with limited reach.
Phrase Match (PM): Matches ads to searches that align with the keyword’s meaning, even if wording or order varies.
Broad Match (BM): Provides the widest reach, allowing ads to show for a broad array of related searches.
These match types suit different campaign goals. Understanding their individual advantages allows advertisers to structure campaigns for the best performance.
When to use each match type?
Exact match: Best for precision
Ideal for branded keywords or high-intent searches where relevance is key
Ensures minimal wasted clicks and higher engagement from users who search for the exact keyword meaning
Works best in campaigns targeting specific product terms or high-value, bottom-of-funnel audiences
Phrase match: Balance between reach and control
Useful for competitive markets and thematic keyword groupings
Helps broaden reach to intent-aligned searches while maintaining relevance
Effective for capturing closely related search queries without overly restricting traffic
Broad match: Maximizing reach with Smart Bidding
Ideal for top-of-funnel campaigns or discovering new audiences at scale.
Works well when paired with Smart Bidding to improve relevance by analyzing user intent in real-time.
Requires careful monitoring and the use of negative keywords to avoid irrelevant clicks.
Performance insights from our study
Strategic Data: Our November 2024 analysis of 992,028 keywords across 15,491 ad accounts highlights the unique strengths of each match type:
Source: Optmyzr Keyword Study - November 2024
Key Takeaways:
Exact Match achieves the highest ROAS (415%) and CTR (21.66%), proving its value for high-intent campaigns.
Phrase Match shows a strong balance with a high conversion rate (9.31%) and solid ROAS (313%), making it ideal for advertisers needing both control and reach.
Broad Match delivers high volume at a lower ROAS (277%) and CTR (8.5%), making it suitable for large-scale or exploratory campaigns where volume outweighs precision.
Our analysis of keyword match types from 2022 to 2024 reveals consistent patterns in how advertisers allocate their keywords across broad, exact, and phrase match types. The distribution of match types has remained largely stable over the past two years, with only minor shifts in usage:
Broad Match: Increased from 33.12% in 2022 to 36.67% in 2024 (+3.55%).
Exact Match: Declined slightly from 37.11% in 2022 to 34.35% in 2024 (-2.77%).
Phrase Match: Marginally decreased from 29.77% in 2022 to 28.98% in 2024 (-0.79%).
This consistency highlights that advertisers continue to use match types in similar proportions, suggesting their strategic value has not significantly changed over time.
Phrase match still dominates in terms of usage, followed by exact match, with broad match showing the most growth—likely due to advancements in Smart Bidding and Google’s improved intent-matching algorithms.
So what does this data say?
The relatively static distribution reflects how each match type serves distinct campaign goals:
Phrase Match remains a popular choice for balancing reach and relevance, particularly in competitive markets.
Exact Match continues to serve as the go-to for precision targeting, despite a slight decline in usage.
Broad Match shows steady growth, indicating more advertisers are willing to leverage it for discovery and scale, particularly with the support of Google’s AI-driven bidding strategies.
These findings reinforce the importance of understanding when and how to use each match type effectively, as their roles in campaign strategy remain crucial even amidst changes in Google Ads’ algorithms and AI capabilities.
To maximize results, you need to optimize campaigns regularly by analyzing keyword performance, adjusting bids, and refining negative keywords. Brand exclusions and inclusions are also useful tools, particularly when working with phrase and broad match, to control the quality and relevance of ad placements.
Best practices for each match type
Exact match tips
Stick to specific keywords: Limit exact match to precise, high-intent terms, such as brand names or product-specific keywords.
Monitor regularly: Adjust keywords based on performance to ensure that you’re not missing out on potential traffic due to overly narrow targeting.
Phrase match tips
Organize thematically: Group keywords by related themes to improve relevance.
Use brand exclusions: Prevent ads from appearing on searches for your brand terms that you already have in branded campaigns.
Add negative keywords: Continuously refine your negative keyword list to filter out less relevant searches.
Broad match tips
Leverage smart bidding: Broad match works best with Smart Bidding, which adjusts bids based on Google’s analysis of search intent.
Track search terms: Regularly review search terms and add irrelevant queries as negative keywords.
Use brand inclusions: For increased precision (but lower volume), consider allowing ads only on queries related to your brand.
Capture the right clicks with precise targeting
In Google Ads, your choice of keyword match type is more than just a technical detail.
But no match type is a magic bullet. Success requires a hands-on approach—analyzing performance, adjusting bids, adding negative keywords, and refining your strategy as the data comes in.
If you need help with that from a proven set of tools, try Optmyzr.
Success in advertising isn’t just about driving immediate sales; it’s about building long-term growth and sustainability. While most advertisers rely on metrics like ROAS and ACoS to measure campaign performance on Amazon, these metrics don’t speak to how your overall sales have grown due to your advertising activities.
You need to look beyond short-term wins and focus on strategies that improve your overall paid and organic business growth.
For Amazon advertisers, TACoS is a more robust metric that can provide you with a more complete picture of your campaign’s performance.
In this article, I’ll walk you through everything you need to know to get started with TACoS and how to manage it for greater product visibility and less reliance on ads.
What is Amazon TACoS?
Amazon TACoS, or Total Advertising Cost of Sale, is a metric that measures ad spend against total sales (both ad-driven and organic). Monitoring TACoS enables you to gauge the efficiency and impact of your Amazon ads on a more macro level, as I’ll discuss in the following sections.
Unlike ACoS (Amazon Advertising Cost of Sales; which only accounts for revenue generated through ad-driven sales), TACoS helps you see how your ad efforts contribute to your total sales growth, including organic sales (which might be influenced by advertising).
Why you should consider organic sales when evaluating ad performance
Organic sales (i.e., sales generated through non-paid sources) increase with greater brand awareness or organic rankings, both of which your ads might influence (either directly or indirectly). When you evaluate ad performance with only ACoS, you overlook the long-term impact ads can have on organic sales—whereas TACoS captures the full picture.
Declining TACoS over time shows that your business is becoming less reliant on ads to drive revenue and more on organic growth.
The difference between TACoS, ACoS, and ROAS
Every metric offers a different perspective on advertising efficiency, and understanding each of their distinct roles and the specific insights they provide helps you know which metric(s) to track.
Here’s a quick overview of the metrics:
METRIC
FOCUS
FORMULA
IDEAL USE CASE
ROAS
Revenue return on ad spend
Ad revenue / Ad Spend
Measuring profitability of ad campaigns
ACoS
Efficiency of ad-driven sales
(Ad spend / Ad revenue) * 100
Tracking short-term campaigns focused on direct sales
TACoS
Impact of ads on total revenue
(Ad spend / Total sales) * 100
Tracking long-term strategy for balancing ad-driven and organic growth
Return on Ad Spend (ROAS)
ROAS, or Return on Ad Spend, measures ad efficiency in terms of revenue generated relative to ad spend.
When to track ROAS: Use ROAS to measure campaign-level profitability, especially in paid search and display advertising. Since ROAS only accounts for ad spend and revenue, it omits the impact on organic sales and thus doesn’t provide a complete picture of how your ads affect total sales.
Advertising Cost of Sale (ACoS)
ACoS, or Advertising Cost of Sale, measures the cost of advertising relative to the revenue generated solely from ad-driven sales. You can use it to assess the immediate efficiency of your ad spend (a lower ACoS is more efficient).
When to track ACoS: Use ACoS to answer the question, “How much did I spend to make this sale through ads?” You can also use it to measure campaign performance over the short term (i.e., when the goal is direct sales through ads).
Total Advertising Cost of Sale (TACoS)
TACoS, or Total Advertising Cost of Sale, includes both ad-driven and organic sales to give a fuller picture of the impact of ads on total revenue. It can indicate how your ads contribute to both immediate sales and brand growth over the long run.
When to track TACoS: TACoS is invaluable for guiding long-term strategy. It helps you track organic growth alongside ad spend, making it a key metric for brand-building campaigns where you want to see a reduction in TACoS over time (as organic sales increase). TACoS that declines over time suggests a healthy balance between ad-driven and organic sales, and signals reduced dependency on paid ads.
Why TACoS is north star metric for Amazon advertisers
While ACoS has been the traditional metric Amazon advertisers use to measure ad spend efficiency, we’ve seen (in the previous sections) that it has a very narrow focus.
You need to track TACoS for a more comprehensive picture of your company’s performance. It is important to note again that the goal of investing in advertising is not just to get more ad-driven sales, but also to build awareness, improve rankings, and ultimately lower your reliance on paid ads—all of which you can track by monitoring TACoS.
While ACoS may remain stable or even increase during certain periods, if your TACoS goes down, it’s a sign that your ads are working as planned, creating more organic interest and sales.
So, a lower TACoS means you’re getting more value out of your ad bucks and becoming less dependent on ads to keep sales steady.
In a way, TACoS is like a long-term health check for your ad strategy. If your TACoS is dropping, it’s telling you that your brand is gaining strength organically, which is what every business wants.
Manage TACoS in Amazon Ads: Best practices
Now that you know when to track TACoS, follow the best practices below to ensure that you’re getting actionable insights from this data:
Include all product variations to avoid skewed data
Balance between product and brand campaigns
Track TACoS by product or product group
Set different KPIs for TACoS at various stages of the product’s lifecycle
1. Include all product variations to avoid skewed data.
Make sure you include all variations of your products (i.e., different sizes, colors, flavors, etc.) when tracking TACoS. This helps you get an accurate view of how your whole product line is performing. With all variations included, you can easily spot which products are naturally gaining organic traction and which ones might still need a little extra ad support.
This will prevent you from overspending on ads for products that are doing well on their own, and enable you to allocate budget where it will make a bigger difference.
2. Balance between product and brand campaigns.
Amazon offers different types of ads to help you reach your goals: Sponsored Brand Ads to build brand awareness and Sponsored Product Ads to drive sales of specific products. Knowing when to use each type can make a big difference in managing your TACoS.
Brand campaigns can have a powerful, long-term impact on TACoS. They work by boosting brand awareness, which translates into more organic sales over time, gradually lowering your TACoS. On the other hand, product-specific campaigns tend to generate quicker sales but often rely more on ad spend, which can keep TACoS higher initially.
A smart approach is to balance your ad spend between these objectives:
Use brand campaigns for steady, long-term TACoS improvement
Use product campaigns to drive immediate sales when needed
This way, you’re setting yourself up for both immediate results and lasting growth.
3. Track TACoS by product or product group.
While tracking ACoS at the campaign level can give you some insight into ad performance, it doesn’t tell the whole story—especially since each product behaves differently depending on where it is in its lifecycle.
When you track TACoS at the product level, you get a clearer view of which items are thriving from your ad spend in terms of both paid and organic growth. Products that perform well typically have a lower TACoS because they’re gaining strong organic sales, while newer products may have a higher TACoS as they rely more heavily on ads to get noticed.
If you’re only looking at ACoS, high numbers might seem concerning. But TACoS paints a fuller picture by factoring in organic sales generated by your advertising. In the early stages, you might see a higher TACoS, but as the product gains traction and starts pulling in organic sales, TACoS should naturally decrease.
Tracking TACoS at the product level helps you stay focused on both short-term and long-term goals. It allows you to see where ad spend is working to boost organic growth, so you’re not just chasing immediate results but building a more sustainable business.
ACoS may remain stable or increase, but if a product performs well, tracking TACoS will reveal a decline over time as organic sales grow and reliance on ad spend decreases.
4. Set different KPIs for TACoS at various stages of the product’s lifecycle.
Now that you know that TACoS can vary across product groups and lifecycle stages, it’s good practice to also set different expectations for each group or stage:
PRODUCT SCENARIO
WHAT TO EXPECT
THE GOAL
Product launches (High TACoS)
Expect a higher TACoS for new launches because they need greater ad investment to drive initial awareness.
At this stage, the goal is to establish product visibility and boost organic ranking over time.
Established products (Moderate TACoS)
For products that have been around a while or recently went out of stock, TACoS may temporarily increase as ads help re-establish their organic rankings.
Here, the goal is to recover organic traction rather than immediate profitability.
High-converting products (Low TACoS)
For established products, TACoS should reflect a lower dependency on ads and hold higher organic strength.
The KPI here is a lower TACoS, indicating that the product now sustains on organic sales with minimal ad support.
How to improve TACoS and overall ad strategy
The bottom line is that lower TACoS means less reliance on ad spend to drive product sales. Follow these tactics to position your product listings for organic growth so that you can divert ad budget to where it’ll make the greatest impact:
Optimize product listings for organic visibility
Focus on long-tail keywords in ads
Leverage seasonal and promotional campaigns
Use bid adjustments to optimize spend
Analyze and pause non-performing ads
1. Optimize product listings for organic visibility.
If a product’s TACoS remains high despite consistent ad spend, the listing may need better content. Improve your product titles and descriptions with relevant, high-traffic keywords to increase organic searchability.
High-quality visuals and Enhanced Brand Content (EBC or A+ content) help improve conversion rates, which can drive organic ranking. When your listings are optimized and appealing, you’ll rely less on ads to maintain visibility, which helps bring down TACoS.
2. Focus on long-tail keywords in ads.
Long-tail keywords are usually less competitive and can yield higher conversion rates than more generic head terms. These keywords help drive initial sales without significant ad spend, increasing organic ranking over time and reducing TACoS.
Keep an eye on which keywords perform well and refine your targeting to make sure your product appears in the right searches. Also, be aware that optimizing product listings for long-tail keywords likely means fewer impressions relative to head terms (but, again, these terms should convert more frequently as well).
3. Leverage seasonal and promotional campaigns
Increase ad spend during high-demand seasons like holidays and festivals to maximize sales and organic ranking. Even if TACoS goes up a bit during these periods, the boost to organic sales afterward can be well worth it.
If you run a promotion, monitor TACoS afterward to see if those extra organic sales persist. If so, your strategy has likely helped build a stronger organic presence.
4. Use bid adjustments to optimize spend
Regularly review and pause or lower bids on keywords that don’t convert as well. Direct more budget to high-conversion keywords that support both ad-driven and organic sales to improve TACoS.
Adjust and increase your bids during high-demand times, like holiday seasons, to capture more conversions when shoppers are most active. This can increase ad-driven conversions and reduce the need for ad visibility throughout the year, helping you improve your TACoS over time.
Products with lower TACoS benefit from high organic sales, so you can gradually reduce ad spend and adjust your bids to focus on cost-effective keywords. This frees up budget to support newer or underperforming products. Allocate more budget here and increase your bids to improve visibility and drive early growth.
5. Analyze and pause non-performing ads
Make it a habit to review your ads at regular intervals, pausing any that aren’t bringing in conversions or have a high ACoS. By reallocating budget to ads that consistently perform well, you not only improve immediate results but also increase the chance of these ads positively impacting organic rankings.
Build a sustainable growth strategy with TACoS
Using TACoS effectively means thinking beyond the immediate results of your ads and recognizing the broader role they play in building sustainable, organic growth. By tracking TACoS, you’re able to see not only how your ads perform but also how they help your products gain traction over time.
If you have your TACoS data, Optmyzr can make all actionable steps, like bid adjustments and keyword optimizations, simpler by enabling bulk changes. You can use the Rule Engine to integrate TACoS data directly into your ad strategy and automate your ad spend optimization based on that data.
When tracked efficiently, TACoS can reveal your business’s growing independence from ad spend. It can be your strategic tool for building a stronger, more self-sustaining brand on Amazon.
Performance Max revolutionized the way marketers advertise on Google, allowing them to advertise across Search, Youtube, display, Discover, Gmail, and local with a single budget and different creatives. Some have fallen in love with the ad type because it removes the bias from budget allocation, while others distrust it because PMax doesn’t allow for as much control and reporting as conventional Google campaigns.
However, the biggest reason PMax is such a polarizing campaign type is because there are no concrete best practices on what makes a successful PMax structure. So, we decided to investigate the most common PMax trends and shine a light on the ones that perform best as well as the tactics that underperform.
In this study, we’ll assess:
Whether what the majority of advertisers are doing is profitable
The impact of other campaigns on PMax
Whether human bias affects performance
How creative and targeting choices impact PMax
What a ‘healthy’ PMax campaign looks like
Methodology
Before we dive into the data, it is worth noting that there is a mix of ecommerce and lead gen campaigns in the cohort.
A total of 9,199 accounts and 24,702 campaigns are included in the data.
Accounts had to be at least 90 days old and have conversions.
Accounts had to have at least $1,000 monthly budget and could not exceed a $5 million monthly budget
We did our best to account for different structure and creative choices, however data at this scope cannot perfectly segment out each use case. We dug into a random assortment of accounts in each question (below) to confirm trends we’re seeing.
Data Questions & Observations
Below, you’ll find the raw data from the study. We’ve also organized the findings in the sections that follow.
Raw Data
Typical structure:
Impact on performance when an account was below or above the average for typical structure:
Only PMax or Media Mix:
Other Campaign Types Present:
This table shows the performance of the PMax campaigns when an account did or did not have the specified campaign type.
Bidding Strategies Used:
This is the breakdown of how each bidding strategy in PMax performs.
Impact of Using Exclusions:
This data shows the impact of using brand exclusion lists and other types of exclusions (negative keywords, placements, and topics).
Is Feed Present:
This data highlights whether there’s a feed in the PMax campaign.
Impact of Audience Signals:
Impact of Search Themes:
PMax Structure:
In the interest of making it easier to understand each Pmax campaign type, we’re applying labels to them:
Starter Campaigns: one campaign/one asset group
Focused Campaigns: multiple campaigns/one asset group
Conversion Hungry Campaigns: one campaign/multiple asset groups
Mixed Campaigns: multiple campaigns/multiple asset groups
How Many Conversions Does PMax Need?
Number of Assets and Types of Assets:
*note there aren’t enough statistically significant amount of advertisers using hotel ads, but we wanted to share the data for those who do use that format.
Percentage of Spend Going To PMax:
What Are Most Advertisers Doing & Is It Profitable?
We organized the findings by major category.
PMax Structural Choices
Most advertisers (82%) in the study run Performance Max alongside other campaign types. The data shows PMax campaigns struggle when paired with other campaign types, which lends credibility to Google’s claims that other campaigns will take priority over PMax.
In addition, there is no clear majority on PMax structure. With that in mind, multiple campaigns with a single asset groups have the best ROAS, second highest conversion rate, and CPA. A single campaign with one asset group might win on CPA and conversion rate, but has the weakest ROAS.
A slight majority of advertisers (55%) don’t use feeds in their PMax campaigns, and see better conversion rates and CPAs, with weaker ROAS. One can infer accounts with feeds are ecommerce and using Max Conversion Value.
Most accounts meet the 60+ conversion threshold needed for success with PMax. Those who didn’t saw worse performance across the board (save CTR).
Pmax Strategy Choices
A slight majority (55%) use the Max Conversion Value bid strategy. 45% use thes Max Conversions bid strategy. Predictably, Max Conversion Value does better with ROAS, while Max Conversions does better with CPA and conversion rate. CPCs and CTR are slightly better for Max Conversion Value.
Surprisingly, the majority of advertisers don’t use exclusions (brand lists, negatives, topics, and placements). Most advertisers (58%) saw a slight improvement in performance when they had no exclusions, but it was ultimately flat. It’s worth noting almost no advertisers use the brand list exclusions (97%) and it was even flatter.
Ninety-two percent of advertisers use audience signals and their accounts struggled on all metrics, save for CTR and ROAS (which were essentially flat). This puts in question whether it’s worth the effort to add in audience signals and if the data seeding the signals can be trusted.
Seventy-one percent of advertisers use search themes and results are mixed, but mostly favor NOT using them.
Most marketers (57%) use all assets available (call to action, text, video, and image). They achieved ‘average’ performance across the board. Interestingly, the ‘best’ performance belonged to PMax campaigns using only text assets. However, this defeats the purpose of PMax, which is designed to help budget go where it can do the most good (visual content and text content). It also illustrates that our perception of ‘best’ is skewed by a search bias.
Perhaps the most surprising insight is how much budget advertisers allocate to PMax—51% of advertisers allocate more than 50% of their budget to this campaign type. Campaigns in these accounts have the strongest ROAS, however every other metric is mixed.
What Impact Do Other Campaigns Have on PMax?
I was not expecting other types of campaigns to ‘triumph’ over PMax campaigns in the same account: Many advertisers assume that PMax will cannibalize branded search and will get preferential treatment in the auction. However, the data seems to suggest that PMax almost always takes a backseat to siloed campaigns.
While the most common other campaign type (Search) had the most obvious wins over Pmax, Shopping had fairly impressive wins as well.
It’s worth noting that visual content (Video and Display) is fairly flat on ROAS, and Display is flat on CPA. This suggests that these campaigns are not as focused on conversion.
Percentage of Spend Going to PMax:
As I mentioned above, there are a surprising number of marketers putting more than 50% of their budgets towards PMax. While these marketers saw the strongest ROAS in their PMax campaigns (625.03%), there are also potential conversion rate and CPA advantages when keeping PMax limited to 10%–25% of the budget.
Does Human Bias Help or Hurt PMax Performance?
PMax’s core guiding logic is ‘profit without bias.’ However, this is also a source of friction for advertisers who are used to having near-complete control. Based on the data, it seems like adding exclusions hurts performance.
This could be for a few reasons:
Branded traffic is cheaper and has better conversion rates. That said, performance was fairly flat between brands that excluded branded terms and those that left them in.
The exclusions were too strict and caused performance issues due to missed placements.
While we can’t say that the exclusions were inherently a bad idea, they represent clear bias around what we think has value. Based on the data, there may be value in loosening exclusions, leaning into content safety settings instead.
The relatively flat performance between these differing tactics is interesting, but not conclusive.
How Do Creative & Targeting Choices Impact PMax?
There’s a common assumption that doing more work on a campaign should lead to better results. Taking the time to teach the algorithm what you value should lead to better results.
However, the data seems to contradict this assumption.
Impact of Audience Signals:
Impact of Search Themes:
As we can see, performance is flat (or worse) when Audience Signals and Search Themes are included. This seems to indicate that investing the effort on these tasks isn’t worth the ROI.
However, it’s also worth remembering PMax will take a back seat to siloed campaigns. Search Themes remain one of the most powerful ways to ‘mark’ traffic for PMax (over siloed campaigns). This is because Google prioritizes exact search terms going to exact match.
Brands should be intentional with audience signals and search themes, treating them as guidelines instead of hard targets.
With regard to creative, while the majority of advertisers lean into all assets, there seems to be a decided benefit to just including the assets you can reasonably support. There is no denying the text-only asset cohort skews the numbers for including one asset, however the correlation on ROAS supports not including creative just for the sake of it.
It’s also important to remember the wide ranges of CPAs reflect a wide range of industries, and there are some categories with statistically insignificant data.
Number of Assets and Types of Assets:
If there’s one ‘magic’ creative button for PMax, it’s video. While text-only had the best overall metrics, those are limited exclusively to Google Search. Video’s strength is that it keeps up with text while accounting for lack of focused transactional intent.
From these two datasets, you can see that it’s best not to mindlessly fill out all the fields. Be intentional about your targeting and creative choices, honoring the point of the ad channel you’re using to reach customers.
What Does a Healthy PMax Campaign Look Like?
Now that we’ve investigated what the majority of advertisers are doing, let’s look at some directional queues we can take from the data.
PMax Structure:
The metrics seem to favor running multiple campaigns with one asset group per campaign, allowing brands to utilize unique budgets and negatives. However, there are also CPA and conversion rate gains associated with one campaign-one asset group.
This inspired us to investigate whether the latter group were ecommerce advertisers building on the habit of Smart Shopping (which didn’t require as much segmentation). However, most marketers in this category didn’t attach a feed and had better results. So, there is something to the single campaign and asset group strategy.
These findings run counter to the data that we pulled last time and shows Google has significantly improved how it understands user queries. That said, if you can find the conversions, multiple campaigns with a single asset group are the way to go because they guarantee budget access for the parts of your business you care about.
We took some benchmarks on how most of the 9,199 accounts are structured and found the following averages:
3 PMax campaigns per account
4 asset groups per campaign
34 assets per asset group
We explored accounts that fell below and exceeded these numbers:
These figures are mostly impacted by the number of asset groups and assets. The data seems to indicate fewer and more thoughtful entities have a higher chance of success than loading up on all the assets and asset groups.
Finally, we couldn’t have a complete conversation about healthy campaigns without diving into conversion thresholds.
How Many Conversions Does PMax Need?
It shouldn’t surprise anyone that PMax needs more conversions to be useful, but what is surprising is how flat CTR is compared to conversion rate. I would have expected CTR to have more volatility at lower conversion rates, (due to Google trying to figure out which traffic is valuable).
This data supports the idea of limiting campaigns if you won’t be able to hit 60+ conversions in a 30-day period.
Tactics from the Data
As we stated previously, we’re not going to declare one path as correct or incorrect. However, based on the data, we feel confident sharing the tactics below:
Multiple asset groups in the same campaign don’t work as well as ad groups in a campaign because there aren’t asset group-level negatives. Depending on your budget and ability to meet conversion thresholds, you can decide to run a single PMax campaign with a single asset group or multiple campaigns with a single asset group.
Be careful about biases on where ads should serve and how many negatives to include. While some exclusions are necessary for brand safety, the data is clear that PMax needs fewer limitations on its learning. Consider using account-wide exclusions over campaign-level ones.
PMax is designed to work in concert with your other campaigns, and brands that rely solely on PMax (as well as brands that run Pmax on auto-pilot) will struggle to achieve sustainable results. Brands that use PMax as a testing ground for keyword concepts, placements, and other insights will get more out of this campaign type because they are allowing the bias-free traffic to add incremental gains.
Experts React
“It was super exciting to dive into research that explores such a dynamic and evolving campaign type as Performance Max (PMax). This study offers valuable insights that both confirm and challenge established PPC strategies.
One of the standout findings is the critical importance of conversion volume. The data reinforces the idea that achieving an optimal level of conversions is essential for campaign performance. This makes it a key consideration when planning or restructuring campaigns - ensuring enough conversion data is present to enable effective machine learning and optimization.
I also found the analysis of campaign and asset group configurations intriguing. While it would be useful to further explore how these configurations differ across ecommerce and lead generation accounts, the findings can serve as a solid foundation for further experimentation and optimization.
Moreover, the study challenges some widely accepted beliefs about audience signals and search themes. The findings suggest that adding more signals doesn’t always result in significant performance gains, which prompts a re-evaluation of the resources invested in these areas. This invites a fresh perspective on how we approach campaign management - focusing less on volume of inputs and more on the quality of core components like conversion data and asset structure.”
Julia Riml, Director of New Business, Peak Ace
“The most important finding to me (and further confirming what we already knew) is the importance of sufficient conversion volume which is important for machine learning to work to it’s full potential and which also guides our optimization steps.
The aspects I found most surprising were how many advertisers seem to be running PMAX as a standalone campaign (without search, video and display campaigns accompanying it) and that PMAX campaigns that didn’t utilize a feed (lead generation?) on average tend to perform better with regards to CVR and CPA.
Lastly, it shows the importance of diversifying your spend - the more you spend on PMAX in relation to other campaign types, the worse your CVR and CPA tend to be.
Super intriguing stuff and a must read for everyone working with Google Ads."
Boris Becceric, Google Ads Consultant, BorisBecceric.com
“I am a PMax skeptic, however this analysis presented me with a few surprises, in among what we already know to be true. It is not a surprise that PMax performs better with max conversion value and with more conversion data. However, I am surprised at the amount of advertisers spending the bulk of their budget on PMax, and at the impact (or lack thereof) of exclusions.
As with anything in the PPC world, it remains important to assess your individual business context. What metrics are most important to you? At the very least, I’d argue PMax now deserves to be tested by everyone who can accurately assess/import conversion value.”
Amalia Fowler, Owner, Good AF Consulting
“This Performance Max study provides valuable insights into the strengths and weaknesses of this Google campaign type. The most striking finding I noticed is that PMax often plays a secondary role compared to other campaign types like Search and Shopping, indicating that PMax does not always receive preferential treatment in the auction process.
The data suggests that multiple campaigns with a single asset group yield the best ROAS, and that limiting exclusions and avoiding the indiscriminate addition of assets are key to success. Despite the growing adoption of PMax, human bias can sometimes hinder performance by imposing too many restrictions. From my experience and knowledge I would highly recommend to make sure to test best practices and always be aware that it’s not a one-size fits all campaign type.”
Lars Maat, Owner, Maatwek Online
“One of my biggest takeaways from this study is that PMax seems to perform better when it’s targeted well and not used more broadly. For example, multiple campaigns with one asset group being one of the highest performers stood out to me. PMax learns at the campaign level so, perhaps these campaigns are more highly targeted allowing the campaign to learn exactly who to target. While the one PMax with multiple asset group set up more than likely has variation by product or service type meaning multiple types of customers need to be targeted. As mentioned, PMax lacks the ability to have asset group level exclusions or asset group level ROAS/CPA targets to help control for variations in users or goals. Additionally, that campaigns with fewer assets seemed to perform better suggests that more targeted creative is a better option than generic or broad assets.
Based on this study, with the data and signals that PMax has access to, it seems that focusing it on targeting one customer type with plenty of data can be a successful strategy. This would allow you to keep your creative narrow and use only very specific signals.
As always, this is another excellent thought provoking study into Google Ads from Optmyzr!”
Harrison Jack Hepp, Owner, Industrious Marketing LLC
“Another insightful case study by Optmyzr. Some of the results are consistent with the finding of the previous one on bid strategies - Max. Conv. and Max. Conv. value again deliver what is expected from them.
An important finding for me is the benchmark of 61 conversions, which can explain why sometimes single PMax campaigns can be the better option. Still, some of the results suggest that multiple campaigns with a single asset group are a great option too. For E-Commerce, I have a clear preference for Performance-Based-Bucketing and in my experience multiple campaigns deliver better performance than a single consolidated campaign.
The case study undoubtedly demonstrates that human bias can hurt performance. I was aware that Search themes have negative effects on other campaigns, but now I am surprised that they might be having them on PMax too. The most surprising results regard the use of Audience signals (associated with negative performance effects) and the efficiency of PMax for Lead Gen accounts. I am ready to adjust my strategy and leave out Search themes and Audience signals behind (probably except for Customer match and Remarketing lists) and give more chances to PMax for LeadGen.”
Georgi Zayakov, Senior Consultant Digital Advertising, Huttler Consult
“The fact that Performance Max (PMax)-only campaigns show higher ROAS doesn’t surprise me, as PMax often behaves like a bottom-of-funnel conversion campaign. When other campaigns, such as non-brand search, are run alongside PMax, I expect metrics like ROAS and CPA to be worse, since these campaigns target different stages of the funnel and often require more consideration from consumers.
One particularly interesting finding is the limited use of PMax alongside YouTube video campaigns. Despite the control YouTube offers, PMax seems to underutilize video, reinforcing its role as a bottom-of-funnel tool, however I would have expected the ROAS difference to be higher.
I’ve also found that standard shopping campaigns often conflict with PMax, so seeing higher ROAS in these cases is surprising—though I’d handle this on a case-by-case basis.
The study’s insight into a single asset group driving higher ROAS is fascinating. I typically run different creatives for seasonal campaigns or separate product lines with similar margins in their own asset groups under one Pmax campaign. However, this data suggests that brands can simplify their approach, running a multi-product photoshoot with a branded YouTube video and still see success. This significantly lowers the creative burden for advertisers.”
Sarah Stemen, Owner, Sarah Stemen LLC
“My team found this report immensely helpful and illuminating. We have heard conflicting things from Google on Search themes, for instance. It was helpful to confirm our suspicions that they don’t have much impact on PMax performance so we can invest our energy elsewhere. We are still pondering the study in general as to how it will practically impact the way we segment campaigns, but there are certain things we gained immediately from it. We always create Standard Shopping campaigns in accounts, even if they are PMax heavy, so it was encouraging to see this supported in the study and we have more confidence in the energy we invest in that effort now that we have read the study. I also was particularly intrigued by another study (similar to the one Mike Ryan and SMEC did awhile back) looking at conversion volume. Without a doubt now after these two studies, a significant amount of conversions are needed to increase confidence levels in PMax success. Overall, I found this study thought-provoking and practical, thanks Optmyzr team!”
Kirk Williams, Owner, Zato PPC Marketing
Final Takeaways
PMax’s evolution invites us to evaluate our previous strategies. Where exclusions and specific human control used to be key to success, we seem to be entering an era where we won’t have enough data to make those choices ourselves.
However, key business info (conversion value/efficacy, removing existing customers/users who won’t be a good fit, and creative) still require human involvement.
If you’re looking for ways to achieve better automation layering, Optmyzr can help! Between our tools to help with PMax search term analysis, budget allocation, and removing bad placements, there’s a whole world of innovations and optimizations to explore.
One of the most critical parts of advertising is choosing the right bidding strategy for your campaign. However, with so many conflicting viewpoints (usually data backed and/or voiced by experts), it can be hard to understand what the right strategy for your client(s) should be.
To that end, we wanted to examine two key questions:
Which bidding strategy performs best over the most accounts?
When advertisers use more than one bidding strategy, what percentage of ad spend goes to which strategy?
Methodology: Data Framework and Key Questions
First, let’s look at how this study is organized. We divided the data and questions into the following sub-questions:
Which is the best overall bidding strategy: Smart, Auto, or Manual bidding?
Do bidding strategy targets help improve campaign efficiency?
Do bid caps help improve campaign efficiency?
What are the real conversion thresholds for optimal performance?
Does spend influence the success of a bidding strategy?
What percentage of advertisers use more than one bidding strategy?
Does The Data Translate To Lead Gen & Ecommerce?
Criteria and Definitions
To answer these questions, we did a deep dive into the international Optmyzr customer base. This study looks at all Google bidding strategies (with some inferences applicable to Microsoft Ads) across 14,584 accounts. We applied the following criteria:
Accounts must be at least 90 days old.
Accounts had to have conversion tracking configured.
Accounts must spend at least $1,500 and could not spend more than $5 million per month.
Before we dive into the data, it’s important we clarify a few key terms:
Smart bidding — Bidding managed by an ad platform based on conversion data
Auto bidding — Bidding managed by an ad platform based on clicks or impressions
Manual bidding — Bid and bid adjustments managed by a human
1. Which Is the Best Overall Bidding Strategy: Smart, Auto, or Manual Bidding?
Before we go over observations and takeaways, it’s really important to understand that the data may point to a ‘winning’ strategy that may not work for you and your business. Always factor in your own business conditions before making bidding decisions.
We’ll first share with you the raw data, then we’ll share the ranking based on weighting the following metrics in descending order:
ROAS: 40%
CPA: 25%
CPC: 15%
Conversion Rate: 10%
CTR: 10%
Observations:
Max Conversion Values continues to beat Max Conversions with a significantly better ROAS, CPA, CPC. While conversion rate and CTR are slightly better for Max Conversions, Max Conversion Value wins where it matters (ROAS).
Max Clicks delivers acceptable performance and is an underutilized bidding strategy.
Manual CPC is not the outright winner in any category, but delivers strong performance. The caveat to this is it’s not as efficient for CPA, CTR, or conversion rate.
Target Impression Share’s metrics indicate top-of-page placement helps CTR and conversion rate, but won’t actually help with profit metrics (CPA, ROAS).
Takeaways:
There is no clear winner between Smart, Auto, and Manual bidding. All three types have strong and weak metrics.
Max Conversion Value is the most efficient Smart bidding strategy.
Maximize Clicks is the most efficient Auto bidding strategy.
Manual bidding has the third highest ROAS, but really struggles in other categories. As such, you should only use it when you can actively manage the bids (more on this in the tactics section).
There is room for testing as the stronger bidding strategies have less adoption than their weaker counterparts.
2. Do Bidding Strategy Targets Help Improve Campaign Efficiency?
With regard to targets, there are essentially two schools of thought: they’re either useful to help guide the algorithm or they represent risk due to human error.
Here’s what the data says:
Observations:
The majority of advertisers using Max Conversions do not set a target and see better performance on the most important KPIs like ROAS and CPA than those who do.
It’s a similar story for Max Conversion Value; advertisers who do not define a target see improved results for all metrics except ROAS which has a slight dip but is essentially flat. However, the majority of advertisers do set a goal.
There doesn’t appear to be a bidding strategy that significantly benefits from adding a goal, which is unfortunate because adding goals is tied to bid caps and floors. It’s unclear if this is due to human error or the nature of goals themselves.
This is where we get to see the real impact of eCPC (retiring March 2025). While conversion rates and CPA are great, the ROAS doesn’t meet expectations. However it is worth noting that eCPC beat Max Conversions
Takeaways:
Setting targets for bidding strategies has a higher likelihood of hurting accounts than helping them.
The only bidding strategies where targets appear to help are Manual bidding and Target ROAS. It seems reasonable to assume that if an advertiser is willing to take on the work of bid adjustments and accurate revenue/profit sharing, they will set accurate bidding goals.
3. Do Bid Caps Help Improve Campaign Efficiency?
One of the biggest reasons to opt into bidding goals is to access bid caps (and floors). A bid cap is the most you’re willing to let Google bid, while the floor forces Google to use a minimum bid for all auctions. You can access these settings through portfolio bidding strategies for Smart bidding and Max Clicks/Target Impression Share.
Observations:
Whether or not bid caps are used has no consistent impact on performance, which explains why most advertisers don’t use them. This also explains why some advertisers avoid bidding goals (given that bid cap access is one of the big benefits of goals).
ROAS-oriented bidding strategies seem to benefit the most from bid caps. CPA-oriented bidding strategies are mixed (decent ROAS, but weak CPA and CPC). CTR and conversion rates are strong but not strong enough to make up for almost double the CPA.
While Max Clicks appears to have mixed results with bid caps, Target Impression Share clearly needs them (note: there wasn’t a statistically significant sample size for non-bid cap Target Impression Share).
Takeaways:
Most advertisers don’t use bid caps. Whether this is a good or bad thing depends on the bidding strategy.
Bid caps are not inherently good or bad, however they do introduce the potential for human error.
Bid caps (and floors) only make sense to use if you also apply intelligent bid caps and floors.
4. What Are the Real Conversion Thresholds for Optimal Performance?
We’ve long since passed the ‘15 conversions in 30 days’ era of Smart bidding. Ad platforms recommend that we meet minimum thresholds to see success. However, we weren’t sure what the threshold actually is for different types of bidding strategies…enter the data!
Observations:
Most advertisers clear 50+ conversions in a 30-day period and see better performance compared to accounts with fewer conversions.
The jump from under 25 conversions to 25–50 conversions doesn’t always result in a performance improvement. This may explain why some advertisers don’t trust Smart bidding at lower conversion volumes.
Manual bidding also benefits from high conversion volume.
Max Conversion Value has a slight edge over Max Conversions at all conversion volumes, indicating that Google has an easier time working with conversion values than stand alone conversions.
Takeaways:
The threshold for any bidding strategy to be predictably successful is 50+ conversions.
Some success can happen at lower thresholds, but there’s more volatility.
Manual bidding also benefits from higher conversion volumes, so if your only reason for choosing manual bidding is your lack of conversion data, we recommend finding ways to increase conversion volume.
5. Does Spend Influence the Success of a Bidding Strategy?
One of the most common assumptions around Smart bidding is that it requires big budgets to be successful. We were curious if this held up across all bidding strategies.
We ranked the bidding strategies by their probability to achieve profitability at lower spend levels (using the same criteria as before) from highest to lowest:
Observations:
The only bidding strategy where performance consistently improves as spend increases is Manual bidding.
The sweet spot for Smart bidding appears to be $10K–$50K (focusing on ROAS and CPA). Conversion rate and CTR seem to favor higher spend, but those aren’t profit metrics, which might explain why some brands tank their campaigns with large budget shifts if/when they move to Auto or Smart bidding).
Most advertisers using Max Clicks are low budget accounts, which makes sense given the conventional wisdom that ad accounts need big budgets for conversion-based strategies.
Takeaways:
As long as you have the conversions, low spend shouldn’t get in the way of Smart bidding.
The only bidding strategy that seems to handle big changes to budgets consistently is manual. Every other bidding strategy does best with specific spend brackets.
6. What Percentage of Advertisers Use More than One Bidding Strategy?
An interesting finding that came out of the data is exactly how many advertisers use multiple bidding strategies in the same account.
Category
COUNT of accounts
% of accounts
Multiple bidding strategies
7,061
48.42%
Single bidding strategies
7,523
51.58%
Observations:
Most advertisers use the same bidding strategy throughout their account.
Those using multiple bidding strategies seem to have a ‘starter’ bidding strategy as campaigns ramp up, and then transition to others.
Those sticking with one bidding strategy seem to have ‘loyalty’ to one. They stick with the same bidding strategy regardless of performance fluctuations.
Takeaways:
Testing bidding strategies is healthy but it’s not mandatory for success. Clinging to one bidding strategy may be comfortable, but it’s not as risk averse as it seems.
7. Does The Data Translate To Lead Gen & Ecommerce?
There is no denying lead gen and ecommerce strategies are different. As such we wanted to share the data of how bidding strategies fared with each account type.
Observations:
Max Conversion Value continues to dominate in lead gen. While CTR and Conversion Rate are lower than ecommerce, all metrics beat out Max Conversions.
Ecommerce advertisers seem to struggle with Manual CPC and Max Conversion bidding. I find it odd how many ecommerce advertisers are using Max Conversions instead of Max Conversion Value.
While more ecommerce use Max Clicks, lead gen advertisers seem to do better with it. Manual CPC seems to be the safer “early stage” campaign bet (despite it being a weaker bidding strategy overall for ecommerce).
The most popular bidding strategy for the studied ecommerce cohort is Max Conversions. The most popular bidding strategy for the studied lead gen cohort is Maximize Conversion Value. This was a shocker, because
Some of the cheapest Lead Gen CPCs and strongest ROAS was with Max clicks and manual CPC.
Takeaways:
Lead Gen Max Conversion Value outperforms Max Conversions by almost 300% on ROAS. This supports advertisers using Max Conversion values regardless of whether they are lead gen or ecommerce.
Tactics from the Data
There are a lot of tactics that come out of the bidding strategy data, but the biggest one is not to fall into the trap of thinking that Smart or Auto or Manual are inherently better or worse than the other. It all comes down to execution and where your account is on the conversion volume/efficacy front. Many accounts use mixed bidding strategies, which speaks to the value of leveraging all the bidding strategies at each stage in the account.
As a general rule, Manual and Auto bidding are favorable in early stage accounts. This is because these bidding strategies aren’t reliant on conversions and represent learning opportunities around auction price. As an account ramps up, it’s reasonable to start testing Smart bidding (provided that you have at least 50 conversions in a 30 day period).
However, just because an account is low-budget doesn’t mean that it can’t see success with a Smart or Auto bidding strategy:
High-spend accounts ($100K+) didn’t always fare better than lower-spending accounts (i.e., less than $10K).
Maximize Conversions had a median conversion rate of 10.68% on low-spending accounts, while high-spending accounts had a conversion rate 7.01%.
While it’s true that the ROAS was slightly better (at 184% versus 175%) with higher spend, it doesn’t change the fact that the CPAs, CPCs, and click-through rates were better at less than $10K spend.
However, conversion thresholds still matter. There is no account that performed better at less than 25 conversions than those that had more than 50. In fact, even Manual bidding did demonstrably better on cost per acquisition, ROAS, click-through rate, CPC, and conversion rate when there were more conversions.
The big takeaway here is that just because your spend is low doesn’t mean you have to shy away from Smart bidding, but it does mean that you need to be honest about your conversion actions. In terms of which conversion actions you include, you can consider using micro conversions if you want to avail yourself of Smart bidding, but it’s really important that you actually put in the different conversion values for each action so that Google can get the data it needs to efficiently allocate your budget.
The other major optimization opportunity within the account is thinking about how you allocate your budget. Of all the bidding strategies, only Manual bidding had a linear correlation between budget size and bid performance. However, when you look at all the other bidding strategies, big spikes or decreases in budget did cause performance issues.
As a general rule, when you’re increasing or decreasing a budget in a Smart bidding campaign, you’ll want to make sure that you allocate somewhere between two to three weeks for that budget to settle.
In regards to bid caps and floors, as well as setting targets, I was surprised that targets seemed to hurt performance more than help it. And while I have my suspicions that human error (seting caps/goals that don’t align with the budget and targets) is part of the issue, there is no denying that applying a target represents risk.
If you’re going to use targets, which unlock the path to bid caps and floors (that can lead to performance improvements in certain cases), ensure that you apply the right targets (and bid caps and floors).
The first thing to consider is what a reasonable target for your campaign might be. So if you historically hit a $50 cost per acquisition or a 200X ROAS with no goal, it is reasonable to set a cost per acquisition goal of $45 to $55 not see any major change (i.e., you are keeping the goal +/-10% of the original performance). The moment you go beyond that 10%, you invite risk. And so the only reason to do this is if you know that the historical performance doesn’t reflect the actual results you are seeing.
For example, if you know that your conversion tracking isn’t set correctly, or if you don’t trust your data, you can play a little bit faster and looser with the settings, because the information that’s currently fed to Google isn’t accurate. And as a reminder, you may decide that you want to exclude certain data that you know you don’t trust.
When it comes to bid caps and floors, I have always endorsed keeping bids to 10% (or less) of your daily budget, so you can fit at least 10 clicks per day.
If you choose to go beyond that 10%, there’s a very real chance that you will not get enough clicks per day, and Google will either under serve your budget, or your bid floors will be too low, you’ll over serve in the wrong auctions, and you will have misguided your budget.
When setting up your bid floors and caps, be mindful that you’re doing so as corrections, not as a control lever. If you see that your impression share is historically lost due to rank, you may decide that you want to set a higher bid floor (while not including a cap) to force Google to invest your budget in the way that will serve you.
If you’re struggling on quality, you may decide that you want your bid cap to be 10% or even 15% of your daily budget, but acknowledge that you’ll get fewer clicks per day. So, you just have to account for that in your conversion rates. It’s really critical that you’re honest about the quality of your leads and what those bid caps and floors can do for them, as well as making sure that your targets are reasonable based on your historical performance.
Experts React
“This study challenges many misconceptions about Google Ads, which is thrilling! Seeing that campaigns using Target CPA achieve the lowest CPA of all bid strategies, and that campaigns using Target ROAS achieve the highest ROAS of all bid strategies, confirms the effectiveness of target-based Smart Bidding.
The most important takeaway from this study for me, however, is that budget is not the most important factor in Smart Bidding success; conversion volume and values are. Increasing your budget does not mean you’ll achieve better efficiency, but increasing your conversion volume is correlated to better results for every single bid strategy studied.
Going forward, I will continue recommending that my clients implement micro-conversions if they don’t have sufficient conversion volume, and continue recommending using conversion values even for non-ecommerce businesses.“
Jyll Saskin Gales, Founder and Coach, Jyll.ca
“My question as I read through all the data was - what percentage of the accounts reviewed were e-commerce? I’d love to see how the data shakes out across these categories for e-commerce and lead generation.
But even without that split being shown, seeing that accounts really do need 50+ conversions is validating! As someone who often works on accounts with low (fewer than 50 per month) conversions, I have long believed that those conversion levels were a hinderance and seeing it confirmed in a large data set is helpful.
It is also nice to see that manual bidding does have a place in these automated times! The data about using conversion values and not just bidding toward conversion generally was also very interesting. I think we can sum up where things are continuing to go by saying Google wants more information from advertisers (conversion values being one data point) so that it can add that to their system data to try to increase campaign performance.
Also nice to see that adjusting your budgets with some of the auto or smart strategies can cause volatility. Again, many of us see things in the accounts we work on and hear about it from friends and their accounts, but seeing a large data set reporting that it is widespread is also very helpful in setting expectations - both ours and for our clients.”
Julie Friedman Bacchini, Founder of PPC Chat/President and Founder of Neptune Moon
“One of my first takeaways is that max clicks performs at a similar if not better level than max conversion. As was noted, maximize clicks is really an underutilized bidding strategy as users try to jump straight into smart bidding using maximize conversions. I’ve found that using maximize clicks with appropriate bid adjustments can actually be a winning strategy for some accounts.
I wasn’t surprised to see that the key component in bidding strategies continues to be conversions and conversion volume, however. This remains one of the biggest challenges for smaller advertisers and even manual CPC or auto bidding doesn’t entirely overcome the challenge. The importance of micro conversions only continues to grow for marketers who work with lower conversion volumes.
I’ll also admit that this study challenges my view on maximize conversion value as a bidding strategy. I’ve always thought that maximize conversions was a better bidding strategy and have often only used conversion value bidding if I can set a target ROAS with it. This serves as a good reminder to test your assumptions or at least avoid writing strategies off without due consideration!”
Harrison Jack Hepp, Founder of Industrious Marketing LLC
“Some big surprises here at first glance, but things are never simple. As the saying goes in the SEO community: “It depends,” and that holds true here as well. Take, for example, setting up targets and bid caps. The data shows that these strategies aren’t always beneficial. Does this mean we’ll change our advice to clients? Likely not. It may seem surprising until we consider who sets those numbers and based on what data. We’d still argue that in many cases, setting a CPA target while also establishing bid caps and floors is a balanced strategy—assuming the data is reliable.
In essence, the study confirms what we universally know: better data equals better performance. Unfortunately, not everyone understands what “better data” really means or how to achieve it. That’s where the complexity comes in, especially with increased focus on privacy. We’ve already been developing strategies to improve the data quality and the study confirms the need. Strategies such as server-side tracking which in testing is showing 18% uplift in main conversion event relative to client-side. This is all data that helps us and the system make informed decisions that manage risks. But again, it only works if the setup and measurement framework are solid from the start. That’s the difference between stunting your account’s performance and letting Google do as Google wants.”
Emina Demiri-Watson, Head of Digital Marketing, Vixen Digital
“This study provides really valuable insights into Google Ads bidding strategies. One surprising finding was the high usage of ‘Maximize Conversions’, despite its relatively low ROAS and high CPA. I understand that the accounts are using multiple bid strategies and the bigger picture is important but I found this interesting non-the less. As a proponent of Maximize Clicks, I’m pleased to see its performance validated. This bid strategy is particularly suitable for smaller businesses or those seeking a less hands-on approach. I recommend max clicks for alot of my b to b clients when there isn’t much competition and when the terms that are searched are straightforward. This data point is helpful to that cause.
The study also highlights the importance of conversion volume for manual bidding. This aligns with the traditional “rule of 100s,” where bids were adjusted based on performance metrics (100 clicks or more with no conversions lower the bid, or if a keyword spends $100 or more with no conversions lower the bid). While this is an old school way of doing manual bidding, we still relied on data to make the decision before smart bidding. Seeing this data shows that 15 years ago we weren’t as far from the mechanics as we thought.”
Sarah Stemen, Founder of Sarah Stemen LLC
“I always enjoy it when I get my hands on Google Ads studies that look at big data sets.This one about bid strategies provided great insights. Among the things I found confirmed from my own analysis are the importance of conversion volume as the basis of any bid strategy and that maximize clicks still has its place. It can perform the same or even better in certain scenarios.
What surprised me, as a proponent of bid floors and bid caps, was the section about bid caps not having a consistent impact on performance. Guess that goes to show that, as the saying goes, it depends.
I was pleasantly surprised by manual CPC and the way it performs, but only when you actively manage the bids - but this always used to be the case and us “old schoolers” are used to it being that way.”
Boris Beceric, Founder and Coach, BorisBeceric.com
“I’m pleased to see that, as of today, there is still no universally superior bidding strategy; performance varies based on execution, conversion volume, and account specifics. When you have 50+ conversions, Smart Bidding is often the best approach, and this aligns with my observations.
A key takeaway for me is the quality of data we provide to Google. Different bidding strategies require different data inputs. It’s crucial to include micro-conversions when they are relevant, and the bid strategy must align with this data. When aiming to drive high-value deals, both the data quality and campaign setup are critical.”
Andrea Cruz, Sr Director, Client Partner Tinuiti
Final Takeaways
Bidding strategies should be evaluated based on the goals for the campaign and resources available. There is no concrete answer on which bidding type (Smart, Manual, or Auto) is better, however there are signals advertisers can follow for the best one for their campaign.
Just because you’re using Smart or Auto bidding doesn’t mean you lack control. If you’re interested in layering automation into your workflow and getting the most out of your budget, Optmyzr has several tools to help you on the path to profit and victory.
If you’re not an Optmyzr customer already, you can sign up for a full functionality trial here.
Great ad copy is critical for Google Ads success. However, it can be tough to understand which rules of engagement work best in today’s PPC landscape.
While there are many perspectives on the best way to optimize ads (and each method has its own place), few are backed by statistically significant data.
At Optmyzr, we have access to that data, so we asked our analysts to look for trends in ad optimization strategies that drive meaningful performance improvements.
We believe it’s important to share this data—not to amplify or discourage any specific strategy, but to inform you about what each creative choice can mean for your account. Ultimately there is no right or wrong answer, just higher or lower probability for success.
Let’s take a look at the data so that you can better contextualize which ad optimizations might yield the best ROI for your campaigns.
Methodology: Data Framework and Key Questions
Keep in mind the context below as you review our study and takeaways.
About the data:
We reviewed over 22K accounts that had been running at least 90 days with a monthly spend of at least $1500.
We reviewed over one million ads across responsive search ads (RSAs), expanded text ads (ETAs), and Demand Gen. However, API limitations prevented us from pulling asset-level data for Performance Max campaigns.
For monetary stats, we converted currencies to USD and used those to find the average CPAs and CPCs.
Here are the questions we aimed to answer:
Is there a correlation between Ad Strength and performance?
How does pinning impact performance?
Do ads written in title case or sentence case perform better?
How does the length of the creative (character count) affect performance?
Do ETA tactics translate to RSAs and Demand Gen ads?
When evaluating our results, it’s important to remember that Optmyzr customers (the data set) represent advanced marketers. As such, there may be a selection bias that could result in more data on successful strategies. It’s possible that results could vary when evaluating a wider advertiser pool with a more varied range of experience.
Ad Creative Choices Data & Analysis
In the sections below, we’ve included raw figures, observations, and takeaways to help you better understand the degree to which various ad optimizations influence performance.
Is there a correlation between Ad Strength and performance?
While Google has made it very clear that Ad Strength is not a ranking factor and meant to be a helpful guide, practitioners tend to have mixed to negative sentiment towards it because it gets conflicting attention from Google and doesn’t seem to be useful in managing creative.
“A higher Ad Strength doesn’t mean a better CTR or a better conversion rate or a better Quality Score. If you’re new to advertising or don’t know what’s going to work, consider this a piece of advice.
But if you’re an experienced advertiser, go ahead and do what you do best. Create the ad that resonates well with your target audience and keep the focus on performance. Don’t just be blinded by the Ad Strength.”
Does the data back him up? Below (and for all the tables in this study), we’ve listed the rows of data in order of descending performance (i.e., the first row is the highest-performing group, while the last row is the lowest-performing):
Responsive Search Ads (RSAs):
Demand Gen Ads:
Observations:
RSAs with an ‘average’ Ad Strength have the best CPA, conversion rate, and ROAS.
Other than ROAS, Demand Gen ads with an ‘average’ Ad Strength performed the best.
There is no meaningful difference in CTR for ads with different Ad Strength labels, which indicates that Ad Strength either doesn’t factor it in, or likely could never be a ranking factor. This is of note because Quality Score (which is a factor in the auction/Ad Rank) does have a clear relationship with CTR. We include this point because many were suspicious of Google using Ad Strength as a ranking factor.
For RSAs, ROAS appears to decline sharply when going from ‘average’ to ‘good’ Ad Strength. While the transition from ‘good’ to ‘excellent’ shows a slight increase, it doesn’t come close to the disparity between ‘poor’ or ‘average’. This may be influenced by the ‘human’ factor (the majority of advertisers favor max conversions and simple conversion values, according to our bidding strategy study [10,635 use Max Conversions vs 7916 Max Conversion Value]).
Demand Gen’s metrics make a stronger case for paying attention to Ad Strength due to clear ROAS win in the ‘good’ category, however the decline associated with ‘excellent’ Ad Strength still makes it a dubious optimization guide at best.
The conversion rates for Demand Gen ads are very similar to those of RSAs. This is surprising, considering Demand Gen ads drive awareness whereas RSAs are traditionally focus on driving transactions.
Takeaways:
There is no clear correlation between ad performance and Ad Strength. Ad Strength is not a metric to sweat over.
The majority of ads have an Ad Strength label of ‘poor’ or ‘average’, but perform well on typical advertising KPIs.
Ads with ad strength labels of ‘good’ or ‘excellent’ have mixed performance on typical advertising KPIs.
How does pinning impact performance?
Pinning refers to designating an asset to a particular position in the ad (Headline 1, Headline 2, or Headline 3). Pinning came about with the rise of Responsive Search Ads.
Some preach pinning everything to force ETAs (meaning there would only be three headlines and each would be pinned to their respective spot), while others prefer to abstain from pinning. Those who abstain from pinning lean into RSA’s built in testing. Check out the “Experts React” section for specific reasons why some pin or don’t.
Here’s the data on pinning (including the performance from ETAs for easy comparison—note that ETAs are a retired ad type and cannot be edited):
RSAs:
ETAs:
(We’ll revisit this table when we discuss creative length.)
Observations:
Some pinning continues to be the winning strategy based on CPA (though no pinning is a close second), ROAS, and CPC. Conversion rates suffer when you pin.
Ads where every element is pinned have the best performance for the relevance metric: CTR.
Ads with some or no elements pinned have the best performance for conversion or cost-based metrics, like CPA, ROAS, CPC, and conversion rate.
While CTR is technically a win for pinning, the CTRs are very close, so it’s hard to say pinning is truly responsible.
In most cases, RSAs outperform ETAs (even in ads with all pinned assets). However ETAs with 31+ characters (indicating DKI/ad customizer usage) performed so well that it comes across as outlier data.
Takeaways:
Advertisers who attempt to recapture the ETAs days are setting themselves up for worse conversion-based performance.
Pinning some assets has a positive impact on ad performance, but it’s essentially flat compared to pinning no assets (ROAS is the only exception). As such, pinning should be a creative/brand choice—not a concrete Google Ads tactic.
Most advertisers would benefit from fully migrating to RSAs (which allow for pinning).
Do ads written in title case or sentence case perform better?
The ‘title case vs. sentence case’ debate is probably one of the firecest debates, so we were curious how this stylistic choice impacted ad performance.
For your reference, here’s a text example with each respective formatting:
Title case:This Is a Title Case Sentence
Sentence case: This is a sentence case sentence
We’ve grouped the accounts based on the percentage of an account’s ad text elements that use title case. So for example, accounts in the row marked ‘0%’ use no title casing at all. 0% should be understood as pure sentence case structure, while 75-100% should be understood as pure title case.
RSAs:
ETAs:
Demand Gen:
Observations:
The biggest observation is the number of advertisers who mix title and sentence case in the same ads and accounts. This runs counter to the historical norm that advertisers tend to pick one and stick with it.
ROAS seems to favor sentence case, but most advertisers tend to use title case.
There is no hard-and-fast rule for all ad types. RSAs and Demand Gen ads appear to do better with sentence case, while ETAs seem to do better with title case.
Takeaways:
As RSA and Demand Gen ads using sentence case performed best on all primary advertising KPIs, we recommend all advertisers include ads with sentence case in their testing.
One possible reason why ads using sentence case perform well is that they are the same format typically found in organic results, which are usually perceived as higher quality by users.
Do not turn off ETAs that perform well, as they have the potential to outperform RSAs (though most won’t) and you won’t be able to re-enable them again later.
Title case seems to be a habit from ETAs, but in most cases, advertisers do better with sentence case.
How does the length of the creative (i.e., character count) affect performance?
Ad copy is a kind of haiku—you need to convey clear and enticing meaning in very few characters. Yet there’s more nuance to consider: is bigger better?
(Example SERP with three RSAs—each with some creative cut off or moved to a different spot.)
Google has made a habit of truncating creative for years, and it’s no surprise that headline creative gets more viewership and impacts performance to a larger degree than the description. However, since underperforming headlines can appear in descriptions (instead of being in position #2), there’s an even greater pressure to get the balance right.
Headlines appear to benefit from concision, while descriptions appear to benefit from some length (but not too long).
In most cases, DKI/ad customizers don’t dramatically improve or hurt performance. We should assume that all ads in a “+” category are using DKI or customizers as that’s the only way they’d be able to exceed the character count.
RSA and ETA performance trends do not line up perfectly, and those trying to apply ETA tactics to RSAs see declines in almost all metrics (potentially due to how Google combines lines of ad text to render long headlines).
CPC fluctuation implies that asset length isn’t as important as other factors, like the Quality Score and Ad Rank of the ads. If there was a clear correlation, one could infer Google’s character count preferences.
Takeaways:
The historical trend of longer ads being better isn’t playing out in today’s ad types. Quality over quantity seems to be the path to better CTR, conversion rates, and ROAS. Focus on including a strong and compelling message in your ad, rather than attempting to max out the character count.
Ad Optimizations That Boost Performance
Now that we’ve reviewed the data, let’s talk about the tactics you should adopt and the ones that no longer make sense.
For me, the biggest insight related to our findings about mixing sentence and title case: I didn’t expect the CTRs and conversion rates would be so similar. While sentence case ‘won’ for RSAs, performance was close. As such, only test sentence case in ads that are underperforming (as opposed to changing existing successful ads to sentence case).
Another big takeaway is that pinning should not be done for complete control. Instead, marketers should focus on securing creative in intended spots (i.e., not having a headline drop to the description). Leave some room for Google to decide where to place the creative.
Regarding Ad Strength as an indicator, seeing as how it does not correlate with performance, it doesn’t make sense to build Ad Strength into audits or sales tools. However, it is a useful filter to find ads whose creative may not be high enough quality to generate a meaningful number of impressions. We did see a strong correlation between shorter and brand-agnostic creative and higher ad strength.
Experts React
“A couple things stood out to me right away. The first is how little the CTR was impacted across the variety of ad types and strategies. Most of the changes studied saw no more than a 0.5-1% change across the CTR. Secondly, it appears that many marketers, myself included, haven’t completely adjusted to RSAs despite them being the primary ad type for over a year now. RSAs perform in a completely different way than ETAs regardless of how you format them. Rather than trying to replicate ETAs or using old best practices, advertisers need to lean into RSAs and determine how to make them work best for their accounts.
I think all of this highlights the case that many of us who have been practicing Google Ads for a long time need to revisit our habits. Google Ads continues to change at an accelerating pace and we need to lean into making it work for us now and not hold onto old tactics.”
Harrison Jack Hepp, Google Ads Consultant, Industrious Marketing
“As the “Chief Strategist” of a digital marketing agency, I’ve always prioritized strategies that maximize performance, often relying on data-driven decisions over Google’s recommendations. This study reinforces that approach, especially regarding Ad Strength and pinning. The data confirms that Ad Strength doesn’t reliably predict ad performance, so experienced advertisers should focus on crafting ads that resonate with their audience rather than chasing high Ad Strength ratings. While Google offers pinning as a tool, the findings suggest that allowing some flexibility for Google’s AI can yield better results than over-pinning and that using pinning selectively is not as harmful as I may have previously thought. However, the most surprising insight is the impact of creative length. Contrary to my belief in maximizing ad real estate (which I also push when it comes to Meta Data on the SEO side of things), the data suggests that concise, impactful messaging can outperform longer ads. This challenges the notion that more is always better and highlights the importance of quality over quantity in ad copy. Based on this study, I will push our teams to test creative length more rigorously.”
Danny Gavin, Chief Strategist and Founder, Optidge
“This study highlights the importance of humans using Google Ads. As experts, we analyze Google’s documentation, PR statements, and real-world advertiser performance to offer guidance.
While ‘Excellent’ ads have higher click-through rates (CTRs), this study confirms that ad strength can mislead advertisers into prioritizing clicks over conversions. ‘Average’ ads actually have higher return on ad spend (ROAS), suggesting that aligning ads closely with keywords (to get an ‘Excellent’) can lead to more clicks but not necessarily more sales.
I was also intrigued by the impact of pinning. Historically, I’ve avoided using pinning and relied on RSA automation. This data demonstrates that human intervention and knowledge can produce better results. In light of this, I’ll consider incorporating pinning into my strategies.
Lastly, as a proponent of title case, the study’s findings on title case versus sentence case were surprising. While many ad experts stick to one format, the study suggests that staying updated with case studies is crucial. In today’s environment, where individual accounts may lack sufficient volume for testing, tools like Optmyzr are more essential for providing data-driven insights and challenging the status quo.” -
Sarah Stemen, Owner and Coach, Sarah Stemen, LLC
“This is a good reminder of how dynamic best practices really are. Just a few years ago, filling up all the character space in an ad was a great way to give your ad more real estate. With RSAs, using every available character can actually backfire, since it can keep H3 from serving.
Writing Google Ads can be really overwhelming. Knowing what correlates with better performance and what doesn’t (ahem…Ad Strength) offers valuable benchmarks. These insights allow you to move past internal tests for things like capitalization and pinning, and instead focus on the qualitative aspect—developing stronger, more substantive messaging that attracts buyers.”
Amy Hebdon, Founder, Paid Search Magic
“This study is FASCINATING!
The things that stood out to me were pinning, sentence case and length of assets.
First, pinning - I am happy to see that pinning is not completely penalized. There are very legitimate reasons an advertiser might want or need to pin assets. Could be compliance or could be that their brand standard demand certain things must appear in advertising. I am glad that is not an automatic performance killer. It makes sense that selective pinning does well and full pinning does less well.
The title versus sentence case data was also really interesting! For those of us who have been doing this for a long time, title case is really ingrained in our heads for headlines. It almost feels blasphemous to use sentence case for headline assets. But the data, I think, is starting to show us that Google is viewing ad components/assets differently.
Which leads me to my thoughts on the length of assets. Again, those practitioners who have been doing Google Ads for 10+ years, our mantra has always been use all the characters! We strove to have long descriptions and use all those title characters pretty much every time. But the data is showing us that the system prefers shorter (not maxed out) assets. And I can’t help but wonder if this is hinting on Google Ads not distinguishing so much between title and description assets in the future. They have already started by sometime using titles in description areas. I think this is where it is eventually going.
All that to say, we probably need to adjust our thinking about today’s ad assets and test different lengths and case structures if you don’t have variety in your current ads. Look forward to more studies illuminating other aspects of Google Ads!”
Julie Friedman Bacchini, Founder of PPC Chat/President and Founder of Neptune Moon
“What I found most compelling from Optmyzr’s latest study is that ads resembling organic content outperform those that employ typical best practices for Responsive Search Ads. For example, Google’s own research from a few years ago found that Title Case outperforms Sentence case for RSA headlines and descriptions, but Optmyzr’s new study shows that the more “natural” Sentence case text is associated with better ROAS, CPA and CTR in 2024.
Similarly, practitioners have typically tried to maximize real estate by using all available characters, but this study shows that shorter headlines and descriptions generally have better CPA and CTR than longer ones.
I look forward to testing these new findings with my clients. As organic-feeling social media ads have taken over platforms like TikTok and Meta, it’s interesting to see a potentially similar shift coming to Google Ads.”
I’ve long said that focusing on ad strength too much is detrimental for performance and I’m glad to have this confirmed.
What’s really important is understanding the restrictions you have in your account (available impressions per ad group) and tailoring your RSA to that, plus the ability to communicate the message effectively and speak to the user in a way that resonates with them.
Best practices are but that - the average of things that typically work."
Boris Beceric, Founder and Coach, BorisBeceric.com
“Referring back to Fred’s advice, the single most important tip is to write ad copy that addresses your user’s or buyer’s concerns—it’s basic marketing 101. That said, the more you can customize each input, the better the performance will be. With increased AI search integration, expect Google to improve its ability to create a personalized search experience based on a multitude of signals.
Additionally, don’t forget the basics: dynamic countdown clocks for promotions, ad customizers that mention names of stores or service locations, dynamic keyword insertion (DKI), and using ad-level UTM parameters to trigger landing page content aligned with the keyword or ad theme will all contribute to better CTR and CVR.”
Andrea Cruz, Sr Director, Client Partner at Tiniuti
Final Takeaways
Ad Strength is not a major metric, nor has it proven to be a reliable predictor of ad copy performance. The most useful signals seem to be the formatting of the ad (title vs. sentence case), as well as length of the copy. Don’t fall into old creative habits—honor the new rules of engagement and, if you need help managing profitable ad tests, Optmyzr has a free trial with your name on it.
During GML 2024, Google shared a really interesting stat: raising your OptiScore 10 points leads to a 15% conversion rate improvement.
This stat raised eyebrows for a few reasons:
Advertisers can raise OptiScore by dismissing Google’s recommendations, which can be considered a loophole in the system.
Maintaining a minimum OptiScore is required for partner status, which doesn’t always align with business and marketing goals.
OptiScore tends to be conflated with account recommendations, which seem like a sales tool.
For your reference, here’s Google’s OptiScore support documentation:
Optimization score is an estimate of how well your Google Ads account is set to perform. Scores run from 0-100%, with 100% meaning that your account can perform at its full potential.
Along with the score, you’ll see a list of recommendations that can help you optimize each campaign. Each recommendation shows how much your optimization score will be impacted (in percentages) when you apply that recommendation.
Note: Optimization score is available at the Campaign, Account, and Manager Account levels. Optimization score is shown for active Search, Display, Video Action, App, Performance Max, Demand Gen, and Shopping campaigns only.”
— Google support documentation
With that in mind, we decided to explore the following questions:
Is there a performance difference in accounts with 70+ OptiScores (compared to sub-70)?
Are most advertisers achieving high OptiScores by accepting Google’s recommendations (and do they see better results than advertisers who reject them)?
Does spend play a role in OptiScore?
For this study, we looked at 17,380 Google Ads accounts that met the following criteria:
Running at least 90 days
Spending at least $500 per month
Maximum spend $1M per month
Global accounts that could be in ecommerce or lead gen.
The Data
We’ll review each major question in detail, but here’s a quick summary of the findings:
32% of accounts have sub-70 OptiScores.
19% of accounts achieved an Optiscore of 90+ without accepting Google recommendations.
5.5% (less than 1000 accounts) accepted Google recommendations, however the best performance belongs to the 333 accounts that accepted Google suggestions and have a 90-100 OptiScore.
Spend doesn’t really impact OptiScore—there’s too much fluctuation in the spends to point to any correlation or causation.
There is a correlation between higher OptiScores (80+) and improved CPA, conversion rate (though sub-70 did ‘win’ this category), and ROAS. There is no correlation between CPC and CTR.
Q1: Is there any performance difference between accounts with high/low OptiScores?
A big reason we wanted to explore the difference in OptiScore brackets is to see if it can be used as a health indicator in accounts. Here is the raw data:
As you can see, there is a clear correlation between high OptiScores and strong performance on all metrics (save for CTR). However, there are a few caveats:
Sub-70 OptiScore accounts won on conversion rate and nearly won on CTR.
ROAS is pretty flat between OptiScores of 70–90.
CPCs fluctuate (although lower OptiScores do correlate with higher CPCs).
Accounts in the 90-100 OptiScore range:
Beat accounts with a sub-70 score on ROAS by 186%.
Had the cheapest overall CPAs (despite not having the cheapest CPCs or best conversion rates).
Had the lowest CTR, which speaks to the value of PMax and visual content being part of the marketing mix.
Regarding Google’s claim on conversion rates being tied to OptiScore improvements:
This holds true for those going from 70 to a higher tier.
This does not hold true for advertisers going from sub-70 to 70+.
CPA and ROAS still win the day as you increase your OptiScore.
Q2: Are most advertisers achieving high OptiScores by accepting Google’s recommendations?
There’s strong skepticism around Google’s OptiScore metric. While our data shows there is a strong performance gain when an account achieves a better OptiScore, there remains the question of how the score is achieved. So ahead of this study, we ran an anecdotal poll and found that the majority of advertisers reject recommendations to raise their score (or outright ignore the metric).
Here’s the raw data:
While the vast majority of accounts (95%) do not accept Google suggestions, it’s worth acknowledging that the accounts with the best performance did accept Google recommendations and have an OptiScore of 90+. The data suggests that advertisers may have raised their scores by rejecting suggestions, however that didn’t always lead to the best results.
A few notes:
The suggestions varied across accounts, however the most common accepted suggestions revolved around hygiene fixes (e.g., conflicting negatives, missing assets, other clean up alerts).
Accounts that rejected suggestions may have still done the suggested action, but at a different time.
The main takeaway here is that you shouldn’t dismiss Google suggestions out of hand. An additional takeaway is that advertisers who are active in their accounts tend to see higher OptiScores, which does seem to correlate with improved performance.
Q3: Does ad spend play a role In OptiScore?
There has been a bit of skepticism around Google and how much spend plays a role in ‘favorable treatment’. While this wasn’t directly asked by the community, we thought it would be interesting to see whether spend impacts OptiScore. Here’s the raw data:
Spend is flat between the OptiScore brackets, and there’s no obvious correlation between spend levels and OptiScore.
While one could argue that jumping from sub-70 to 70–80 does add cost, the cost fades away in the upper brackets. This bracket had the best CTR, so it’s possible the increased spend is tied to advertisers doing a great job writing compelling ads that couldn’t capture conversions (either due to user experience or privacy).
Strategies for Leveraging OptiScore
Now that we’ve explored the data…what do we do with it? Should OptiScore be the new quality score?
No, but we also shouldn’t dismiss it. While Optiscore will not impact how you enter the auction, the data is undeniable that it can serve as a useful health indicator of where to work in accounts. While sub-70 accounts can see success, the strongest performance is in the 90+ bracket.
Don’t make it a goal to raise your OptiScore, which can be done through rejecting suggestions. Instead, focus on improving your account (with guidance from OptiScore). As Ginny Marvin, Google’s ads liaison shared:
The recommendations that surface with OptiScore refresh in real time and are based on your performance history and both inferred and expressed campaign goals (e.g., your bid strategy) as well as broader trends and market data. I tend to see two misperceptions about OptiDcore that keep advertisers from utilizing it effectively.
The first misperception is that OptiScore has a direct impact on performance. As with other diagnostic tools in Google Ads, such as Ad Strength and Quality score, OptiScore has no influence on the auction. On the other end of the spectrum is the second misperception that it’s simply a vanity metric that doesn’t reflect meaningful insights. OptiScore reflects how well your account and active campaigns are set up to perform.
While not all recommendations may be relevant (you know your business best), we continue to see that, on average, higher OptiScores correlate to better advertiser outcomes. Understanding what your OptiScore reflects, and reviewing the recommendations with an eye toward your goals, can help you surface new opportunities and prioritize where to focus your optimization efforts.
If you’re an Optmyzr customer, you can find OptiScore highlighted in Audits. Now that we know there is a positive correlation between OptiScore and account performance, we will begin looking at expanding its utility in Optmyzr’s suite of tools.
If you’re not an Optmyzr customer, the best way to leverage OptiScore is to use it as a focusing tool, as well as a weighting system to prioritize which optimizations/tests to perform.
Thoughts From PPC Experts
We asked PPC experts to weigh in on the data with their honest takes. The responses were mixed.
Pleasantly Surprised
I was pleasantly surprised to see a correlation between higher OptiScore and better campaign results (lower CPA/higher ROAS). I was more surprised to see even better results for those that accept rather than dismiss Google’s recommendations.
None of us, not even Google, would conclude that higher OptiScore is the cause of better results - though we all owe Googlers an apology for how much we’ve mocked their OptiScore stats over the years! I think the true cause for both higher scores and better results is a) actively managing and ’looking after’ an account, and b) being open to considering new ideas and opportunities.
Most experts are quite critical of Google’s recommendations, especially when it comes to OptiScore (myself included). However, I am also willing to eat my words when proven wrong. I was quite surprised by the clear correlation between OptiScore & ROAS, CPA & CVR (and yes, I did my own analysis).
I’ve always maintained that not all recommendations are useless and that you should judge them by their usefulness for your accounts. I guess now it’s time to go back to my accounts and see what else can be implemented.
The results were very interesting to me, as a member of camp ‘reject most suggestions.’ I imagine that the level of expertise of the account manager plays a role, sometimes what Google suggests is an action I was already going to take. I’d recommend that nobody blindly dismisses or accepts recommendations and instead considers them carefully, as you are the only one with context. I also believe ecommerce clients should pay particular attention to the ROAS results of this study!
Google isn’t inside the accounts but I know I’ll be more carefully considering their suggestions going forward and I believe the season of ‘blindly dismiss’ (if that’s been your MO) being the default has come to an end.
— Amalia Fowler, Owner, Good AF Consulting
I worked at Google on the Google Optimization project and have seen firsthand how some recommendations from the system can be highly relevant. For instance, addressing conflicting keywords, fixing conversion tracking issues, and implementing enhanced conversions are all critical for improving campaign performance. Additionally, adjusting ROAS targets or increasing target CPA during peak auction times can also bring better results.
This data reassures me that recommendations correlate positively with performance. However, I still believe that certain areas, such as adding new keywords or changing match types to broad match, require further improvement. Overall, the study’s outcomes are pleasantly surprising and validate the use of some of Google’s optimization suggestions.
— Thomas Eccel, Senior Performance Marketing Manager, Jung von Matt Impact
Skeptical or Indifferent
The Optmyzr study highlights benefits to Google’s OptiScore and suggestions, (which is seen especially in the 90–100 range), with a better CPA and ROAS compared to the lower OptiScore brackets.
This study supports what I tend to believe and it is great to have the data to prove that some recommendations directly found in the Google Ads interface are beneficial to account performance.
All that said, the Google interface and Google reps independent of the study push the score. Google pushing the score gives me pause, even when independent study data supports that OptiScore’s net positive on performance.
— Sarah Stemen, Business Owner, Sarah Stemen, LLC
While I don’t pay much attention to OptiScore or give much value to recommendations, we do review recommendations on an ongoing basis because they can surface some things we may not have seen as easily.
— Menachem Ani, Founder, JXT Group
I usually reject most of the recommendations and ignore OptiScore, unless we are about to lose our Google Partner Badge. After checking all of our accounts, I would like to add that nowadays the recommendations have increased in number and in variety than several years ago. Search is much more visual, and for instance, accepting the recommendation to add more images or enable dynamic images is rather beneficial with less risk for harm. Improving ads and assets, in general, makes sense too.
Our smallest accounts suffer most in terms of OptiScore because the system does not like limited budgets—for some of them, a budget increase might improve the score by 13%. For lead gen and gambling accounts (which underlie strict regulations), PMax would bring a score improvement of over 10%, which again does not make sense business-wise. Switching accounts optimizing on CAC to Target-ROAS for the sake of several OptiScore points already goes in the direction of business suicide.
— Georgi Zayakov, Senior Consultant Digital Advertising, Hutter Consult AG
Summary & Final Takeaways
OptiScore is not and should never be a KPI. It is a useful tool to focus work, though it should not be the only tool you use. Make sure you balance all recommendations from Google with the actions and optimizations that best serve your campaigns and business.
If you would like to have a third party to sanity check recommendations and strategies, check out Optmzyr’s PPC Management suite for Google and beyond.
At the height of the Roman Empire, pepper was so highly prized that spice traders’ wealth grew faster than they could spend it. And nowhere was it more available and expensive than in Italia province where Rome stood – and where the average income was higher than that of the entire empire.
In a way, Roman traders were the progenitors of value-based bidding by putting their most profitable merchandise in front of those likeliest to pay the most for it.
Today, it’s a Google Ads’ methodology to help advertisers maximize the conversion value of their ad spend, and one of several cards you can play to unlevel a playing field where every advertiser is using the same automation.
But things have changed a little bit since the Romans were in charge, and there’s more to value-based bidding than starting a price war over spices.
In 2021, around 80% of Alphabet’s $257 billion in revenue came from Google’s advertising channels including search, shopping, and YouTube – that’s a huge ecosystem of people searching for products and information.
With it, Google has acquired a staggeringly large data set rich with consumer intent to inform its decisions. This is paired with world-class AI and machine learning that helps advertisers make the right decisions for their clients and businesses.
But that data is incomplete; it doesn’t account for account-specific information like who bought from you via a Google advertisement but later returned their purchase, or how one customer from geo 1 may have 10x the value of a customer from geo 2.
Value-based bidding closes that information gap by telling Google what your business considers to be the most and least valuable sources of traffic.
On our video podcast, PPC Town Hall, Google explained to us everything about Value-Based Bidding: how it works, best practices to follow, and common pitfalls to avoid.
Get actionable PPC tips, strategies, and tactics from industry experts twice a month.
Bidding to value happens when you tell Google things that Smart Bidding can’t measure, such as:
How much a customer is worth to your business, revenue stream, and profitability
Which conversions turned out to be money in the bank and which ones didn’t
The steps a lead took online or offline after converting via Google that resulted in revenue, and how much you value each of these conversion action steps
This graph is a hypothetical example of how value-based bidding helps you maximize your conversion value; it’s not how value-based bidding works in all cases. It’s possible to generate a higher volume of lower conversion value customers as well. The goal is to maximize conversion value, not the number of conversions.
Traditional conversion-based bidding methods don’t account for this level of nuance. With value-based strategies, you spend more of your budget acquiring customers most likely to create profit for your business.
In short:
Differentiate your customers. It’s likely you already segment customers based on their value to your business, but Google doesn’t have this information.
Bid on what matters. With a value-based bid strategy, Google learns which potential customers are most valuable to you.
Drive increased performance. Bidding higher on more valuable customers delivers incremental revenue lift and profitability.
Remember that different Google channels have different prerequisites and settings to enable value-based bidding. With Smart Shopping migrated to Performance Max, the only option is bidding to value. Search and Standard Shopping give you a choice between conversion-based or value-based strategies.
There are two broad ways to share data with Google.
Online Conversions
Global Site Tag and Google Tag Manager help you pass back online data points with additional tag parameters at the time of conversion, to help Google understand a conversion’s value.
Conversion data makes or breaks your success with value-based bidding. Be sure to set up and track more accurate conversions that match your business goals.
Some advertisers still use pageviews and other low-touch actions as conversions. We suggest something more indicative of interest, such as a form submission or purchase.
Offline Conversions
Offline Conversion Imports let you directly import conversions that took place offline, which you can pass back to Google via tools like Zapier, direct CRM integrations with Salesforce and HubSpot, or by uploading formatted spreadsheets. Anyone who clicks on your ad gets assigned a Google Click ID (GCLID). Use this anonymous identifier to report back on their conversion path while keeping customer data private.
For an advertiser who sells cosmetic products using an omnichannel strategy, using Offline Conversion Imports can tell Google data associated with different GCLIDs. For example:
True transaction value after a customer makes a full or partial return
Different values for first-time vs. repeat customers
The purchase value of a transaction in-store, with or without clicking on a digital ad
Offline Conversion Imports applies data up to 90 days old to the bidding algorithm (anything outside is used for reporting purposes only). You can either share the information daily and use conversion adjustments later on (Google-recommended best practice), or delay uploading conversions until you know more as long as it meets this threshold.
You can also use the Offline Conversions API in Google Marketing Platform to upload offline actions into Campaign Manager, Search Ads 360, and Display & Video 360 keyed to a DoubleClick User ID, GCLID, Device ID, or Match ID to view offline conversions.
We’ve talked about the importance of using conversion values, but how do you decide what numbers to use? Consider these elements the next time you set them up for an account.
Estimated Value: This is your most educated guess as to how much money a conversion has or will generate. Depending on your needs, you could consider immediate top-line (revenue), bottom-line (profit and margin), forecasted profit, or customer lifetime value.
Implementation: With conversion tracking enabled, different conversions can have different values. You can also choose to assign the same value to all conversions if your business model demands it. Three ways to assign values include:
Ecommerce Transaction Value: For online stores with shopping carts, your conversion values can vary based on the item. One conversion could be worth $25, while another could be worth many multiples.
Profit Margin: If your average order value (AOV) is $3,000 with a 45% profit margin, and your CRM shows that 20% of leads become customers, your conversion value would be (3,000 x .45 x .20) $270.
Lifetime Value: For the same AOV but using LTV modeling, you find that customers spend an additional $5,000 on average over their lifetime. At the same profit margin, your profit per customer is $3,600 ($3,000 + $5,000)*(.45). With a 20% conversion rate, your conversion value is $720.
Frequency: Pass value data back to Google as quickly and consistently as possible, ideally daily. This allows your account to get as close as possible to real-time optimization – especially necessary for ecommerce and verticals where inventory is limited.
Remember not to get caught up with exact figures – it’s fine to use estimates. Ensuring the values closely represent your business objectives is the most important part of this strategy.
Conversion Value Rules is a Google Ads feature that lets you tell their system more about how you value traffic based on three conditions:
Location
Audience (including first-party and Google Audience lists)
Device
Value Rules are applied at the account or cross-account level on top of your base conversion value. This makes it critical that you work with your clients or other teams to understand the hierarchy of audiences, locations, and devices for your business.
Software businesses that generate leads can use Value Rules to share business insights with Google such as:
Users in the United States are 3x more valuable (LTV or transaction value) than the average conversion (location)
Users who signed up for their newsletter are 20% more valuable (audience)
Users who browse on a desktop are 50% less valuable (device)
You should only create Conversion Value Rules that can’t be observed by or shared with Google through other means. For example, the profit margin isn’t known to Google; customer LTV per lead can only be inferred from your CRM database.
If you already share ecommerce transaction value through Google Shopping, for example, then Google already knows the differential in transaction value for consumers in geos and will take this into account within the Smart Bidding algorithm. So no Conversion Value Rules are needed in this case.
Outside of Value Rules, you can also use these other techniques to adjust conversion values:
Conversion adjustments to retract and restate previously reported conversions reported online or through Offline Conversion Import.
Data exclusions tell Smart Bidding to ignore all data from a particular date range when conversion tracking data was inactive or broken. This tool does not adjust for fluctuations in conversions.
Pre-import adjustments allow you to modify the value based on a variety of factors that you control. This will help guide Smart Bidding to achieve your value objectives.
Maximize Conversion Value (with or without a target ROAS) is the definitive Smart Bidding strategy for businesses with varied products or customers with different values.
Maximize Conversions isn’t recommended unless you only sell a single product variant, or have no information to differentiate the value of one type of lead vs. another. When using this bid strategy, Google will optimize for conversion number and will not consider differences in conversion values.
The addition of a target ROAS simply tells Smart Bidding to maximize your conversion value within a certain spend threshold. But remember that too high a target can limit conversions, and too low a target can eat into profits. Be sure to experiment with your ROAS target to find the sweet spot.
The Impact Of Value-Based Bidding On PPC Performance
The numbers speak for themselves – Google’s internal data from 2021 shows clear gains from bidding to value using Maximize Conversion Value with a target ROAS. Search campaigns enjoy a 14% lift in conversion value at a similar ROAS, while Standard Shopping campaigns with tROAS can see a lift upwards of 30%.
Aside from the tangibles, value-based bidding offers operational and strategic advantages for any agency or brand.
Closer Alignment With Google
Bidding to value – and setting up the systems that make it possible – allows Google to focus on the quality and total conversion value of people who see your ads. This allows you to optimize campaigns to match your true business goals, better reflect your business’ observable data, and optimize to what matters – like revenue, profit, or customer lifetime value.
Better Post-Conversion Optimization
With better traffic comes a more manageable post-conversion process. If your business engages with customers extensively between online conversion and sale, you can optimize for customer LTVs rather than lead volume. What’s most important is that you report conversions (with values) back to Google to better align bidding with business outcomes and marketing objectives.
Showcase Strategic Value
It’s easier to make a case for how your agency or team adds value to the marketing landscape with value-based bidding. This will become increasingly important as Google automates more of its platform and uses Smart Bidding to help advertising capture the most business value with your Google campaigns.
Simply optimizing keywords and optimizing manual campaigns is no longer a viable role. With real-time optimization, you can account for nuances in value when using target ROAS and Maximize Conversion Value.
You can help to translate the performance of Google Marketing campaigns to be directly aligned with ultimate business goals for your client and bring first-party data in to assert your competitive advantage.
Implementing Your Value-Based Bid Strategy: A Checklist
Watch Taylor Mathauer and Will Gray from WebMechanix share how they used Value-Based Bidding to generate higher-quality leads for their client.
You will learn: - Why they decided to use value-based bidding - Success with value-based bidding - The state of smart bidding and limitations with value-based bidding - Where they’ve seen value-based bidding not work - Requirements for using value-based bidding - When is value-based bidding appropriate - How to track success with value-based bidding
Most advertisers have now made the transition from manual to automated bidding, but that’s not where the road to PPC optimization should end. There are many forms of automated bidding, some more powerful than others.
Value-based bidding is the current state-of-the-art in bid management for Google Ads, but it relies on advertisers assigning a value to conversions so Google’s algorithms can prioritize more lucrative conversions.
Bidding to value works for a wide variety of advertising goals, but because it uses a target ROAS, it’s sometimes incorrectly assumed that it’s only for ecommerce.
Even lead-gen advertisers can use value-based bidding because they also get different values from different types of leads. The trick is simply in how to communicate these different values to the automated bidding systems.
This next part is the guide that will help you be successful as you transition your campaigns to a value-based optimization methodology. Like the rest of this article, it was put together in collaboration with Google, the company that created many of the systems advertisers use to implement value-based bidding.
Optmyzr took the theory behind these tools, analyzed what real advertisers did, and distilled it down into this guide. Read on to get the best advice from both the creators of the tools and the advertisers who use those tools to deliver winning outcomes.
We’ve split this up into the four key parts of doing value-based bidding the right way. They’re all equally important, but we’ve listed them here in the order that most closely follows the implementation timeline. So start from the top and work your way down as you deploy a value-based bidding strategy for your account.
Value-Based Bidding Best Practices You Should Follow
Conversion Tracking and Assigning Value
For any optimization strategy to work well (manual or automated), advertisers must collect the right data to help make smart decisions.
Google takes care of reporting accurate data about impressions, clicks, costs, etc. But it’s up to advertisers to ensure they get accurate data about results-driven by these clicks. This means setting up conversion tracking correctly.
Most accounts already have conversion tracking set up. In lead gen, a conversion might be when someone fills out the lead-gen form on a landing page. In ecommerce, it might be when the consumer checks out and pays for their cart.
Here are some considerations related to conversion tracking:
Create multiple conversion actions to reflect the multiple stages of a conversion. This can include micro-conversions (good things that happen before the conversion) or additional macro-conversions (good things that happen after the initial conversion) e.g. when a lead becomes a sales qualified lead, and when a lead turns into a customer. In ecommerce, additional conversions could happen when a new customer exhibits signals they will become a high-LTV customer.
Create reasonable values for the different conversion actions. Not every action should carry the same weight. For example, a sales-qualified lead is probably worth more than a lead, and a sale is worth more than a sales-qualified lead. In ecommerce, a user who returns half their purchase should be valued lower than if they’d kept all their items.
When using relative rather than exact values for different conversions, ensure these values are at a similar scale as the cost of clicks. For example, if an average click costs $10, don’t report that a lead is worth ‘1’ and a sale is worth ‘2’, because then every click will look like it was a money-loser and automated bidding will scale back your ads. Instead, scale up the relative values, for example, value a lead at 100 and a sale at 200. That way, when 8 clicks lead to 1 lead, the ROAS will look much healthier and your ads won’t be throttled.
Consider which conversion actions should be used for bidding optimization and whether you may be stacking the values too high. For example, if you have 3 conversion actions related to leads – a lead ($10), a sales qualified lead ($20), and a sale ($50) – and each is a primary action, then their values will get added. So a sale, which presumably started as a lead and then became a sales-qualified lead before turning into a sale will get a value of $10 + $20 + $50 = $80.
Make sure this makes sense as you consider the next section of guidelines about targets. If you haven’t heard of primary and secondary conversion actions, these are Google’s new way of asking advertisers what to count towards bidding optimization. It used to be a checkbox “include in conversions”, but now they call it primary conversion actions (which are used by automation) and secondary conversion actions which are merely used for observation and reporting, but won’t influence the behavior of automated bidding.
As an ecommerce advertiser, consider setting a conversion value based on a sale’s profitability rather than its revenue, to account for varying margins for different products. Aligning the values you report with the KPIs your business cares about can simplify a lot of things – for example, choosing the right target ROAS.
If some of your conversion value increases or decreases based on things that happen offline, use one of the offline conversion tracking tools described earlier in this article.
If you report conversions to Google after they happened, or you restate values later on, try to do this at least daily so the machine learning gets fresh data all the time.
When using Conversion Value Rules, only communicate to Google things that may not be observable through Smart Bidding e.g. profit margin, customer lifetime value, upsell opportunities, etc.
Use one of these key product features from Google to adjust values:
Structure and Targets
Account structure and targets go hand-in-hand because which targets you can set depends on how your account is structured. If you need to have different targets for different parts of your business, you should maintain at least one campaign for each.
While many advertisers may have heard Google’s call for a simpler account structure, bear in mind they’re asking advertisers to remove unnecessary complexity. So don’t maintain multiple campaigns for the sake of having the same keywords in different match types. But do maintain separate campaigns if you sell seasonal products that will have different targets as the seasons change.
Decide at what level your conversion actions make sense. You can set them cross-account, at the account level, or by campaign or groups of campaigns. When Google’s algorithm predicts conversion rates, it uses all data associated with a conversion action’s scope. This means you can have a single conversion action at the MCC level that guides all bid decisions across multiple accounts for the same company. Or if you have a campaign with a unique one-off goal where you don’t want other campaigns to impact its predictions, set it up with a campaign-level conversion action.
Maintaining a minimum conversion volume is becoming less important as Google’s machine learning improves and is able to draw inferences from system-wide data. That said, most advertisers we talk to find automation performs better with campaigns that have more conversions. Target at least 30-50 conversions per month before enabling automated bids. Before then, use Enhanced CPC bidding or Maximize Conversion Value (with no tROAS) to build up data. And consider adding micro-conversions if you find yourself struggling to meet the conversion threshold when relying solely on your primary conversion action.
When testing value-based bidding with Google’s Experiments framework, you need double the number of conversions. So building on the previous point, aim for 30-50 conversions per month for both the control and experiment groups. Otherwise, you may need to expand your testing period beyond 1-2 months to reach conclusive results.
If you followed the advice from the previous section and are reporting profits rather than revenue, you can now set targets based on true goals. Before reporting profits in conversion tracking, some advertisers use the tROAS to emulate profits. For example, in a campaign where the typical product has a 50% margin (the cost of the goods sold is half the price charged for the item), an advertiser can set a 200% tROAS knowing that if they hit that ROAS exactly, they will break even. Instead, when they report profits, they can now set a tROAS of 100% to achieve the same thing and avoid confusion about why they have a 200% tROAS when they would have been happy with 100%.
Set the initial target ROAS based on historical performance. The simple math is conversion value (such as revenue) divided by ad cost, for at least the past 30 days. Setting it too aggressively may severely limit volume.
Use profitability as a guide for setting the right budgets & ROAS targets with Performance Planner.
When you expect a sudden fluctuation in user behavior that will impact conversions, consider setting a seasonality adjustment or modifying the tROAS. The benefit of a seasonality adjustment is that you can set an end date and machine learning will ignore data from the seasonality event for its future predictions.
Testing and Hygiene
With conversion tracking reporting the right thing and targets set to achieve actual business goals, advertisers are ready to start experimenting with value-based bidding. But just like with any test, here are a few considerations to keep in mind:
Build up enough conversion history before starting a test. At least 3 conversion cycles or 4 weeks is recommended, whichever is longer. That means that if your typical conversion takes 15 days, you should wait 45 days before turning on your target ROAS. Use the Path Metrics report in the Attribution section in Google Ads to learn what your typical conversion delay is.
If you have a tROAS, uncap your budgets so that the system can find incremental conversions within your target. If you do not have a tROAS, use Maximum Conversion Value as the bid strategy and keep your budget cap in line with your expected daily spend goals.
Google recommends not changing targets more than 20% or more frequently than every 2 weeks. These are guidelines and it’s okay if you don’t follow them. Your business objectives should take priority. Keep in mind that a big change in your target can bump Smart Bidding into its learning phase, but that does not mean Google’s machine learning forgot everything from the past. It simply means that a large swing in your target is making your ads eligible for a significantly different set of queries for which Google may not know much about your expected performance. For the same queries you’ve had before, it’ll be business as usual. For the new queries, performance may fluctuate and that may make your averages look a little strange for a while, but you didn’t break machine learning.
A best practice of gathering conversion value at observation mode first (without setting bids) for Offline Conversion Imports is 2-4 weeks.
If something goes wrong and conversion data is broken – for example, if your website goes down – use a data exclusion to let machine learning know that it should ignore data from that period for making future predictions.
As with any test, minimize big changes. For example, changing the landing page or your offer could dramatically impact conversion rates and Google’s algorithms won’t necessarily know if the change was due to this or something within its own control like bids or broad matches. If you have to make changes to your campaigns during the test period, make the same change to both the control and experimental groups.
Keep in mind when switching to value-based bidding:
Evaluating Performance
Finally, with tests underway, it’s important to understand how to evaluate performance the right way so you avoid making incorrect decisions.
Machine learning needs a bit of time to learn; it’s called machine learning after all! So give it 1-2 weeks to get through the ramp-up period and then ONLY consider data from that point forward when deciding what’s the winner and what’s the loser. Optmyzr’s [Campaign Experiments](Campaign Experiments by Optmyzr: Google Ads Experiments Made Easy) tool will help you see all experiments in one place and accounts for the ramp-up period.
Experiments shouldn’t be terminated too soon; 4-8 weeks is generally the right amount of time to let an experiment accrue enough data that isn’t biased by time factors. Of course, the exact amount of time depends on the volume of the campaigns so be sure to look for statistically significant results.
When automating value-based bids, your metrics for deciding winners and losers should focus on revenue maximization or conversion value maximization, so don’t pick a winner based on an unrelated metric like CTR for example.
Keep in mind that most campaigns have conversion lag. So when analyzing performance, ignore the most recent days where conversion reporting is likely still incomplete. You can use Google’s attribution reports to find the typical conversion lag for each of your campaigns.
Google’s Bid Strategy Report already does a lot of the performance analysis for you. Use tools like Optmyzr to delve deeper into the numbers and produce additional reports your clients or boss might be asking for.
Common Pitfalls (As Identified by Technical Specialists)
Besides using the above best practices for starting with value-based bidding in your account, beware of some of the most common pitfalls we’ve seen.
1. Your ROAS goal should not be too aggressive
It would be nice if automation was a magic bullet that could instantly quadruple your performance, but chances are this won’t work. It’s better to start with the recommended tROAS based on historical performance so that the system gets a good baseline. From there, you can slowly change the tROAS and periodically review if these small tweaks are getting you closer to where you’d like to be. The Optmyzr Rule Engine is a great tool that can automate these periodic small tweaks to your targets.
2. Don’t analyze performance during the learning period
We said it in the guidelines but we’ll say it again because too many advertisers can’t wait to see results so they jump the gun and make decisions too quickly. The system takes time to calibrate and settle in, so give it the required 1-2 weeks to do this before you start analyzing results.
3. Don’t forget about conversion delays
We said this one before too but it’s another all-too-common mistake to judge a campaign by the most recent performance we have access to. And while Google Ads will report clicks/cost/etc. in a matter of minutes for most campaigns, conversions take time because people take time to make up their minds. If you judge a campaign on this partial data, you’re bound to make bad decisions. Said another way, remember that Google Ads data is click-centric. If a click today leads to a conversion in 5 days, that conversion will show up in the report for today’s data after 5 days. The data you look at may not tell you the complete and final picture. So be sure to exclude performance during the conversion delay period.
4. Don’t look at the wrong metrics
For better or for worse, Google has really trained advertisers to care about click-through rate, conversion rate, and yes, even ROAS. But don’t lose sight of how those metrics relate to your business goals. We once talked to an advertiser who told their agency they had to get a 400% ROAS to keep the business. They dutifully met that target until one day they asked the client why they insisted on a ROAS that was actually decreasing profits. The client sheepishly admitted they got 300% ROAS from the last agency and thought 400% would be better.
5. Not assigning value to conversions that matter
The whole premise of value-based bidding is to help machine learning understand the true value of conversions to your business. So don’t skip assigning values to all your conversion actions. But also don’t get stuck on setting the exact right amount. It’s fine to estimate, measure and iterate.
6. Poor campaign structure
Old campaign structures can really hamper results. For example, you should not separate campaigns by keyword match type, or by device type. The former is almost always unnecessary, the latter likely is less necessary than it once was. Your account structure should be as simple as possible while still enabling you to set different goals based on your business needs.
What A Successful Value-Based Bid Strategy Looks Like
The transition from a conversion-based mindset to value-based bidding can be rewarding, but only when done right. That starts with understanding how Smart Bidding makes decisions in order to meet it halfway.
Advertisers around the world have made mistakes like jumping into Smart Bidding without taking prerequisite measures, evaluating performance too early when testing a new bid strategy, and not realizing that Smart Bidding already takes into account observable conversion data from all your campaigns.
Value-based bidding is the next level of account optimization after you’ve run the course with a conversion-based methodology. The guidelines we’ve covered in this article will help you see better results more quickly by avoiding some of the most common pitfalls we’ve seen advertisers fall for when deploying the tools from Google.
Be the advertiser who succeeds by having a plan, sets things up to succeed from the outset, understands the limitations of Google’s decision-making algorithms, and feeds updated and relevant data to align the algorithm with your business goals.
In March of 2024, Google fixed a glitch that blocked Search terms from showing in the PMax scripts that would pull search categories. This means that you can see the categories PMax matched your budget with, as well as the specific Search terms.
Just like in traditional search campaigns, understanding what your users are searching for helps you bid more effectively, and know which negatives to add to eliminate waste. However, this still requires a script—meaning that you need to have knowledge of applying scripts, or your own API tokens, or use a tool like Optmyzr.
Optmyzr customers have access to our PMax search terms report and a number of other tools. But, in this article, we’re going to focus primarily on solutions for advertisers who don’t have access to Optmyzr’s solutions for PMax because it’s important to us that everyone has access to budget-saving resources.
Before we dive into analysis and optimization we need to know what we’re working with. So, let’s quickly define a few important terms.
What Are Search Categories, Search Terms, Search Keywords, & Search Themes?
A search category is specific to PMax. It groups similar search terms giving you an eagle-eye insight into what is going on in your account. It’ll also give you a sense of the main themes for searches.
It’s important to note that the categories do not spill over into placements, so you shouldn’t take the categories you get for search as an indication of your placements. Understanding the places you’re serving for requires different tools.
A search term is the actual thing—a word or a group of words—a user searches for. Typically, you will see something related to the keyword (which we’ll go over in a bit in the search term) but sometimes due to the nature of close variants, the words in the search term will actually be completely different. This can happen due to broad match or the way that PMax matches.
Part of the reason that search terms are so important to audit is that you can sometimes get cheaper ways of searching off of those search terms. You also can get insights into potential ideas for negatives.
A search keyword is the thing that you bid on in traditional search campaigns. It has different match types and uses different signals to match user queries. In PMax you don’t actually bid on keywords. Instead, you use something called search themes.
Search themes, behave sort of like broad keywords. However, they have interesting ranking rules. If you have a keyword in your traditional search campaigns that is an exact match, there’s a very high likelihood that that keyword will win for other match types.
It’s much more likely that the search theme will win out, especially if the user semantically searches exactly the way that the PMax search theme is written. Understanding the difference between keywords and themes will help create the best strategies for your account going forward.
What Can You Do With The Data From The PMax Reports?
Now that we have a basic understanding of all the pieces in play, we can dive into what to do with the data available through our PMax search term and search category reports.
You start with an audit of your PMax search themes, confirming that you’ve got the right ones in place. If you see a lot of search terms that are the same as your search themes and keywords in your traditional search campaigns, you may want to switch out your search themes. This is because you are setting yourself up to cannibalize your search budget with your PMax campaign.
A better way to go about it is to pick exact match keyword concepts that you want for your traditional search and test new potential candidates in PMax. In this way, you can get that incremental traffic by testing new ideas without having the repercussions of limiting your search campaigns that may need more data to ramp up.
The other really important point is around negative keywords. PMax doesn’t behave like a traditional campaign. It requires you to send a list of “normal” negatives through a form to Google support reps, and brand terms that you want as negatives.
This can apply to both your brand and your competitors.
While you can only eliminate waste, you can’t necessarily direct traffic. This is an important mechanic because many will treat asset groups like ad groups and the lack of ability to have asset group level negatives means you can’t do this without hurting your account.
You will likely have asset groups that don’t perform and may have parts of your business that don’t get access to budgets.
Finally, having a sense of how much of your budget is going to search in general is useful. If you see that the auction prices in your PMax campaign are drastically cheaper than your traditional search, especially for search categories that are important to you, that could be a sign that your PMax campaign isn’t budgeting enough for what you’re going after, and the lion’s share of your budget is being soaked up by visual content.
Visual content isn’t inherently bad, but it can create false positives in terms of how much keyword concepts cost.
How to Audit Your PMax Search Terms?
We talked quite a bit about the analysis. Here are the main action items that you’ll want to do in relation to PMax and auditing your search themes, categories, and terms.
Make sure that there is minimal overlap between the search themes and your traditional search keywords. If you have a lot of overlap, consider swapping out your search themes.
Don’t forget negatives! Also, remember asset groups do not allow for negatives. You have to make the choice at the campaign level through the form or at the account level and just eliminate waste.
Remember that different channels have different auction prices. If you’re seeing a high level of spend that’s cheaper than your traditional search, consider reworking your structure so that PMax either can get a little bit more budget, or be mindful that you probably don’t have the budget for PMax to hit the minimum 60 conversions in a 30-day period and Google is doing the best it can with the limited resources.
As a reminder, Optmyzr customers have access to the PMax Search term script and can use our other suite of tools including Rule Engine, Campaign Automator, and many other resources to build out account structures that serve them best.
If you’re not an Optmyzr customer, our co-founder Fred Valleays released a free version of the script which you can test out in your own accounts. And if you’d like to explore becoming a customer, you can click this link for a free full-functionality 14-day trial.
Thousands of advertisers — from small agencies to big brands — worldwide use Optmyzr to manage over $5 billion in ad spend every year.
You will also get the resources you need to get started and more. Our team will also be on hand to answer questions and provide any support we can.
You know an idea has jumped the shark when you walk into a coffee shop, and the first thing you hear is a customer leaning over the espresso machine, asking the barista if he’s ever used ChatGPT.
That is exactly what happened this week—even the wildest LLM couldn’t make this stuff up—right as I stepped into this shop to pen an article on AI and agencies for Optmyzr.
For a long time, what Google liked to call AI was actually just fairly crude machine learning. Nobody was impressed with ML, to be honest, and even a few years ago the concept of this technology replacing agencies was too far-fetched for any rational marketer to even consider.
Then we hit an inflection point, the future became the present cluttered with Groks and Midjourneys and Claudes, and this possibility doesn’t seem too crazy anymore. Because it’s already happening.
AI Is Replacing Tasks
First AI came for the entry-level beginning marketers. Next, it’s coming for the agency owners.
It’s easy to ignore what has happened over the past year or two, since most experienced freelancers, consultants, and agency owners don’t do the sort of daily grunt work that entry-level marketers do.
I’m so far distanced from the sort of work I did right out of college that it’s incredibly easy to forget how mind-numbingly grueling that work can be.
For better or worse, a lot of that work has already been replaced. For the paid search and paid social world, I’m talking about cleaning up data dumps, editing banner images in Photoshop, writing headlines and descriptions for responsive search ads, keyword research, topic brainstorming, and even some fairly complex data analysis.
As it turns out, a single-click generative fill in Photoshop replaces 15 minutes of tedious clicking. Using Code Interpreter to analyze a CSV does things I didn’t even know were possible in Excel. And using Grok in “Fun Mode” gives ideas for ad copy that even the most experienced copywriter might miss.
All that to say, it’s tasks like these that are being delegated away to the machines. We can feel sorry for the budding digital marketers out there, but the reality is that those jobs are being decimated.
A Business Model Dependent Upon Service Delivery Is Fragile
Many agencies revolve around delivering tasks.
They set up Google Ads campaigns.
They send a performance report at the end of the month.
They fulfill their contract to post social updates five times a week.
They click around in Merchant Center and make sure the feed is optimized.
While this model works for a while, at some point Google Ads introduces Merchant Center Next and years of best practices go out the window, tools use LLMs to write better ad copy than most humans, ad platforms develop native integrations with even more tools, reporting is automated, and these agencies are left out to dry.
So what is going to differentiate a thriving agency from a floundering agency?
Everyone always says “ideas and strategy” but that’s sort of a cop-out. Here’s the real answer:
Economics and Finance: Agencies with a strong understanding of the client’s P&L, margins, business goals, and market position will be able to allocate budget and direct the campaigns more efficiently than any AI can yet do.
Branding and Awareness: Digital marketers are often allergic to the idea of spending resources on branding, since we’ve been so spoiled with attribution over the years. But a brand voice won’t ever be able to be truly captured by AI: a human with taste still has to shepherd this.
Deep Anecdotal Experience: Digital marketers are even more allergic to the idea of gut feelings, because we tend to view things in terms of data dumps. But for those of us who’ve run thousands of campaigns spending millions of dollars over the years, eventually we just have gut feelings about strategies or tactics that will almost certainly save the client both time and money.
Sales: The reality is that as you go upmarket, it’s less about tactics and more about relationships. Good luck hopping on a plane and grabbing drinks with Gemini.
Strategy and Data Analysis Must Be Folded In
There are some agencies out there which split out strategy, or data analysis, or conversion tracking, or creative production as separate line items.
My personal belief is that this is short-sighted. It’s sacrificing long-term value for a quick buck now.
Because as AI develops—more rapidly than many of us want to admit—we’re quickly realizing that the emperor has no clothes, and many agencies aren’t really offering that much value in comparison to the prices they charge.
At our agency, we fold in everything.
There isn’t a single thing we charge extra for, because we consider that our expertise comes as a package, whether that’s market research, product pricing analysis, competitor research, reporting, data visualization, strategy, meetings, or just the standard old campaign management.
It’s all part of the same deal. After all, we only win when the client wins, so isn’t it in our best interest to do everything within our power to increase their ROI?
Good agencies will embrace their role as close-to-the-money sales advisors. They’ll embrace their role as ad brokers and sales guys. They’ll embrace their role as a consultant, strategist, tastemaker, and research analyst, offering as much as humanly possible to improve campaign performance.
Bad agencies will continue in a rut of service delivery, nickel-and-diming clients, upselling more deliverables, thinking in terms of hourly billables and gatekeeping information, reporting only in numbers and not in holistic long-term results.
xGood agencies will use AI to streamline their delivery process, increase the quality and creativity of their ad campaigns, discover new ways of analyzing data, and decrease turnaround time — but retain the very human element of taste and experience.
Bad agencies will use AI as a crutch, and churning out deliverables on autopilot.
In every industry, there comes a tabula rasa, a pivotal point in which the slate is wiped clean, the board is reset, and the players start again. I’d say we’re very close to that point—even the barista knows it—and the resulting chaos may very well filter through every agency in existence.
If you use Google Ads primarily as a growth tool, it stands to reason that you would dedicate your budget in part or in whole to acquiring new customers.
While there are certainly strong use cases to drive repeat business through search advertising, you have other arguably better (and certainly less expensive) ways to engage existing customers once you’ve met their initial demand – like email and SMS marketing.
Whether you’re running lead generation campaigns or ecommerce in Google Ads, the cost of advertising is high enough that it makes sense to focus on those users who haven’t bought from you before.
New Customer Acquisition is a functionality in Performance Max and Search that allows you to exclude users who have done business with you using a customer list. Accurate data is essential if you want to use this setting to ensure good results.
Why New Customer Acquisition Is Important
If you have New Customer Acquisition activated without having a good handle on your data, there’s a good chance that your ROAS is lower than it appears to be.
If you do not properly define existing customers or the value of new customers, this can result in your account overpaying for existing customers, thus distorting ROAS.
Each of the columns in the image above adds context to how your New Customer Acquisition is performing:
Conversions: The total number of conversions, as defined by the primary conversion action of the campaign
New customers: How many of the conversions stem from customers who are not present on your customer list
Conv. value: The total value of all conversions, including any extra conversion value attributed to new customers
New customer lifetime value: How much of the conversion value is attributed as incremental value from new customers
Two Strategies for New Customer Acquisition Explained
Google Ads does a good job of allowing advertisers who know how to set up ad accounts to do so in a way that makes financial sense of their investment.
One of the ways this shows up is in how New Customer Acquisition offers two approaches to optimize bids for new customers. Both of these approaches are viable with the right data, so choose the one that makes sense for your account’s campaign and business goals.
1. Bidding Exclusively On New Customers
If your sole focus is to reach people who have never done business with you, you can tell Google to only serve your ads to new customers and ignore those who have converted in the past.
In this approach, you only need to define existing customers when you set up audience segments in the campaign. This way, Google knows which customers are existing ones and can therefore focus on others who are searching for what you offer.
2. Bidding Higher On New Customers Than Existing Customers
At other times, you may still wish to show your ad to people who have done business with you in the past – but they may be less valuable and therefore take a lower priority.
For this second approach, in addition to defining existing customers, you must also define a value attributed to the conversion of new customers. This provides a signal to Smart Bidding that this customer type is more valuable, so that it can begin to bid higher on similar signals.
How to Succeed with New Customer Acquisition in Google Ads
If you do not properly define your existing customers and the value of new customers, it can result in overpaying for existing customers and thus distorting ROAS.
Take these steps to prepare your campaign ahead of prospecting for new business:
Ensure that you can create a detailed audience segment with existing customers. You will need at least 1,000 active customers on the list. Not every business and account will be able to do this, and they should refrain from using Customer Acquisition to avoid overpaying for existing customers and distorting ROAS.
Assess whether you can assign an additional value to new customers. You can use considerations like buying patterns, fee structures, and other financial details to arrive at a value. Keep in mind, this value is attributed the same regardless of the conversion’s original value, so even a small extra value can significantly enhance your ROAS and Smart Bidding.
If testing New Customer Acquisition, include the “New customers” and “New customer lifetime value” columns in your campaign overview. This allows you to monitor conversions from new customers and the total additional value attributed to them, letting you better assess the impact on your overall ROAS.
2023 was a lot. There were big cultural events that shook economic stability, as well as major innovations in ad tech.
One can never be sure how these changes will influence ad accounts. Sometimes they’re negligible, other times they have a big impact (for good or for ill).
We decided to look at the following mechanics and how advertisers can take the lessons from 2023 to future-proof their campaigns moving forward:
Match types: Did Broad Match enhancements in May of 2023 move the needle on its performance?
Auction price volatility: How have auction prices changed and what impact does that have on other key metrics for major verticals?
Performance Max: Are best practices actually best practices and just how much ROI is there in investing extra effort in creative?
We combined all three studies into one massive report because we see these questions as relating to each other. When match types behave the way you think they will (or don’t) that directly influences whether your account structure is going to deliver strong ROI. Volatility in auction prices might make you likely to trust PMax even though there are strong gains and paths to profit.
If you’re just interested in one of these questions, you can skip to that section in the navigation, but without any further ado, let’s dive in!
Match Types: Has Broad Match Evolved Enough & Is Exact Still the Best Path to Efficient Profit?
Before we dive into the data - here’s the TLDR:
While Exact did have more accounts (4000) performing better than Broad (all metrics), the difference closed a lot since our last investigation. This shows big improvements for Broad Match!
Average CPCs being as close as they are feels tied to general market fluctuation than one match type being “better” than the other.
Phrase Match remains statistically insignificant as advertisers own that Exact performs the same job, and Broad Match has a place in today’s PPC landscape.
Criteria for the Study
Must be running for at least 90 days prior to Q4 2023
Minimum spend of $1000 and maximum spend of $10 million per month
No branded campaigns included
Must have both Broad Match and Exact Match in the account
Metrics
ROAS
25.90% of accounts performed better with Broad, median percentage difference is 52.78%
74.10% of accounts performed better with Exact, median percentage difference is 100.59%
CPA
26.16% of accounts performed better with Broad, median percentage difference is 41.11%
73.84% of accounts performed better with Exact, median percentage difference is 97.11%
CTR
18.43% of accounts performed better with Broad, median percentage difference is 24.83%
81.57% of accounts performed better with Exact, median percentage difference is 51.11%
Conversion Rate
37.88% of accounts performed better with Broad, median percentage difference is 35.29%
62.12% of accounts performed better with Exact, median percentage difference is 41.05%
CPC
51.50% of accounts performed better with Broad, median percentage difference is 24.91%
48.50% of accounts performed better with Exact, median percentage difference is 30.22%
Findings and Analysis
Broad may not perform at the same level as Exact, but the performance gap closed quite a bit since we last ran this study. We have a few thoughts on why this may have happened:
Google made major improvements to Broad Match and it shows. Between the multilingual understanding and focus on intent, Broad Match is a much more reasonable data source than it was before.
Auction prices trickle down to ROAS and CPA. While there is no denying Exact had demonstrably better ROAS and CPA, the median performance improvements were better. This might be due to rising CPCs across the board.
PMax Search Themes are a factor here - they will always take a back seat to Exact Match while having the potential to win over Broad and Phrase if the syntax better matches the search theme. Given the wide adoption of PMax and statistically relevant adoption of search themes, broad might have performed even better if budget wasn’t diverted to PMax.
Action Plan
At this point there is no denying the match types have evolved to render syntax-driven structures moot. Whether you lean into Broad Match, DSA, or PMax as your data driver, you’re going to need to account for rules of engagement.
The Case for Keeping Broad in Your Account
Broad Match will show you exactly how various queries matched. While this might feel like an overrated feature, seeing what percentage of your Broad Match traffic would have come to you via phrase/exact can help you prioritize which keywords to keep/change out in your core ad groups.
If you use Broad Match, be sure that you add your other keywords as ad group level Exact Match negatives. This will ensure that your Broad Match keyword is able to do the job you intend for it to do without cannibalizing your proven keyword concepts.
To do this, you can run any of the following strategies:
A Broad Match ad group with one to two Broad Match keywords you’re using to gather data. The other ad groups in the campaigns should exclusively be Phrase or Exact (I’d suggest Exact).
A campaign with one ad group using Broad Match and all the other campaigns exclusively using Exact/Phrase.
Between the two, I’d suggest using the first method as that way Broad and Exact ad groups can help each other average out the deltas in the match types’ metrics. Without the conversions from Exact and the volume from Broad Match, campaigns might struggle to ramp up.
Choosing the right Broad Match keyword champion is the most critical choice. A few considerations:
Does the keyword represent the best “deal” on traffic?
Cheaper keywords won’t win every exploratory auction, but they might help you get discounts on high-value keywords when available.
Don’t ignore quality on the path to the best deal. The keyword still needs to represent your customers.
Keywords have different auction prices in different locations. Be mindful that your champion might need to change depending on geos.
Is the keyword representative of your Exact Match keywords or is it testing completely new ideas?
The benefit to being completely new is that you’re able to test your assumptions on established keyword concepts (i.e. they’re Exact).
Locking in the same root words in a Broad keyword lets you test for variant drift (what percentage of your queries come back as close variants with different root words).
Do your best customers search this way?
Lead gen and ecommerce campaigns need to factor in ROAS. Depriving Google and yourself of revenue data (even if it’s a projection) is asking the algorithm to focus on volume over value.
Honoring how your best customers search (high margin, easy to take care of, etc.) ensures that you’re not only matching keywords, you’re aligning creative.
The core ad metrics to focus on are CPC, conversions, CPA, and CTR-to-conversion rate.
The Case For Using PMax/DSA
PMax represents “black box” marketing to many, but as we’ll go over in the next section, there are a lot of areas for optimization and profit. Choosing to put your Broad Match budget into PMax may serve you better as it inherently comes with channels beyond search.
As younger generations come into their buying power, they are “searching it up” vs Googling it. That means having a presence on YouTube or other meaningful sites can be the difference between having a profitable conversation and losing to your competitor.
The other big checkbox for PMax (or DSA if you truly need just search) is that you won’t be subject to human bias. The keywords you think you’ll need might only cover part of your core customer base. Additionally, human-created keywords (even Broad Match) are subject to low search volume.
Be sure that you’re checking the search term insights to understand what keyword concepts are coming out and which might make sense to include as an Exact search term.
We’ll be going into the data on Search Themes in the PMax section, but it’s worth noting that exactly replicating your search keywords as search themes is likely a mistake. This is because your Exact Match keywords will always win, but phrase and Broad Match can lose to search themes.
Performance Max: What Are Most Advertisers Doing and Are They Right?
Here’s the TLDR on PMax data, which is framed more as questions than organizing by metric gains:
This is not an “easy campaign” type. While only a small percentage of advertisers had campaigns in the red (3.92% of campaigns), advertisers who put in average effort got average results.
There is no right answer on whether to segment your PMax campaigns through asset groups or a separate campaign. Use budget and priority of the product/service as your guiding lights.
We as an industry have a bias for text assets but successful marketers have just as many images and are leveraging video they create.
There is a bias around feed-only campaigns doing better than any other. While they do have a higher median ROAS, they also have the built-in bias of ecommerce having wider adoption of ROAS bidding.
Criteria for the Study
The account needs to be active for at least 90 days prior to the investigation period
Monthly spend needs to be at least $1000 per month and could not exceed $10 million per month
The account needs to have conversion events firing successfully
7100 ad accounts and over 18K campaigns worldwide qualified for the study
Metrics/Questions
Question #1: What Does the Average Advertiser Do with PMax?
57.72% of advertisers run a single PMax campaign in their account
42.28% of advertisers run multiple PMax campaigns.
While 41.35% of advertisers ran one campaign with one asset group, the median number of asset groups per campaign across all advertisers is 31.
Advertisers load up on text assets (16 median per campaign), and image assets (13 median per campaign), but fall short with video (4 median per campaign).
99.2% of advertisers use audience signals.
33.3% of advertisers use search themes.
55.65% of advertisers use account exclusions in combination with PMax. These include negative keywords, placement exclusions, and topics.
72.5% of advertisers run feed-only campaigns.
Analysis/Thoughts
There are some biases in the data given that Optmyzr’s toolset proactively lets advertisers know if they’re missing audience signals. Additionally, there are tools for building out new shopping-oriented campaigns based on performance. This means our customer base is predisposed to harness feed-based PMax campaigns.
Despite those biases, there is no denying that feed-based PMax campaigns are the most popular. This is also due to ecommerce having a wider adoption of PMax than lead gen. There are a few reasons for this:
Smart Shopping got rolled into PMax and so many ecommerce marketers felt compelled to leverage PMax.
PMax thrives on ROAS bidding but can also function with CPA bidding. Lead-gen brands historically struggle to adopt ROAS bidding because they’re nervous about feeding bad data into the system.
Google-first advertisers tend to be more analytical than creative. This is absolutely shown in the bias towards text creative vs. visual. What’s interesting is that despite most PMax channels being visual, advertisers still cling to text (and expect amazing results).
Whether this is because they believe text is synonymous with bottom of the funnel, or because they are not confident or skilled to provide visual content; the fact remains that auto-generated content has a viable place in the marketplace until advertisers own it.
I was truly surprised that it’s essentially 50/50 on whether advertisers use exclusions with PMax. Given how vocal we are as an industry, I was expecting near-universal adoption. It’s unclear whether those who don’t use exclusions are doing so because they trust Google or if they don’t know how to apply exclusions.
Question #2: What Impact Does Applying Effort to PMax Have?
Before we dive into the numbers, it’s important to acknowledge the impact spend has on results. Larger spend accounts will have smaller gains because percentages are going to be smaller. We are sharing median values to mitigate this as much as possible.
Impact of Exclusions (negative keywords, placements, topics)
Campaigns using exclusions (3963) have a median CPA of $21.45 and ROAS of 425.28%
Campaigns not using exclusions (3158) have a median CPA of $18.55 and a ROAS of 423.44%
There is only a .24% difference in conversion rate between campaigns using exclusions (favors not using exclusions)
Impact of Using Feed-Only vs All Creative Asset Campaigns
Feed only campaigns have a median CPA of $21.58 and a ROAS of 502.21%
All asset campaigns have a median CPA of $16.35 and a ROAS of 101.71%
Feed only asset campaigns have a median conversion rate of 2.32% vs all asset campaigns with a conversion rate of 4.72%
Impact Of Using Audience Signals
Note: There is such a delta between accounts that use audience signals vs. those that don’t that we will only be highlighting the metrics of accounts that do. This is because we could only find 121 qualifying campaigns that didn’t use audience signals (compared with the over 14K that do). We’ll be sharing the performance gains vs the actual metrics.
35% better CPA
89% better ROAS
8% better conversion rate
Impact Of Using Search Themes
Campaigns using search themes saw a median CPA of 22.46 and ROAS of 377.33%
Abstaining from search themes resulted in median CPA of 20.30 and ROAS of 453.95%
Conversion rate is flat between using Search Themes and not using them
Impact Of Segmenting PMax Campaigns By Asset Group
Median ROAS of One Asset Group 424.57%
Median ROAS of Multiple Asset Groups 461.64%
Median ROAS of All Campaigns 426.66%
Analysis/Thoughts
There are some real surprises here on what impacts performance. I was not expecting Audience Signals to be such a big factor given that Google shared they’re designed to help teach the algorithm in the early days of the campaign. That near-universal adoption contributed to such big gains points to more utility than an early campaign boost.
Given that audience signals are so important, it’s critical that you’re setting yourself up to leverage them in the privacy-first world. Google now requires consent confirmation attached to your customer match lists and if you don’t include them, the list might fail.
Another big surprise was how tepid the results for search themes are. Given that search themes are designed to represent keywords in PMax, one would think adoption would serve better.
However, there was a sizable population of marketers using their keywords as search themes. This is a bad idea (unless the search themes/keywords are in transition) because Exact Match will always win over search themes.
However, Broad Match and Phrase can lose to search themes if the search theme syntax is closer.
The ideal workflow for search themes is to use them to test potential new Exact Match keywords. If you see your PMax campaign picking up more valuable traffic than your search campaigns, you know you need to consider adding those search themes as Exact Match keywords. Then you can test new search themes.
The control freak in me was disappointed that leveraging exclusions essentially represented a wash. That conversion rates were flat and the gains were very small on accounts that used exclusions makes one question if they are being used correctly.
I believe there is a strong human error component influencing the numbers (people not correctly applying account level negatives or not being aware of the form for campaign level).
That said, numbers don’t lie and it might be worth testing some campaigns without the human bias (provided brand standards are still accounted for).
Before we dive into the state of accounts in general, we wanted to address the biggest PMax question of all: is it worth it to do segmentation work?
Short answer: yes.
Long answer: your budget is going to influence whether you make this an asset-level or campaign-level segmentation.
If part of your business needs a specific budget, then asking one campaign to do all the work might be tough (especially if you’re serving multiple time zones/cost-of-living geos).
Conversely, if margins and value are essentially the same, you likely can save budget by consolidating with a multi-asset group PMax campaign (you can have up to 100 asset groups).
Industry View on CPCs, CPAs, ROAS, Spend & What You Can Do About It
Last year at the Global Search Awards, I had a great conversation with Amanda Farley about her suspicion that CPCs were being jacked up by human error and panic. We both agreed that the volatility in the economy and the fluctuations on the SEO side were causing erratic spending. Yet without data, we couldn’t quite put our finger on it.
Here’s a look at 2023 main metrics for the major verticals in the Optmyzr customer base. A few notes about the data:
This data is based on 6758 accounts globally.
We are including the Median change as opposed to the hard numbers. This is because accounts have a number of different factors and getting caught up in a specific number isn’t as useful as finding the profitable number for you.
Metrics
Vertical Breakdown
We looked at 6,758 accounts worldwide and compared their average and median performance difference between 2022 and 2023.
Core Findings for Cost
Spending being up across the board could have been a bad thing. However, as the ROAS and CPA graphs show, many industries have seen greater success in 2023 than in 2022.
There were a number of big SEO updates in 2023, so there is a certain degree of mitigation spend vs success spend.
The big spike in the Pet vertical is in large part due to budgets being smaller.
Core Findings for CPC
PMax plays a large role in the reduced CPCs. Given that visual placements have cheaper auctions and are a big factor in PMax campaigns, it makes sense that CPCs would trend down.
Verticals that saw spikes in CPCs (home services, law, pet, real estate, and travel) represent ties to other ad types (Local Service Ads and Hotel Ads). While those spends aren’t factored in the study, it’s worth noting that those ad types have gained much stronger adoption as CPCs rise.
We found that accounts using portfolio bidding with bid caps (either through the ad platform or using Optmyzr budget pacing tools) can help set protections in place while still leveraging smart bidding.
Core Findings for CPA
Legal is the big loser here and there are a few reasons for this: inability to leverage automation/AI due to brand restrictions, choosing ego bidding over cost-effective cost per case, and greater adoption of offline conversions factoring in the volatility of legal leads.
The fairly flat or decrease in CPA in other verticals speaks to consumer confidence, as well as a rise in micro-conversions. Accounts by in large do not use the conversion exclusion tool, which means the influx of Google-created conversions from GA4 might be a factor here.
Auto and real estate having such strong performance are tied to each other as more and more folks push for home ownership but might be forced to move outside their working cities.
Core Findings for ROAS
ROAS up or flat across the board could be taken as a stamp of approval for PMax or could be a sign that more folks are adopting ROAS bidding.
It’s worth noting that CPA decreases for the most part did not result in ROAS losses.
The general “frustration” in the market is likely from ecommerce. With CPAs up 10% and ROAS essentially flat, it speaks to consumer restraint as well as the emergence of TikTok Shops, Temu, Advantage+, and increased Amazon adoption.
Value Of Branded Campaigns
No. of accounts
CPC
CTR
Conv Rate
ROAS
CPA
Accounts that do not contain any branded campaign
9118
0.48
2.10%
7.24%
449.37%
6.65
Accounts that contain at least 1 branded campaign
10201
0.73
1.85%
7.97%
559.80%
9.15
Analysis/Thoughts
Here’s why we included the branded analysis with the vertical one: the impact on CPC and subsequent CPA/ROAS.
Branded campaigns have historically been heralded as an easy way to ramp up campaign performance. However, with the rise of PMax and the general flux in spend, the clear benefits and “best practice” level adoption are up in the air.
The ROAS and conversion rate gains aren’t that significant and all other metrics favor accounts that don’t run branded campaigns.
Based on the PMax adoption and the spend data I have two potential reasons for this:
Advertisers are jaded and have rolled branded spend into PMax and are treating PMax campaigns as branded/quasi remarketing campaigns. While I don’t think this is wise (especially given how search themes work and the ability to exclude branded), there’s no denying the level of cynicism that’s crept into the space.
Google has gotten smarter/better and no longer needs branded campaigns to understand an account has valuable campaigns.
Ultimately I still believe there is utility in a small-budget branded campaign because that way you can add it as a negative everywhere else.
Regarding the Vertical Spend Data
It is genuinely surprising to see every vertical spending more (regardless of performance gains or losses). This speaks to scares from the SEO side of the house and folks feeling like they need to make up the volume through paid. While we did hear some sentiment around fears in rising CPAs and CPCs, it’s worth noting Optmyzr customers for the most part saw cheaper CPAs and greater ROAS (with legal being a major exception).
We investigated how many ads per ad group each vertical had and were not terribly surprised all but Auto had a median of 1 (Auto has 2). This speaks to the trust among most advertisers (53%) to follow Google’s advice on the number of assets.
Many advertisers focus on Google first, regardless of whether that channel will serve them well. If you’re going to advertise on Google you need to make sure you can fit enough clicks in your day to get enough conversions for the campaign to make sense.
One of the reasons Optmyzr builds beyond Google is we see the importance of harnessing social and other search channels. Don’t feel trapped by habit.
That said, despite upticks in spend, there are clearly winning verticals, and all verticals came in flat or up on ROAS.
The Time for Automation Is Now
There has never been a better time to embrace automation layering in PPC. Having the ability to put safety precautions on bids as well as the importance of honoring what tasks will yield the highest ROI on time is mission critical.
Whether you’re an Optmyzr customer or not, you should be empowered to own your data and your creative. PMax is a staple campaign type at this point and fighting it is just going to leave you behind. However, not every task needs to be done and ultimately budget should determine how much you segment.
Keywords may be dancing between relevance and history, but until the ad networks retire them, it is important to know that Exact Match is where performance is and Broad Match is where testing lies.
After the Display vs Discovery Ads challenge, we decided to run a new test in the last part of 2023 to compare Demand Gen campaigns’ performance to that of “regular” Display campaigns. As in the previous experiment, we set the same budget for about 30 days, using the same content & targeting options. Here’s what happened.
This time we promoted ADworld Experience video-recording sales. As some of you may already know, ADworld Experience is the EU’s largest all-PPC event. Its main target audience is seasoned PPC professionals, who work with Google Ads, Meta Ads, Linkedin, Microsoft, Amazon, TikTok, and other minor online advertising platforms.
During the previous test, we found that experienced PPC professionals could be effectively targeted using an expressed interest in any advanced PPC tool. So we selected the most renowned ones excluding those not directly related to the main platforms.
Here are the brands we targeted in alphabetical order: adalysis, adespresso, adroll, adstage, adthena, adzooma, channable, clickcease, clickguard, clixtell, datafeedwatch, feedoptimise, feedspark, fraudblocker, godatafeed, opteo, optmyzr, outbrain, ppcprotect, producthero, qwaya, revealbot, spyfu, squared and taboola.
Using this list we were able to set up 3 different audiences based on:
PPC professionals who searched for a PPC tool brand in the past on Google;
PPC professionals who are interested in a PPC tool;
Users who have shown interest in PPC tool website URLs in SERPs.
Then we created a Demand Gen campaign and a regular Display campaign, with 3 ad groups each, based on one of the above audiences. The key settings were:
In both campaigns we limited demographics to users aged 25 to 55 (the main age range of adwexp participants) + unknown (not to limit too much the audience) and in Display campaigns we excluded optimized targeting (to avoid unwanted overlapping).
The goals were: past edition video-recording sales and navigating 5 or more pages in one session (to grant Google’s smart bidding enough conversion data to work on).
Geotargeting was limited to the home countries of the majority of ADworld Experience past participants (a selection of EU countries + UK, Switzerland, Norway, and Finland). We targeted all languages used in these countries and scheduled ads to appear every day from 8:00CET to 20:00CET.
In Demand Gen we had to accept Google’s default filter for moderate and highly sensible content. In Display, we excluded all non-classified content, fit for families (= mainly videos for kids on YouTube), all sensible content, and parked domains.
The bidding strategy was set for both campaigns on Maximize Conversions, not setting (at least initially) any target CPA.
Text and images were almost exactly the same, even if placements were different (GDN for Display and YouTube, Gmail and Discover newsfeed for Demand Gen). We were forced to shorten some headings in display campaigns, but descriptions and images (mainly 2023 speakers’ photos) were exactly the same. In the Display campaign, we were able to select also some videos and left auto-optimized ad formats on.
Regular Display Ad Examples
Demand Gen Ad Examples
Once we started the experiment, in the Display campaign we were soon forced to set different target CPA to grant all different groups/audiences a more uniform distribution of traffic, lowering it where it spiked and increasing it where it languished. In Demand Gen, we had to pause 2 out of 3 groups to give all of them a minimum threshold of traffic to count on (“Searchers of PPC Tools” adgroup in Demand Gen did 0 impressions for almost 20 days, until that).
In the Display campaign, we excluded all unrelated app categories (all except business/productivity ones) and low-quality placements spotted in the previous test, starting with almost 500 exclusions.
The Results
Here are the numbers we had about 5 weeks and 1.200€ spent after.
Regular Display Campaigns
Demand Gen Ads
If we look at global conversion numbers Google seems to have worked very well with Demand Gen. These AI-powered campaigns clearly outperformed both a professionally set Display campaign with the same content/setting and the old Discovery Ads we used in the previous test to promote the 2023 event registration (if we do not consider last week results, that were comparable).
Audiences performed in a fairly homogeneously way in Display, while there was a clear winner in Demand Gen, with the audience built on PPC Tools’ URLs, which Google was very fast to spot just 1 week after the kickoff, while Discovery’s latency on our previous test has been 3 weeks long. The only negative aspect of DGen traffic is the lower percentage of engaged sessions in GA4 (session longer than 10 seconds or with a conversion event or at least 2 pageviews/screenviews). It seems that GDN can still bring to your website more in-target users.
Almost all Demand Gen placements were on YouTube (both the converting ones and the rest), making me say that probably would have been better to compare this campaign with a Video Campaign, more than to a GDN one. The Display campaigns were totally on the other side of the channel, with very few placements alongside videos (& with incredibly high CPCs in some rare, but remarkable cases) and the large majority of impressions & clicks made on regular AdSense network sites.
I was also surprised to see that this time audience performances were comparable in both campaigns, while in the Discovery vs Display test “PPC Tool past searchers” achieved the best Conversion Rates in GDN. To explain that I can only suppose that this was due to the difference in the set goals. Joining an advanced event live is probably more attractive for a PPC pro than looking at its videos afterward. The most laser-targeted audience of someone who has recently searched for a valuable keyword should probably still be the best option in Display, while it is too narrow for DGen.
Final Takeaways
My final takeaway is that if your goal is not only to convert but to drive low-cost (but still well-targeted) traffic to your site with a set-and-forget campaign, then Demand Gen Ads are your must-go.
While, if you have a low budget but want to get results at an acceptable cost and have time and know how to optimize settings, then old-style Display campaigns may still be a good option. In both cases, tests with different audiences & assets are vital if you do not want to throw your money in Google’s vacuum!
If you are curious about specific aspects of the test, reach out to me, and we’ll be happy to drill down the data for you. Now it’s your turn. Did you do any comparison between Demand Gen and regular GDN campaigns? What are your findings?
In the ever-evolving world of paid search advertising, understanding the intricacies of platforms like Google and Microsoft is critical for campaign success. While these platforms are similar in many aspects, there are a range of distinct features that can significantly impact your advertising outcomes.
This article tells you what those differences are and how you can take advantage of them for maximum account performance.
Campaign Level Settings
At the campaign level, both Google and Microsoft provide a suite of settings designed to tailor your advertising efforts to your specific needs. Both allow for the following campaign-level settings:
Budget
Location
Ad schedule
Bidding strategies
Placements outside the “core” channel (search partners, display expansion, etc.)
Google
Google allows advertisers to set a daily budget of $20 for a local bakery looking to target customers within a 30-mile radius. This bakery can also schedule ads to run only during business hours, ensuring the ads are seen by potential customers when the bakery is open. The Google advertiser could include image assets to enhance their search with display select campaigns and would need to make that choice at the campaign level.
Microsoft
Conversely, Microsoft takes it a step further by allowing ad scheduling and location targeting at the ad group level. This means our local bakery could create one ad group targeting morning commuters with breakfast offerings from 6-9 AM and another targeting the lunch crowd from 11 AM-2 PM, each within specific areas known for high commuter traffic. While Google advertisers could do this, they’d need a campaign per schedule. Additionally, they’d be able to pick and choose which ad groups get added to search partners including Duck Duck Go and Baidu.
Keywords and Negatives
The approach to keywords in Google and Microsoft can make or break a campaign. Targeting keywords helps advertisers reach prospective customers, while negative keywords block wasteful/irrelevant traffic.
Google
Three distinct targeting match types (broad, phrase, and exact), and three distinct negative match types exist. Targeting keywords allow for close variants, while negative keywords do not. As a reminder, broad match negative means the words as they are spelled can be anywhere in the query to block traffic.
Microsoft
Three distinct targeting keywords, but only phrase and exact match negatives exist. I personally tend to just include phrase match negatives for single words I want to exclude so I can use the same lists for both networks.
Bidding
The bidding strategies offered by Google and Microsoft are critical for managing how your budget is spent and how your ads are positioned.
Google
Smart bidding can be turned on at any conversion threshold (though it’s not recommended under 30-50 conversions in a 30-day period), devices can be completely excluded, and portfolio bidding with bid caps. Google allows for impression share and max clicks bidding to help advertisers ramp up while they wait for conversions.
Microsoft
For the most part, things are the same in Microsoft. However, the minimum bid is $0.05, Smart Bidding is still “Target ___”, and no turning on Smart Bidding till you have at least 15 conversions. Note that Microsoft still supports Smart Shopping (though portfolio bids are not compatible with it).
Audience Targeting
Effective audience targeting is essential for reaching potential customers who are most likely to convert.
Google
First-party lists must have at least 1000 people and at least one new person added every week. There should be a minimum spend of $50K and at least 90 days of data to use. Additionally, Google serves ads in the time zone of the account. And YouTube audiences (who interacted with your video/channel) can be leveraged for targeting or observation.
Microsoft
While Microsoft requires 1000 people in the first-party lists, it does not require the same spend. Audiences can include LinkedIn data (company/job title). Note that Microsoft serves ads in the time zone of the user.
Performance Max Campaigns
Performance Max campaigns offer a holistic approach to PPC, blending various ad formats and platforms.
Google
The originator of the campaign type. This campaign type covers text, image, and video ads across search, shopping, display, YouTube, discover, Gmail, and local ads (not to be confused with local service ads). They can have up to 100 asset groups and 25 search themes per asset group.
Microsoft
Almost every mechanic is the same save for requiring a video component. This is because the Audience Network (which includes Duck Duck Go and Baidu) is image and text-heavy. Additionally (as of this post’s publication date), Microsoft does not have search themes.
In sum, while Google and Microsoft share foundational similarities in their PPC offerings, the nuanced differences between them can greatly influence the effectiveness of your advertising efforts. By delving into specific settings and examples, as we’ve done here, you can gain a deeper understanding of how to navigate and take advantage of these nuances, crafting campaigns that are not only more targeted and relevant but also more cost-efficient and successful.
At Optmyzr, our goal is to empower advertisers to fully harness the capabilities of both platforms, ensuring that your PPC campaigns are primed for success in the dynamic digital advertising landscape. By embracing the unique features and opportunities presented by Google and Microsoft, you can achieve unparalleled results, driving growth and maximizing ROI in your digital marketing endeavors.
Not advertising on Microsoft yet? Take advantage of the auto-import functionality and account creation within Optmyzr.
Thousands of advertisers — from small agencies to big brands — worldwide use Optmyzr to manage over $5 billion in ad spend every year. Plus, if you want to know how Optmyzr’s various features help you in detail, talk to one of our experts today for a consultation call.
Increased automation and limited targeting will bring about a shift in the way we see our role as advertisers and how we plan our campaigns in 2024. Not only will we play a more strategic part rather than an executional one, but we will also have to rely less on targeting in the process.
Gone are the days when you spent hours refining your audience targeting to perfection. Now is the time to embrace broad targeting and face the cookieless future heads-on. How do you do that? Go back to basics and put the creative at the center of all that you do.
Get actionable PPC tips, strategies, and tactics from industry experts twice a month.
This change in mindset and priorities will influence your work on various levels, from PPC strategy and planning to data analysis and testing.
A creative-first approach means paying more attention to how an ad looks and performs and collecting data that will inform your future decisions. For example, the statistics may tell you which display ad design types are the most popular.
To illustrate different approaches to making your creative stand out, I would like to offer an example from my own professional experience and see what we can learn from it.
Context
Me and my colleagues at Creatopy organize webinars periodically, in which we invite industry experts to share their valuable insights on current and complex advertising topics. This is not only to help our participants deepen their understanding of said subjects but also to show them actionable tips that they can apply to their ad campaigns.
It is part of my job to promote the webinars and make sure they reach the right audience and bring as many registrations as possible. The campaign that I want to talk about is the one I ran for the webinar on How to create zero-click ads that convert with Jonathan Bland, its landing page is shown below.
**Source**: Creatopy
Ad creatives
For this particular campaign, I decided to take a more out-of-the-box approach based on recent trends and test designs that look decidedly different from the ads we usually run alongside some of our more tried-and-true types of creatives.
So I used seven ad creatives in total, three of which were more conventional, and the other four less conventional.
**Source**: Creatopy
As you can see in the image above, what I mean by ‘conventional’ is the fact that all three ads represent the classic way of promoting a webinar. They convey the ‘what’ and ‘who’, as in the topic of the webinar, and the name of the speaker, whose face is also featured in the visuals. The phrase ‘free webinar’ also appears on all three ad designs.
The second set of ads is unconventional in the sense that they don’t make it clear from the start that you are seeing an ad that promotes a webinar.
**Source**: Creatopy
First of all, none of them contains the word ‘webinar’. And secondly, the face of the speaker is shown only in one of the visuals, the first ad design seen in the image above. The ad looks like a Twitter thread, so the speaker’s face appears just as part of his Twitter profile and does not present him in direct correlation with the webinar as seen in the conventional ad designs set.
It’s clear that these four ad designs don’t make any reference to the main elements that the first three do—the words ‘free webinar’, the face and name of the speaker—which are key details to mention, you would think, if you want people to register for your webinar through an ad.
Campaign stats and results
All seven ads ran on Instagram, and the data presented here is for the first 19 days of running the webinar, from December 14, 2022, to January 2, 2023. We spent $1,032.52 during this period of time and managed to bring 42 registrations to the webinar, at a cost/registration of $24.58.
All the ad creatives targeted the same:
Nine locations: Australia, Canada, Germany, Denmark, Finland, the U.K., the Netherlands, Norway, New Zealand, Sweden, and the U.S.
Age group: 25-55 years
Audience: advertisers, based on a mix of interests, behaviors, and job titles
Language: English
Device: Mobile
Landing page
Description: “Find out in our webinar how to optimize your ad for the 99% of people who are not clicking on your ad.“
CTA button: “Learn more“
The only variable here was the creative.
This is the first webinar where we also tested ads that don’t necessarily look like ads, the aforementioned second set of creatives. We wanted to increase interest through the creative. To see the impact the creative has over the results, if any. And the results were interesting, to say the least.
The more conventional type of ads brought 30.9% out of the total registrations to the webinar, while the unconventional ones brought the rest of 69.1%. What’s more, the ad design with the highest percentage of registrations by far, namely 42.9%, is part of the unconventional set. It amassed double the percentage of registrations compared to the creative that came in second place, an ad from the conventional set (21.4%). Close on their heels is another unconventional ad, with 19% of registrations.
In the table below you can see more in-depth data about each ad creative, such as CTRs, reach, number of users who landed on the page, cost/landing page view, number of registrations to the webinar, cost/registration, registration rate (registrations divided by users, multiplied by 100), and cost.
**Source**: Creatopy
This data can provide us with a better understanding of the true winners of this experiment.
The ads that the algorithm pushed in front of the users and which spent more budget in total are indeed in our top three in terms of webinar registrations, while also having the lowest costs/registration.
CTR-wise, the top three are entirely made up of unconventional ads, the sixth creative occupying the first place with a CTR of 0.64%, followed very closely by the fifth and fourth ads, with CTRs of 0.61% and 0.60%, respectively. Coming in fourth is Ad Creative 1, part of team Conventional, with a CTR of 0.44%. We notice a higher click-through rate on the more out-of-the-box ads, showing us that they are more appealing to the users and more powerful in arousing their interest and curiosity.
Also, interestingly enough, if we look beyond the number of users brought to the webinar, things look a little bit different. By registration rate standards, which are obtained by dividing the number of registrations by the number of users who landed on the page, the winner is the first ad, which is more conventional. This ad also takes the prize when it comes to cost/registration, which is the lowest out of all seven ads.
Why did this happen? Simply put, the first ad creative is the most similar to the landing page from a visual standpoint. All ad creatives are designed with the landing page in mind, but it would have been difficult to test these seven different ad designs and have them all incorporated into the same landing page.
So what are the learnings?
The results show us that the tried-and-tested way of doing things can still bring good results. But to win in advertising, we must venture on the experimental path as well.
1. A continuous testing mentality
I wouldn’t advise giving up your usual way of doing things altogether, since we saw that the more conventional type of ads still moves the needle. But in order to bring the best results for your clients, you have to take both methods into account. You must be willing to test more often and test different approaches, even those that you initially thought wouldn’t stand a chance.
You will be surprised to find that, oftentimes, what we think will fail is what the audience ends up connecting with, which is more important when all is said and done. And it is this habit of continuously testing—even when things are going well—that will bring you the most rewards in the long run.
2. A personalized approach to ad creatives
I highly believe that in 2024 the ad creative will be the “new targeting”. For a campaign to achieve success this year, ad creatives will have to be more relevant to the audience than ever. In our case, the audience for the webinar is made up of advertisers, as I previously stated. This audience is primarily interested in how to create ads that convert since this is the way advertisers measure and present the success of their work to their clients.
On this note, we can see that all the top three ad creatives (1, 4, and 5) in terms of users brought to the webinar and cost/registration talk about ads that convert. Only these three ads contain the word ‘convert’, which I think is no coincidence at all. The message is both catchy and tailored to the needs of the target audience.
3. Beyond the creative is the landing page
Another learning we must take with us in 2024 is that landing pages and ad creatives must match as much as possible. The ad creative does the first part of the job, that of attracting the target audience, but the landing page is the one that can either make or break the deal. Without the ad creative, a perfect landing page wouldn’t amount to much by itself, but together they are a very powerful duo.
They must go hand in hand so the users can experience a steady flow from the ad creative to the landing page since they unconsciously expect to find the same elements on both of them. Otherwise, the chances are high that the flow is disrupted, and the user gets confused, and is driven away from our page.
To prove my point, the first phrase on our landing page mentions creating ads that convert, which happens to be present in all three of our best-performing ads as well.
Whether conventional or not, the ads that took the top three places used a message that was of high relevance and interest to the target audience, and at the same time strongly connected with the message found on the landing page. Moreover, the ad creative with the lowest cost/registration is the one that reflects the landing page the most, offering a seamless experience for the users clicking on it.
Over to you
To wrap things up, I hope I have provided some food for thought on how to better incorporate and prioritize the ad creative in your PPC strategy this year. Now all that’s left to do is to put them to the test and see what works best for your particular campaign needs. And don’t forget to keep on experimenting.
Get actionable PPC tips, strategies, and tactics from industry experts to your inbox once a month.
In this article, we’ll explore the many areas to consider and explore when evaluating Google Ads Performance Max (i.e. PMax) campaigns.
Given the current limitations of insights we can pull from these campaigns, it can be difficult to understand the causes of performance fluctuations. This guide is here to make accomplishing that task easier than ever.
First Principles: Getting Familiar With The Context Of Our Data
Does it usually take 7 days before all conversion metrics are reported? Does it usually take 11 days until a customer completes a purchase after their first interaction with your ads?
In either case, if it’s only been a few days since your last major change to the campaign, it might be best to wait several more days before rushing to any major conclusions about performance.
Try to have as much of a complete picture of conversion metrics and the typical buying journey of your customers as you can before judging the outcome of your recent changes too harshly.
One quick way to check your recent average conversion reporting delay is by navigating to the Campaigns section of your account and changing the date range to Today, then hovering your mouse over the Conversions metric in the Account row.
This helps you understand, on a high-level, how long it takes customers who see and click your ad to complete a particular conversion action. Conversions can be reported up to 90 days after the click, depending on the conversion window you’ve chosen for that particular conversion action.
Pro Tip: If you’d ever like to see the conversions that actually occurred on a given date, use the “Conversions (by conv. time)” metrics. Do note, however, that conversion by time data is only available after March 6, 2019.
Now take an account-level look at the average days to conversion for the conversion action you’re analyzing by navigating to the Attribution > Path metrics section of your account. You’ll find this section under “Tools and settings” (top-right of page) > Measurement > Attribution.
Then click “Path metrics” on the left-side of the page. Once there, change the “Conversion action” filter as needed, choose an appropriate attribution Lookback window, choose a conversion window to analyze by changing the date range, then change the “Measure from last interaction” to “Measure from first interaction.”
Note the difference between Lookback window and Conversion window, per Google:
To see this in more detail and view the average days to conversion for the PMax campaign you’re investigating, add the Conversions > Days to Conversion segment to your Campaigns data table.
Usual Suspects (Non-PMax Specific): Most Common Indirect Causes Of Performance Fluctuation
Okay, so we’ve identified that we are indeed justified in our freakout. What now?
Let’s first investigate the “usual suspects” of major changes to PMax performance.
Conversion Tracking
Have there been any changes that may have affected conversion tracking?
For example, has there been any changes to the source code of your site or Google Tag Manager, or are there any error messages showing in the Conversions section of Google Ads, the Diagnostics section of any of your Primary conversion actions in Google Ads, the Overview section of your Google Ads account, or the Google Ads Tag or Google Analytics sections of your Google Ads account within the Your Data Sources area of Audience Manager?
Budget, Bidding, Asset Group, & Listing Group Changes
Have there been any changes to the campaigns budget, bidding, or Asset Groups since performance improved or worsened?
Changes to any of these three can have major impacts on performance - especially relatively large budget increases or decreases, bid strategy type changes, enabling or disabling of Asset Groups, or Listing Group product additions or exclusions.
Google Merchant Center Issues or Major Product Feed Changes
Check the Diagnostics section of your Google Merchant Center account for any recent disapprovals or warnings. Also, check the bell icon on the top-right of your Google Merchant Center account to see if there are any other notifications of issues that may be impacting the performance of your Shopping ads.
If you’re utilizing a Content API setup within your Google Merchant Center, don’t forget to check the Diagnostics report within the Content API section of your Google Merchant Center account as well. Are there major or consistent failed API calls occurring that may be impacting your Shopping ads?
Have there been any changes to your product feed that may have affected performance? If Supplemental Feeds are in use, are they still in sync and up-to-date with your primary product feed?
Site Changes
Have there been any changes to your site such as site navigation, checkout flows, CMS plugins, web hosting, or product pages?
Even seemingly minor changes to the site can cause major, unexpected negative consequences to the performance of your PMax campaigns.
Make sure you remain “in the loop” of any changes that occur to the site so you can closely monitor their potential impacts on performance - especially any changes that might impact conversion tracking or the product pages of best sellers.
Any recent changes to products going in or out of stock on your site, especially for any best sellers? Any recent changes to product pricing or promotions, customer shipping costs or free shipping offer thresholds?
Any extremely negative reviews showing on the site, or elsewhere for your products (e.g. on Amazon, on high-traffic volume review sites)?
Google Search Console
If you use Google Search Console, are all pages on your site that you want Google to crawl indexed with Google Search Console? Are there any important URLs that are now showing as “Failing” in the Core Web Vitals section of your Google Search Console account?
Market
Evaluate changes in the search behavior for your products by reviewing, if available, the Search Terms and Search Trend Insight data in the Insights section of your Performance Max campaign and your Google Ads account as a whole.
Pay particular attention to high search volume Search Categories and search terms that have incurred large positive or negative shifts in metrics like impressions and conversions.
Outside of high search volume terms, are you seeing major shifts in the performance of other terms you’ve deemed are important, such as branded, competitor, top-of-funnel, or commercial-intent-oriented searches?
Note that Search Trend Insight data is not available for all advertisers, or these insights may not be very relevant to the products you’re offering, but do check-in periodically to see if new insights emerge.
Google will, at times, provide a notification to new insights such as these in the “Notifications” feature of your account - found by clicking the bell icon in the top-right corner of your Google Ads account.
Similarly, check Google’s built-in Keyword Planner tool and Google Trends for any outliers in interest over time for high search volume or high conversion volume search terms.
When using Google Trends, try different search terms, topics, categories (e.g. Web search, Shopping, YouTube), and date ranges to uncover potential insights into changes in search behavior.
Have people recently changed or started to change the way they’re searching for the products you offer? Are there new major competitors who’ve recently entered the market?
Is there seasonality at play or global dynamics that may be affecting the buying behavior of your products or consumer spending in general that is apparent through this analysis?
Other areas to check, depending on if these features are available to you, are the Site Search > Search Terms section of your Google Analytics account and the Best Sellers section of your Google Merchant Center account.
Are there any outliers in how people use the search feature on your site? If applicable, are you seeing similar changes in search behavior in your Microsoft Ads account? Have any of your top selling products changed in popularity rank recently?
Note that the popularity rank is the popularity of the item on Shopping ads and free listings, in the selected category and country, based on the estimated number of units sold.
Have your competitors started getting more or less aggressive in their bidding? Check the Auction Insights section of your PMax campaign to investigate. Don’t forget to check both the Search and Shopping filter of this section.
Other Marketing
Google Ads doesn’t work in a vacuum. Have you recently pulled spend away or dramatically increased spend or marketing efforts towards another marketing channel that may have caused a ripple effect to Google Ads performance?
Common examples include changes to social media marketing, email or SMS marketing, affiliate and referral marketing, or third-party remarketing channels.
Check for metric fluctuation outliers in your Google Analytics Source/Medium report or your third-party attribution software, if you have one, for more detailed performance insights.
Don’t forget to analyze the Shopping Behavior and Product Performance section of your Google Analytics account as well to locate any performance fluctuation outliers.
Non-PMax Campaigns
Have you added, paused, or made any major changes to any other non-PMax campaigns in the account?
Performance Max campaigns tend to be sensitive to and affected by relatively major changes to other active Google Ads campaigns, such as, but not limited to, Display, YouTube, Discovery, and Search campaigns using Dynamic Search Ads.
Diving Deeper (PMax Specific): Performance Fluctuations Directly Correlated To Performance Max Campaigns
Now that we’ve investigated the usual suspects found outside of PMax, let’s dive deeper into the PMax campaign in question to see if there are more causation insights we can uncover.
Google Bidding & Targeting Algorithm Shifts
Has Google started showing your ads more or less on the Shopping ads network? Build a custom report to find out using the “MC ID” dimension. This is the ID of the Google Merchant Center account associated with the products being advertised.
Note: Expect impression metrics in campaign data tables in the Campaigns section of your account to be lower than the number of impressions shown for an associated MC-ID.
Per Google: “When an ad shows many products in an individual ad slot, each product collects an impression. However, the campaign, Asset Group, and ad recognize that only a single ad was showing and will count it as one impression.”
Get a glimpse of recent optimizations made by Google’s automated bidding strategy by reviewing the Top Bidding Signals report in the Overview tab of your campaign.
Investigate the landing pages Google has been sending Performance Max ad clicks to by building a custom report using the Landing Page dimension:
Note: This report is especially important to check if Final URL Expansion is enabled for a given PMax campaign.
Additionally, in many cases, you’ll want to download this data so you can, at a minimum, run the data through pivot tables to find categorical patterns, such as the performance of blog pages vs product pages, different product categories, best sellers vs other products, home page vs product pages, etc.
Performance Metric Outliers
First, if the Performance Max campaign has reliable historical data, familiarize yourself with what “normal” performance fluctuation looks like for it. This will help stifle recency bias.
Look for metric outliers when comparing pre and post major increases or decreases in performance.
Pay special attention to diagnostic and micro-volume metrics like Avg. CPC, CTR, Impr., Conv. rate, Value / conv., Views, Avg. CPM, as well as other major performance indicators like sales-based Conversions and Conv. Value / cost or Cost / Conv.
Open the Products section of the campaign and look for any outliers in Product-specific performance outliers pre and post major drops in performance.
Look at product-specific metrics as a whole for the campaign as well as by Asset Group by adding the Asset Group table filter.
Pay particular attention to differences in high vs low Value/conv. and high vs low priced products, products with a relatively high number of impressions and relatively high CTRs vs relatively high Conv. rate products with statistically significant click data historically, and best seller impressions vs others product impressions.
Is Google now predominantly pushing lower or higher Value/conv. products? Is Google now predominantly pushing products with high CTRs but not products with high conversion rates?
Is Google now favoring to show products that aren’t your bestsellers or products you need to push?
It’s important to note that the Conversion metrics found in this Products section represent products in your product catalog that were clicked and led to the sale of some product of yours, they do not necessarily represent the number of sales of that product after an ad click.
Make sure you compare the product sale metrics you see here with what you find in the Product Performance section of your Google Analytics account with an audience filter that just shows traffic from Performance Max.
To investigate performance change outliers for Listing Groups (performance of product attributes as assigned in Merchant Center and as segmented within an Asset Group), perform the same analysis to the Listing Groups section of your PMax campaign as you did in the Products section.
Note that you will be limited in your ability to analyze comparison metrics in this section because, at the time of this writing (November 2022), comparison values are not available in the Listing Groups section of Performance Max campaigns.
Lastly, check whether there has been a change in approval status to any assets within your Asset Groups or Ad Extensions, such as Eligible (Limited) or Disapproved.
Situation-Dependent Causes Of Performance Fluctuation
It’s important to mention that there will be special case scenarios to consider when evaluating why Performance Max improved or worsened in performance that will only be relevant for some accounts.
I’ve listed many of the most common of those below.
Major promotions occurred on the site, but Seasonality Adjustments were not added to campaigns promoting those applicable products in the account.
Data Exclusions were not applied or were applied incorrectly for times when conversion tracking was down.
Other users made changes to the account unbeknownst to the primary person managing the account. It’s not uncommon to see a well-intentioned developer, for example, make a change to some conversion action settings in the Conversions section of the account without first informing the primary account manager.
Google’s Auto-Apply Recommendations feature made changes to the account unbeknownst to the primary person managing the account.
Customer Match lists were added, edited, or removed from the account.
Previously “Best” rated assets within a high-volume or high-performing Asset Group are now rated “Low.”
High-volume or high performing Search Categories or terms shifted from serving predominantly from a high-volume or high-performing Asset Group to a low-volume or low-performing Asset Group.
Major shifts in the performance of high-volume or high-performing search terms in non-PMax campaigns.
Edits were made to a Business Feed in the account that affected the non-PMax campaigns that were using them.
Errors or edits to a CRM integration with Google Ads, like Salesforce, occurred.
Negative keywords were added to the PMax campaign per the request of a user other than, and without the knowledge of, the primary account manager.
Negative keywords were improperly added to a negative keyword list that has been applied to a Performance Max campaign by a Google rep.
YouTube ad placements were opted out of by Google per the request of a user other than, and without the knowledge of, the primary account manager.
Mobile app placements not owned and operated by Google incurred sharp increases or decreases in impressions per the “Performance Max campaign placements” report.
Mobile app category exclusions were applied at the account level.
Location or Ad Schedule exclusions were added or removed in a PMax campaign.
Auto-generated YouTube videos were added to the campaign by Google due to no video assets being present within an enabled Asset Group.
What’s Next?
Warning: Don’t Make Too Many Corrective Changes At Once
Once you’ve identified areas of opportunity for corrective action or scale, don’t make too many potentially high-impact changes at once, such as changing the bid strategy type AND excluding some high-volume products from your PMax campaign.
With the limited insights we can already gather from this campaign type, the last thing you’ll want to have is a situation where you don’t know which major change you made was the cause of greatly improved or greatly worsened performance.
Where to go from here depends highly on what you found in your analysis and on many other factors that will vary dramatically from business to business, such as, but not limited to, aversion to experimental risk, available ad spend budget, profitability thresholds, goals of the business, and internal resources for account management.
This is where Google Ads is most tricky and often where businesses will turn to PPC professionals for assistance in correcting ad spend inefficiencies or scaling success in a way that is uniquely tailored to the needs and available data of the business.
Performance Max is an ever-changing new-ish product offering from Google Ads, so expect some technical areas of this guide to possibly become quickly outdated.
However, there are also many high-level data analysis principles baked in that I don’t see changing much anytime soon.
While this guide doesn’t cover every possible situation or reason for performance changes in your Performance Max campaigns, my hope is that it will be a solid starting point for most.
I’m also sharing a checklist below to help you get started quickly.
You don’t have to go through every single one of these points. Just go over the ones that are relevant to your business.
I also discussed some of these points on PPC Town Hall with Frederick Vallaeys and Mike Rhodes. You can watch the full video here:
Get actionable PPC tips, strategies, and tactics from industry experts twice a month.
Performance Max 44-point evaluation checklist for ecommerce businesses
Investigate…
Estimated conversion reporting delay.
Average days to conversion from first ad interaction (account-wide and campaign-specific).
Conversion tracking and recent changes to conversion actions.
What “normal” PMax performance fluctuation looks like for the account (if appl.)
Recent changes to budget, bid strategy type, Asset Groups, and Listing Groups
Google Merchant Center product disapprovals and warnings, account issues, and feed issues.
Changes to the site (e.g. navigation/checkout, plugins, hosting, page designs)
Changes to in-stock products, especially best sellers.
Changes to pricing, customer shipping costs, and promotions listed or previously listed on the site.
Extremely negative reviews on and off the site
Google Search Console for “Failing” URLs
Changes in relevant search and buying behavior via the Insights section of your PMax campaign and your account as a whole, Google’s Keyword Planner, Google Trends, your site’s search feature (if appl.), Best Sellers section of Google Merchant Center (if appl.), and Microsoft Ads (if appl.).
New competitors in the market or competitors who are changing their level of competitiveness within ad auctions you compete in.
Major changes in other marketing and site traffic channels outside of Google and Microsoft Ads (e.g. Facebook Ads, email automation, affiliates, third-party remarketing channels)
Major changes in on-site shopping behavior (e.g. cart abandonment, check-out abandonment, sessions with transactions)
Shifts in Shopping network-specific performance for PMax.
Top Bidding Signals report for optimization changes recently made by automated bidding.
Performance shifts of landing pages PMax ad clicks are being sent to.
Major changes made to non-PMax campaigns that may have impacted the performance of PMax.
Major shifts in the performance of high-volume or high-performing search terms, geographies, devices, days, days of the week, hours, audiences, match types, or campaign types in non-PMax campaigns.
Performance metric outliers for the campaign pre and post-major increases or decreases in performance.
Performance metric outliers for the products advertised in the campaign - at the campaign-level and Asset Group-level.
Performance metric outliers for the Listing Groups in the campaign.
Asset Group assets or Ad Extensions with Eligible (Limited) or Disapproved status.
Seasonality Adjustments not being added for major promotions, or for other major expected spikes or dips in conversion rates.
Improperly added Data Exclusions, or for instances where Data Exclusions should have been added but were not.
Scripts or Automated Rules that made changes to the account that may have had an impact on Performance Max.
Account changes by other users who are not the primary account manager.
Auto-applied recommendation changes made by Google.
Customer match list additions, removals, or edits.
Custom Experiments recently ended in the account.
Value rules or conversion value adjustments were added, edited, or removed.
“Best” rated assets inside top performing Asset Groups had a recent change in rating.
High-performing or high-volume search categories or terms shifted away from a high-performing or high-volume Asset Group.
Edits made to a Business Feed or Custom Variable that affected any non-PMax campaigns.
CRM integration issues.
Negative Keyword List was added to the PMax campaign being evaluated per the request of another user.
Negative keywords were improperly added to a Negative Keyword List that is applied to the PMax campaign being evaluated.
YouTube ads were opted out of by another user.
Mobile app placements not owned and operated by Google had major increases or decreases in impressions.
Mobile app category exclusions were applied at the account or campaign level.
Location or Ad Schedule exclusions were added or removed for the PMax campaign being evaluated.
Improperly setup Performance Max URL Exclusions.
Auto-generated YouTube videos were added by Google to the PMax campaign being evaluated.
Want to safeguard your Performance Max campaigns? Click here to learn how.
Get actionable PPC tips, strategies, and tactics from industry experts to your inbox once a month.
Performance Max is one of the biggest automated campaigns from Google in the last few years. It replaced Smart Shopping and Local campaigns in September 2022 making it very clear to us that Google has it as the top focus in its ad strategy and that more automation is on the way.
Whether we like it or not, this is the world we live in. So we have to start to work together with the machines because Google is making us and also it generally tends to provide better results.
Of course, you should never give up control of your Performance Max campaign and let automation take over. And this brings us to the concept of automation layering, which in simpler terms means adding a layer of your own automation over that of Google’s to safeguard your campaigns.
In this article, you’re going to learn how you can safeguard your Performance Max campaigns in the five following areas.
1. Account structure
2. Alerts
3. Budgets
4. Experiments
5. Placements
Let’s go into detail and learn how you can do that using Optmyzr’s tools.
1. Create the account structure that supports your business goals
When Google says “build a Performance Max campaign”, they don’t mean that you have to build just one. You can create multiple Performance Max campaigns and we recommend you do that.
For instance, you can create multiple campaigns based on margins, because margins also determine what your bidding target should be.
For high-margin products, you can afford to bid much higher and more aggressively and still make a profit. For low-margin products, on the other hand, you might want to have a different ROAS target.
Now, you could’ve also created a structure based on seasonality because you’d want to prioritize budgets at different times of the year.
By creating and maintaining multiple campaigns, you can change settings in response to promotions, seasonality, and other business factors.
And how can you do this in Optmyzr? You can build a dynamic Performance Max campaign (for retail) structure or a shopping campaign structure with Optmyzr’s Shopping Campaign Builder 2.0.
You can set up how your listing group structure has to look like. For example, say you want to use a custom attribute as your first level of division and one campaign for each different custom label.
This custom label could include your margin data—high margin, low margin, or mid margin. You can also add as much granularity to it as you want. And then as the second level of division, you can create separate asset groups by ‘brand’ which enables you to put in different messaging and creative for each brand that you sell.
And what comes out of it is a split with many campaigns and listing groups that allow you to quickly check what’s new in your product feed and automatically put new products into the correct structure on a daily basis.
P.S. We spoke to two of the best ecommerce experts, Andrew Lolk and Menachem Ani, on PPC Town Hall 71 to learn how to better structure your Performance Max campaigns.
Get actionable PPC tips, strategies, and tactics from industry experts twice a month.
2. Set guardrails with alerts
You can get alerts whenever your Performance Max campaign deviates from the expected performance.
In this example, you can see that we’re saying we’d like to get alerted if the CPC (cost per conversion) is going off target. And here we can see it has gone 135% off target and is currently trending down.
You can also build custom alerts using the Rule Engine.
Setting up alerts like the one above helps us clearly understand what is automation doing to our campaigns.
3. Optimize budget allocation
You can allocate and optimize budgets effectively and achieve the right level of spend for your campaign(s).
If you have multiple accounts associated with a client (say, five accounts on Google Ads, plus one Facebook and one Microsoft account), you can bring all of those together under one client.
And underneath that, you can create budget groups. For instance, you can create a budget group for all of your branded campaigns and non-branded campaigns, and assign different budgets to each of them. Then you can make sure that you don’t exceed the total allocated budget for any of these budget groups.
One of the things we’ve added is budget optimization capability in the Rule Engine. So if you want to build something really custom based on past performance and on your own business data, you can set up a Rule Engine strategy and optimize it automatically.
4. Experiment effectively to find winners faster
Here’s the truth: nobody in PPC knows exactly what the best strategy to win is. But the person who experiments the most effectively is going to win. The way you get to the right strategy is by iterating and experimenting faster and more effectively.
But the problem that we found with experiments is Google makes it really tedious to see how your experiments are doing, which stage they’re in, and so on. And you have to go to multiple accounts and pages within each account to check your experiments.
But Optmyzr can simplify that for you. We bring all of your experiments onto a single dashboard to quickly show you what experiments are working, which ones you can promote, and which ones you should terminate or maybe replace with a new experiment.
We’re going to add more capabilities in the future, but if you haven’t tested it out yet, go and take a look at it today.
5. Stop ads from showing on low-quality placements
You can use our Rule Engine to exclude placements at the account level.
And we also have a brand new tool for that called Smart Exclusion automation. This is an add-on tool. If you want to know more about it, just talk to your Optmyzr account rep.
This tool uses Optmyzr-wide data to prevent you from wasting money on say, some new, random mobile app that’s click-baiting people into clicking on your ads that are wasting a lot of ad spend but are not converting enough.
We can proactively place it in your account based on the Optmyzr-wide data that we see and prevent you from ever wasting money on that sort of clicks. And we’ll even give you a prediction of how much money you can save and then you can decide if you want to turn this feature on or not.
Take back control of your Performance Max campaigns
Performance Max is not 100% automated. You need to provide it with good data and value-focused optimization so that Google clearly understands what it is that your business really wants and what a ’conversion’ means to you.
Nobody understands your business better than you. So why let Google make decisions for you?
I spoke to 4 all-star PPCers to discuss different career journeys including the decision to head out on our own (for those who have started an agency or consultancy). After the call, Harry Makins on Twitter asked a follow-up question that got me thinking more about the difference between starting an agency in 2010 and now.
I think it’s easier and more difficult. If you’ll allow me to ponder on this, I’ll share my musings below and then perhaps we can continue the conversation on Twitter and LinkedIn.
Oh, and one other important thing. Because these are my musings, I might be wrong. So listen to what I have to say, weigh it to determine whether the logic makes sense, then let me know if you see something in the industry that suggests otherwise. I’d love to keep learning too, with your help.
Deal? Let’s get started.
3 Reasons Why Starting a Digital Marketing Agency in 2024 is HARDER Than Ever
Reason #1: The Digital Marketing Space is More Crowded Than Ever.
In 2011, the year I started ZATO, there were 4400 digital ad agencies in the US.
In 2022, there will be 19,800 digital ad agencies in the US. (source)
That doesn’t even include international agency growth that can service the US!
There are so. Many. Agencies out there right now.
Even in my small network, every time I turn around, another friend is announcing their intent to “go it alone” and try this freelancing thing.
So immediately, we recognize that it is harder out there simply because there are literally more agencies than there used to be.
Reason #2: Companies Are Aggressively In-housing Digital Marketing Services.
Another trend I’m seeing lately is the desire to eliminate vendor relationships and move paid media in-house. There are a number of reasons not to be discussed now for going in-house, or going agency with your media.
However, for the sake of this article, there are MORE agencies than ever, and yet MORE businesses are moving their ad buying in-house.
Seriously, while writing this post I ran across yet another DTC person (Patrick Coddou of Get Supply) announcing his move away from using agencies!
Reason #3: The Market Is More Mature & Also More Picky.
One thing I’m seeing personally is that people are savvier than they were a decade ago, and this works its way into many things.
Sales, for instance.
It used to be easier a decade ago to get into a Google Ads account, identify some immediate opportunities, and tell them to a befuddled marketing manager who said some variation of “okay, okay, what do you charge, you’re hired.”
I’ve found it’s not enough just to “know Google Ads better than the next guy” in order to land clients these days (and remember, there are just more agency options out there competing).
I’ve also found accounts we take over tend to be (on average) managed better than they were 5 years ago which makes improving them more challenging than the “glory days” when we could take over a new account in shambles and expect to see immediate results by adding in a few exact match keywords plus ads that actually land the user on the correct landing page (this is a general observation, rather than a prescribed rule, of course. There are still REALLY bad managers out there making bad accounts).
4 Reasons Why Starting a Digital Marketing Agency in 2024 is EASIER Than Ever
Okay, so we ran over some reasons why it’s harder than ever to start a new agency. Is there any good news? Actually, I think there is a lot of good news here!
Read on.
Reason #1: Online Businesses Are Booming.
It’s no secret (normal tech growth followed by a pandemic forcing ecommerce growth) that the newfangled-internet-thing continues to grow as an important part of any business.
Ecommerce sales made up only 5% of retail sales in 2011 (remember, back when the number of agencies was smaller), and in 2021 it has climbed to around 13%. So, while there are more agencies, there is more to manage for those agencies.
What is really mind-boggling to me, is the potential for continued growth here. In 2018 (admittedly, almost 5 years ago, but still) a whopping 46% of small businesses DID NOT EVEN HAVE A WEBSITE. Do you realize how much opportunity there still is in some of these niche markets?!
Reason #2: People Are More Willing to Hire True Experts.
I remember from conversations with prospects 5 years ago, that people wanted “an agency who does it all! We want one point of contact.”
Whereas, lately, our contacts have communicated to us: “we want to hire the best people in each marketing channel to build a super team, like the Traveling Wilburys of marketing.”
I think that shift is really fascinating (and it’s one of the reasons we’ve never had an issue being a Paid Search only agency), as it shows people are now seeing more value in having a truly skilled practitioner rather than in having fewer points of contact.
What this tells me, is that the savvy freelancer will identify an area in which she can become THE true expert, work hard to become that expert, and then attract clients who need that skill set. It’s time to ditch the small agency “we do it all” mentality!
I think the key to survival as a freelancer in 2024 and beyond is being satisfied with niching out (somehow: product, vertical, whatever). This may prevent you from growing into a mega-agency but I am convinced it can help you establish a profitable and stable business built on your network.
Reason #3: People Are Less Likely to Hire Based on “Agency Brand Strength” Alone.
I have to be careful here since I have a lot of respect for smart people I know in large agencies. However, what I have learned lately, is that businesses are less attracted to the “brand strength” that a larger, international agency used to carry simply by walking into the room.
I think this goes hand in hand with clients getting savvier. They want to make sure their account isn’t going to be managed by the interns when they were sold by the professionals.
In this way, I think it’s easier for a skilled freelancer who can sell well AND deliver on that promise, to win bids against larger agencies who used to have a substantial advantage simply because of their name.
Reason #4: Businesses Who Can’t Afford In-House Still Need Help.
Finally, I’m finding that there are certain businesses that simply can’t afford in-housing, even with all of the moves to in-housing that larger brands are making. In other words, there will ALWAYS be businesses that need assistance in various stages.
Rather than try to battle against in-house, I think the savvy freelancer of the future will instead look to those businesses who can’t afford to do in-house, and build a pricing package and work scope that works for both the smaller business and the freelancer.
Oh, and these may tend to be local, and I think the smaller freelancers also have a distinct advantage in that way, by rubbing shoulders with their neighbors.
So there you have it, I think there are concerns about starting a freelance or agency in 2024, but I also think there is a great opportunity. What do you think? Let’s continue the conversation on Social Media!
Optimizing paid search campaigns is essential for any account. When optimizing, the objective is to ensure that the ads reach the right audience at the right moment. Optimization also involves making updates and changes to meet business goals.
I typically follow these steps in sequence, but it’s not always necessary to execute every step during optimization. Often, merely analyzing the data and deciding to refrain from making changes is the best course of action.
Here’s a step-by-step guide on how I optimize paid search campaigns for brands of all sizes:
1. Define clear objectives.
Before diving into optimization, clearly define your goals. Whether it’s boosting website traffic, generating leads, or increasing sales, having distinct objectives will steer your optimization efforts.
In 2024, brands must understand that not all traffic is of the same quality. While traffic campaigns might seem enticing, they can attract visitors who don’t align with a specific goal. Such campaigns can result in minimal conversions and a low return on investment. Instead of merely aiming for higher traffic, brands should focus on campaigns that bring in qualified traffic, ensuring tangible outcomes.
After setting clear objectives, also align with stakeholders on key metrics, such as a CPA goal for lead generation or a ROAS goal for sales accounts or those using value-based bidding.
In one of the larger accounts that I manage the goal is to drive website sales and store visits. For this account, I worked with the team to have brand campaigns optimized towards sales with a ROAS goal. Then the non-brand or category terms are optimized for a store visit.
The reason for the shift in goals is because this product sells better when the customer can have a hands-on sales experience. The account can still result in sales, but the overall account goal and objective shifted based on where the customer was at in their journey.
This is an example of a time when having a clearly defined goal to increase sales translated down to a key optimization in the paid search account.
Have a clearly defined goal
2. Monitor and adjust budget.
Allocate a larger budget to top-performing campaigns and consider cutting or reallocating funds from underperforming ones.
I suggest evaluating campaigns based on spend, performance, and intent when adjusting the budget. Segmenting campaigns by these three categories is vital because intent varies with the keyword. If you overlook the broader objective, you might allocate the entire budget to campaigns that excel in conversions but don’t necessarily foster account growth.
This is especially relevant for brands not fully utilizing their brand traffic. By not exploring non-brand traffic campaigns, brands lose the chance to attract new customers and expand their market share. Hence, over-relying on brand traffic can hinder growth.
This underscores why all optimizations should align with clear objectives.
Adjusting budgets in the accounts I manage is generally something that can be changed 1 time a month, however when I am managing an ecommerce client I will make budget shifts a few times a month to align with promotions and sales.
3. Adjust campaign targets.
High-performing campaigns: Lower CPA/ROAS for campaigns meeting goals or based on business insights, such as significant sales or events like Black Friday/Cyber Monday.
Low-performing campaigns: Consider raising CPA/ROAS targets for these campaigns to bid less aggressively.
With Black Friday/Cyber Monday coming up, I will make changes to ROAS targets throughout the day and weekend as the sales data and conversion data align. If traffic volume is high and the account is converting well lowering the ROAS target allows the account to scale to the demand during tent pole moments.
I often say that during these sale moments in ecommerce, paid search managers know more than the bidding algorithm.
4. Evaluate ad group performance.
Examine each ad group. This step ensures that every ad group aligns with its objectives and yields the best results. Here, I assess metrics to determine which keywords need further scrutiny. I also evaluate the ads since they are at the ad group level.
There are also times when ad groups need to be turned off or on. When I was managing paid search in the auto industry the campaigns were often segmented by new and used. The used car campaigns had to be changed daily as the account might be running keywords for 1 used car only.
When that car sold the ad group needed to be turned off quickly, so the account didn’t waste money on terms for a car make and model that was no longer available. This also could have potentially resulted in a poor customer experience.
5. Optimize ad copy.
In 2024, when refining ad copy, I ensure all headlines and descriptions are utilized. I also assess performance rankings in the platform and replace underperforming assets. Additionally, it’s crucial to ensure no extra assets were inadvertently created by the platform due to campaign settings.
6. Evaluate keyword performance.
The approach for keywords mirrors that of ad groups. If the primary aim is account growth and the CPA/ROAS metrics are within range, I’m less stringent about pausing keywords. However, if keywords are too broad and metrics are off-target, I adjust the match type down to a phrase or exact.
Adjust the match type
Adding negative keywords: Excluding irrelevant keywords that might activate your ads but don’t lead to conversions is vital. This strategy not only saves on advertising costs but also enhances the campaign’s overall performance.
One of the ways that I can find negative keywords in the accounts I manage is to review the search terms report regularly. Another helpful tip is to use the Google Keyword Planner or Google Suggest. This will show you common terms that are searched with your main keyword and you can remove the terms that aren’t relevant.
7. Evaluate ad extensions.
Ad extensions offer additional information and can boost click-through rates (CTR). However, they’re often overlooked. Regularly review extensions to ensure they’re up-to-date and relevant.
For ecommerce brands sales can be updated in the promo extension, or if there is a page with a portion of the inventory on sale, I will go into the account and create a site link and direct traffic to the promotion page.
One important note is that ad extensions can be scheduled to run for certain days. This is helpful for workflow, so you aren’t finding yourself in a situation where you must find and manually turn off all the additional pieces of ads where you have added a limited time frame ad copy.
8. Create relevant landing pages.
Ensure that the landing page you’re directing traffic to is relevant to your ad and provides a seamless user experience. A mismatch can increase bounce rates and decrease conversions.
This is something I will look at quarterly across all accounts I manage. Sometimes brands will make changes to the site and landing pages should be changed for a better experience. Other times campaigns can be going to PDP pages vs category pages and depending on the size of the category the category page has better conversions.
9. Test and refine.
Testing is integral to any optimization process. Regularly conduct A/B tests on headlines, descriptions, and landing pages to pinpoint areas for performance optimizations.
The easiest test to run is the ‘Optimize Text Ads’ experiment. Some ideas for tests are headline swaps as well as landing page tests. In one of the accounts, I was managing the client created a landing page all about the category that was more educational, and we tested that page against the product page (PDP) and learned that the customers needed more information before the purchase. Based on the data the educational product page converted better than the PDP.
Test and refine your ads
10. Segment your audience data.
Many accounts I manage feature hundreds of audiences in observation mode within each campaign. If a campaign underperforms, review its performance data, and consider switching the targeting settings from ‘observation’ to ’target’. While this narrows the campaign’s reach, it effectively refines and then you can gradually expand its scope based on performance.
11. Consider bid strategies.
Depending on the account goals look at the bidding strategy. By targeting a high impression share, you ensure that you’re not missing out on potential visibility opportunities. This is especially crucial for brand campaigns where the goal is often to be seen by as many relevant users as possible.
12. Stay updated.
While this isn’t necessarily an account optimization tip, this will help you optimize your tactics. Paid search platforms, especially Google Ads, frequently update their features and algorithms. Stay updated with the latest trends and best practices to ensure your campaigns remain effective. You can do this by reading blogs like the one you are reading now, watching YouTube videos, and listening to industry podcasts.
13. Seek expert advice.
If you’re unsure about certain aspects of your campaign, consider seeking advice from paid search experts or agencies. They can provide insights and recommendations based on their experience.
In conclusion, optimizing paid search campaigns is a continuous endeavor. Consistent monitoring, testing, and refining are crucial to ensure your campaigns remain effective and achieve the desired outcomes.
And if you need help, give Optmyzr a try.
Not an Optmyzr customer yet? Thousands of advertisers — from small agencies to big brands — around the world use Optmyzr to manage over $5 billion in ad spend every year.
Sign up for our 14-day free trial today to give Optmyzr a try. You will also get the resources you need to get started and more. Our team will also be on hand to answer questions and provide any support we can.
Last quarter, we ran a test with Discovery Ads and “regular” Display campaigns to promote ADworld Experience event registrations. We spent the same budget for about 30 days using the same copy & targeting options. Here’s what we found.
As some of you may already know, ADworld Experience is the largest all-PPC event in Europe. The event’s main target audience is seasoned PPC professionals, who have been operating for some years in Google Ads, Meta Ads, Linkedin, Microsoft, Amazon, TikTok, and other online advertising platforms.
The experiment
The first key question to start the test was: how to effectively target experienced PPC professionals via Google Display channels?
An expressed interest in any advanced PPC tool could be one way to target them.
Creating audiences
So we made a list of the most renowned tools (in alphabetical order): Adalysis, Adspresso, Adroll, Adstage, Adthena, Adzooma, Channable, Clickcease, Clickguard, Clixtell, Datafeedwatch, Feedoptimise, Feedspark, Fraudblocker, Godatafeed, Opteo, Optmyzr, Outbrain, PPCprotect, Producthero, Qwaya, Revealbot, Spyfu, Squared, and Taboola.
Using this list we were able to set up 3 different audiences based on:
1. The PPC tool name searches in Google
2. The PPC tool’s interested users and
3. The users who’ve shown interest in a PPC tool’s website URLs in SERPs.
Campaign setup
Then we created a Discovery campaign and a regular Display campaign, with 3 ad groups each, based on one of the above audiences.
In both campaigns, we excluded optimized targeting (to avoid unwanted overlapping) and limited demographics for users aged between 25 and 55 (the main age range of ADworld Experience participants) + unknown (not to limit too much of the audience).
Campaign goals
The goals were:
Getting registrations for the 2023 event that happened on October 5 & 6,
Sales of past edition video recordings, and
Navigating 5 or more pages in one session (to grant Google’s smart bidding enough conversion data)
Geotargeting was limited to the home countries of the majority of ADworld Experience’s past participants (a selection of EU countries + UK, Serbia, Bosnia, Svizzera, Montenegro, Norway, and Finland). We targeted all languages and scheduled ads to appear every day from 8:00 CET to 20:00 CET.
In Discovery, we accepted Google’s default filter for moderate and highly sensible content. In display campaigns, we excluded all non-classified content, fit for families (= mainly videos for kids on YouTube), all sensible content, and parked domains.
Bid strategy
The bidding strategy was set for both campaigns on Maximize Conversions, not setting (at least initially) any target CPA.
The text and images were almost exactly the same, even if placements were different (GDN for Display and YouTube, Gmail and Discover newsfeed on Android devices for Discovery). We were forced to shorten some headings in display campaigns, but descriptions and images (mainly 2023 speakers’ photos) were exactly the same. In the Display campaign, we were able to select some videos and let auto-optimized ad formats turn on.
The daily budget was 20€ for each campaign (in Discovery the suggested budget was 40€/day, but we launched it and then later lowered it to 20€/day).
In a previous test with Discovery Ads, we found that URL-based ad group/audience was definitely predominant in terms of traffic, so we decided to exclude in that campaign all the tools not directly related to campaign management in the most widespread platforms (Adroll, Adstage, Godatafeed, Outbrain, Qwaya, and Taboola).
Besides that, in both campaigns, we were soon forced to set different target CPAs to grant all different groups/audiences a more uniform distribution of ads, lowering it where traffic spiked and making it higher where it languished.
Both in Discovery and regular Display we had to closely monitor the geographical distribution of the ads to have a more uniform coverage, lowering Max Bids up to -90% in some areas and pushing up to +50% in some other ones (it looks like Romania, Serbia and Bulgaria have a lot of “spammy” placements, while central EU countries offer much more refined and expensive spots, with no relevant differences between the two campaigns).
In regular Display ads, we could exclude low-quality sites and apps, ending up with almost 500 exclusions. We decided not to apply a pre-existing list of spammy/off-topic placements we built from previous campaigns to avoid giving regular Display campaigns an advantage over Discovery since the beginning.
The results
Here are the numbers we had after about 5 weeks and 1,500€ of total expenditure:
Regular Display Campaigns
Discovery Ads
Exposed target CPA are the final ones (reached after several progressive adjustments)
If we look at global conversion numbers, it might seem that Google’s AI-powered placements still have a long way to go before competing with a professionally set Display Ad campaign.
Another interesting thing is the radically different performance of the same audiences in the two campaigns. The audience of past searchers of PPC tools and URL-based targeting have been respectively the best and the worst performers in GDN and… exactly the opposite in Discovery Ads!
You will find another interesting “surprise” when you isolate the same numbers for the last week of both campaigns.
Regular Display Campaigns Final Week
Discovery Ads Final Week
The first and most evident general conclusion is that Discovery AI-powered placements need more data (time/money) to really start auto-optimizing.
The second most obvious conclusion is that if you know exactly what you are doing and need your campaigns to perform soon and to be laser-targeted, old-school display campaigns are still very likely to be your best choice.
The third important consideration is that if your goal is not only to convert but to drive low-cost traffic to your properties, then you should have few doubts about pushing for Discovery Ads.
Drilling a little down into the data, I was really surprised to see how different we’re performing with the same audiences within the two campaigns. We can only suppose that topic searchers’ targeting fits better to lower automation-level campaigns (being the most focused targeting option you may use in Display Network), while probably URL matching gives the Google Machine Learning algorithm more space for auto-optimizing (when a good amount of data becomes available).
In light of recent antitrust lawsuits and scrutiny over its ad business practices, advertisers are becoming more concerned that Google may be wasting their ad budgets in subtle ways. While Google provides a powerful platform for targeting customers, savvy advertisers need to be vigilant to ensure they are getting true value from their ad spend.
With Google controlling the auction dynamics and having full access to advertisers’ account data, it has the means and potential incentive to make advertisers spend more than required.
Advertisers should be aware of areas where Google Ads may subtly lead to inflated spending and take steps to optimize their accounts accordingly. Here are seven causes of inflated ad spend and ways to address the issue.
How Google May Lead Advertisers to Overspend
There are several ways Google encourages advertisers to spend more than intended or extract higher revenues from accounts, such as:
1. Using Broad Match Without Negative Keywords
One of the most powerful targeting capabilities of Google Ads is the ability to use Broad Match keywords. This allows your ad to show up for a wide range of searches related to your keywords, even if the query doesn’t contain the exact keyword.
However, some of these searches could be for more competitive terms that result in much higher cost-per-click (CPC) than expected. Other search terms may be less relevant and while costing less per click, may return poor ROAS due to lower conversion rates.
The solution is to set up a robust list of negative keywords to exclude any searches that are not highly relevant or fail to convert at justified CPCs. Otherwise, a Broad Match keyword that normally costs $1 per click could trigger ads for $5 clicks, quickly inflating your costs.
Optmyzr’s Keyword Lasso, Negative Keyword Finder, and its many prebuilt strategies for Rule Engine can all help advertisers more effectively manage keyword targeting.
When employing a Broad Match approach, it’s best practice to enable Smart Bidding strategies like Target CPA or Target ROAS. With Broad Match, an ad can appear for a wide range of searches with different expected conversion rates. Smart Bidding leverages Google’s machine learning to determine the optimal bid for each variation based on your targets.
For example, it may bid $5 for a commercial query that’s more likely to convert, versus $0.50 for a low-intent query seeking only information. This automatically adjusts bids based on the search to help control CPCs to keep CPA and ROAS within your targets.
By pairing Broad Match and Smart Bidding, advertisers can capitalize on Google’s reach while controlling spending. The combination provides expanded exposure at optimized CPCs tailored to each search query.
3. Changing Budgets Too Frequently
Google will cap your total monthly ad spend based on the daily budgets you set multiplied by the average number of days in a month. If you frequently change your daily budgets, the system will add up all those temporary budget levels over the month.
Google may also overdeliver on any day because it expects traffic on other days to be lower.
There are good reasons why advertisers may change budgets frequently — for example, in response to short-term offers, or changes in inventory and the accompanying changes in spend prioritization.
This means your actual monthly spend could far exceed the level you intended. And knowing how much you may be on the hook for can get very confusing when you change budgets throughout the month.
It is recommended that advertisers use automated tools like Optmyzr’s budget management features to ensure that Google doesn’t exceed your true budget. For example, by optimizing budgets throughout the month, while resting assured that campaigns will be paused for the remainder of a budget period when your ad budget has been exhausted.
Tools like Optmyzr even allow you to deploy flighted budgets that are not bound to the first and last days of a calendar month.
4. Ignoring Quality Score
Your ad’s Quality Score is a major factor that Google uses in determining your cost-per-click in the auction. Quality Score is influenced by expected click-through rate, ad relevance, landing page experience, and other factors. The higher your Quality Score, the lower your CPC for the same ad position.
Optimizing factors like landing page speed, ad copy, keywords, and extensions can improve Quality Score. But if you ignore it, CPCs will be higher than necessary to maintain your position, needlessly inflating your costs.
Optmyzr’s Quality Score tool helps you monitor for changes and identify opportunities for improvement by breaking out low-Quality Score keywords into new ad groups, where you can add a more relevant ad and landing page.
5. Turning On Auto-Applied Recommendations
Google Ads offers optimizations called auto-apply recommendations that it can apply automatically to your account (with your consent). These are based on its analysis of potential “headroom” to increase conversions. However, Google’s algorithm may not have a full understanding of your true conversion value.
For example, if you run a B2B lead gen campaign but only track form submissions as conversions, the system does not know the downstream value of a lead. Google may ramp up spend while chasing unqualified leads.
Advertisers should connect Google to their CRM data and review recommendations from Google manually to focus on true conversion value.
Optmyzr’s Rule Engine can connect your PPC campaigns to your business data and a variety of different conversion goals, so that you’re always in charge of determining what should be automatically changed and when.
The majority of Optmyzr’s optimization suggestions are calculated using our own algorithms that prioritize advertiser results over Google profits. But we also use a handful of Google’s optimization suggestions as the basis for further analysis.
For example, where Google recommends raising a budget to capture more conversions, Optmyzr applies an additional layer of logic to predict the incremental cost of those new conversions. Only if that cost is reasonable do our tools recommend increasing the budget.
6. Not Tracking High-Value Conversions
Similarly, if you do not properly track high-value conversions beyond simple form submissions, Google will optimize purely for form submissions. The system bases spend on whichever conversion you specify, so you need to make sure it reflects your actual desired outcome.
For a B2B company, that may require tracking CRM data on closed sales attached to converted leads. For ecommerce, connect your back-end order data.
This focuses Google’s algorithms on your real goals versus whatever limited conversion you happened to initially set up tracking for in your account.
When you use an independent third-party PPC tool like Optmyzr, you can connect your business data without that data flowing to Google. Use Optmyzr to create rules and logic with your business data, and then send only the resulting Target ROAS and Target CPA to guide Google in how it treats your ads in its auctions.
7. Using the Display Network, Performance Max, and YouTube Without Excluding Placements
A major mistake advertisers make is not proactively excluding unwanted placements in the Google Display Network, which has long faced quality control concerns from more advanced practitioners.
By default, your Display ads can run across millions of websites, videos, and apps that Google partners with for its Display network. However, many of these sites may be irrelevant to your offer or have very poor conversion rates.
Savvy advertisers will use placement exclusions to restrict Display ads only to highly relevant sites that have been proven to generate conversions. Otherwise, your budget gets wasted as Google serves your ads across its vast Display network to meet your daily budget.
How to Optimize Spending With Google Ads
Given Google’s incentives and control, PPC advertisers must take smart steps to ensure their budgets drive true value and performance. Some of these solutions include:
1. Use Independent Optimization Tools
Google Ads and the Google Ads Editor let you do a lot to optimize your ads, but they still have a number of issues related to convenience, sharing of data, and managing large numbers of accounts in little time.
Consider PPC management software like Optmyzr that can connect to your Google Ads accounts, but also integrate broader business data. This allows you to optimize bid strategies based on profitability metrics and other data, without fully exposing it to Google.
Advertisers get the benefit of Google’s targeting power but use independent tools to set optimal bids and targets based on their confidential business data. Google sees the optimal bids and targets — not your proprietary data driving it.
Third-party tools (particularly Optmyzr) also provide a high degree of support that advertisers typically crave then they regularly deal with long waits for Google’s support tickets and pushy reps.
2. Refine Tracking for True Conversions
As discussed above, advertisers need to look beyond basic form submissions and make sure they’re tracking true conversion KPIs in their accounts. This may require linking CRM data on lead quality or closed deals back to clicks and conversions.
Ecommerce advertisers can adjust conversion values to exclude returns or account for bundles/subscriptions to offer Google a more complete picture of the value they get from ads.
3. Actively Manage Quality Score
Don’t just set it and forget it when it comes to Quality Score. Actively monitor scores for keywords, ads, and landing pages. Test changes to copy, headlines, ad extensions, site speed, etc. to maintain optimal scores that minimize CPCs.
Quality Scores can suffer without ongoing optimization, so you end up paying more for the same results. So think of Quality Score management as a constant optimization loop.
Conclusion
In today’s complex digital advertising ecosystem, maximizing return on ad spend ultimately comes down to the advertiser’s savvy. While Google provides incredibly powerful targeting capabilities, its incentives may not fully align with advertisers’ need to get the highest value from their budgets.
By understanding areas where Google may cause advertisers to overspend, focusing optimization on true conversion metrics, using independent tools like Optmyzr, and constantly honing quality, advertisers can fulfill the promise of pay-per-click advertising.
With the right optimization approach, Google Ads can deliver phenomenal ROI. But it requires an expert human touch to ensure subtle factors don’t lead to wasted spend.
Retargeting is an advertising technique for reaching out to your previous website visitors. Paid search, social media, and email marketing channels let brands and other advertisers create retargeting campaigns.
However, it also requires browser cookies enabled from the user’s side. Advertisers can identify user behavior with the help of a unique code courtesy of browser cookies. Tracking user behavior and seeing whether they complete the call to action determines whether to retarget that user.
For example, if somebody abandons a shopping cart, a retargeting ad functions as a reminder mechanism to complete the transaction.
Benefits of Retargeting
Retargeting campaigns would not be so prominent without the multiple benefits they bring. According to FinancesOnline, about 70% of marketers rely on retargeting to raise brand awareness. Other benefits include:
Increased conversion rates
Reduced shopping cart abandonment
Cross-selling and upselling opportunities
Better customer engagement and retention
According to a survey by the Interactive Advertising Bureau, 92% of marketers found retargeting to outperform search, email, and display advertising.
Overall, retargeting is a valuable technique to grow your revenue, but the question is how to make the most out of it.
Here are 7 retargeting strategies that should push you in the right direction.
7 Proven Retargeting Strategies
1. Focus on the Copy Rather Than the Image.
Let’s start with the copy. If you look through various ads on different channels, brands aim to prioritize assets users are familiar with, such as logos and slogans.
Taking this approach with retargeting ads doesn’t make a lot of sense. After all, your targeted audience is already familiar with the brand. These people visited your site but did not complete the transaction.
Instead of the visuals, focus on the copy. Determine the customer hesitations and build a tailor-made ad to address these hesitations.
It helps you find ads that meet your business goals or contribute to the success of your advertising campaign, pause underperforming ads, and create new ones to continue testing.
The tool also recommends high-performing headlines, description lines, and display URLs (from your best-performing ads) to create new ads in the ad groups where you are pausing ads with a lower performance.
Online shoppers have an easy time comparing product prices to get the best deal. Bouncing from one site to another is not even necessary, as you can simply install a price checker extension on your browser.
The odds are that prospective customers did not complete a purchase because they believed that they could find a better deal. Leaving a site once is enough to potentially lose a user. And not because they could find a more appealing offer but also because of various distractions, making them forget about visiting your website in the first place.
Why not sweeten the deal in your retargeting ad by proclaiming that you offer a special discount? That’s bound to get people’s attention, especially if they showed interest early on. A simple incentive can be the difference-maker you were looking for.
3. Add FOMO.
The fear of missing out urges consumers to take action. Even if somebody doesn’t really need goods or services, they might change their mind if a last-minute offer appears on their feed.
The tried and true FOMO tactic combined with buzz phrases like “the clock is ticking” or “book now and save 50% off before the offer expires” can get people’s attention.
Many brands also highlight bestsellers and show stock levels. “Only 3 left in stock” is one way to highlight scarcity. As is running a limited offer, as is shown in the example below:
For retargeting campaigns, FOMO is particularly effective. You are reaching out to a consumer who was interested before, and giving them that push is bound to improve your conversion rates.
4. Remind Buyers Why They Chose You.
Customer retention is a priority because happy shoppers are returning shoppers. If they trust the brand, persuading them to continue spending money on your business is easier than persuading new customers.
Remind the audience why they should return. For instance, if you sell MacBook accessories and help users with creating bootable USB on Mac or solving Bluetooth problems with earpods, focus on these benefits as your selling points.
Fashion brands are another example. Whenever a collection is out, notify the customers and encourage them to browse new goods.
Finally, for recurring service businesses, retargeting ads could revolve around reminders to book an appointment.
5. Polish Your Call to Action.
Your call to action entices potential customers to lose their hesitation and commit. A good CTA button is:
Action-oriented
Short
Legible
Creates urgency
Previously covered discount and FOMO tactics shape the CTA copy, but one should also understand the importance of designing and presenting the offer visually.
Bright and clear colors and enough white space are the basics of designing graphics for your retargeting ads. However, if the ad has multiple elements, it is crucial to establish a clear hierarchy and push the call to action in the front.
6. Test Different Times.
Retargeting ad engagement rate is similar to social media content engagement in the sense that the time of displaying the ad determines how much traction it gets.
It takes a while to test different time frames to gain enough data for conclusive results, but it is a necessary step to create a successful retargeting campaign.
Some marketers lose motivation when their early retargeting efforts lead nowhere. They fail to recognize that changing the ad display time is enough to boost engagement.
7. Track Your Ad Data.
Determining the best time to display your ads is just one part of the data you need to collect. Retargeting marketing is complex, and those in charge of the campaign have to go through trial and error to gain insightful details and improve the results.
Color psychology in the visuals, the copy, target demographics, locations, and everything else you can think of that goes into the retargeting market to maximize the effectiveness of the campaign.
Multiple tools exist to track different information, so you do not have to worry about keeping tabs on everything manually.
Also, expect to make adjustments to keep up with ever-changing digital landscape trends. Failing to do that means ineffective usage of available resources and falling behind competitors who are more efficient than you.
It’s easier to convert returning visitors than new visitors.
To sum it all up, retargeting ads have a fair few benefits, and they should be utilized more. At the end of the day, returning customers are easier to please than new potential leads.
That is not to say that businesses should abandon the idea of attracting fresh customers. It’s just that when done right, retargeting ads is less of a hassle.
And if you need help, Optmyzr makes it easier to showcase the value of your campaigns.
Not an Optmyzr customer yet? Thousands of advertisers — from small agencies to big brands — around the world use Optmyzr to manage over $5 billion in ad spend every year.
Sign up for our 14-day free trial today to give Optmyzr a try. You will also get the resources you need to get started and more. Our team will also be on hand to answer questions and provide any support we can.
It is hard to change a strategic perspective. We form our ideas on the world based on data and inferring causation and correlation. Acknowledging that an outcome is no longer viable means that either the circumstances changed or the logic wasn’t sound. Both are uncomfortable.
We’re going to dive into a lot of data in this post and I’m also going to outline my old perspective and how I got there.
An important disclaimer: Just because this post looks at a lot of data and there is a high probability that one path is correct, it does not mean that the other path is outright incorrect.
It simply means that there is a significantly lower probability that you will see the profit and victory your brand deserves going with the “loser” in the data.
Our conclusion, up front
This is a really long post. So, for the sake of time, here’s a TL;DR of the study we conducted.
We analyzed 2637 accounts, conducting a study to explore the effectiveness of Broad Match vs. Exact Match. Due to how closely tied Smart Bidding and Broad Match are, we also analyzed Maximize Conversions and Maximize Conversion Value (1334 accounts). Key findings include:
Broad vs. Exact Match
Exact Match outperformed Broad Match in terms of CPC, CTR, CPA, ROAS, and conversion rate for the majority of accounts.
Conversion-oriented metrics like CPA and ROAS favored Exact Match.
Both conversion volume and click volume were better with Exact Match. Conversion value was flat between both match types.
The data suggests not making drastic changes if Broad Match is already performing well but considering testing for potential benefits.
Maximize Conversions vs. Maximize Conversion Value
Maximize Conversion Value performed better in terms of CPC, CTR, CPA, and ROAS for most accounts.
Max Conversion Value had cheaper CPC, possibly due to bid caps and practical ROAS goals.
CPA was generally better with Max Conversion Value, challenging the belief that higher CPA can lead to higher-value customers.
The data also recommends using Max Conversion Value and determining conversion value based on customer value and channel conversion rates.
Takeaways:
Test your assumptions and don’t take conventional wisdom for granted.
Keep evaluating your accounts and bidding strategies to optimize costs and performance.
Only test Broad if you go in with protections in place and have budgeted for data acquisition.
My original point of view
I strongly supported Broad Match for a long time and would defend the match type in posts that attacked it. I did this for the following reasons:
The pragmatist in me could see that match types as a mechanic were not really as powerful as they had been (or so I thought). Rather than fighting the current, it made more sense to just make the best with Broad Match.
Broad Match would often provide Phrase and Exact Match “matched by” in the search terms report, so there was no reason to pay the perceived premium for Exact Match if we could get it with Broad Match.
Broad Match was enhanced to include audiences that otherwise would not be included unless Smart Bidding was selected.
I strongly favored Max Conversion Value because it leans in to how ad channel algorithms function. However, I would often recommend Max Conversions because setting ROAS goals and customer values represented a struggle for lead generation accounts.
I hate DKI (dynamic keyword insertion) because the syntax ends up being weird and was a strong believer in pinning creative.
DKI would force keywords into ads regardless of whether it would sound “correct”.
DKI often gets paired with formulaic ads that don’t speak to the prospect in a meaningful way.
The Details of The Study
We wanted to make sure the data would be as clean as possible so set some pretty strict criteria for accounts we would include in the study.
We went through four different versions of the data and questioned the outcomes to make sure we could confidently stand behind the data.
Here are the considerations we factored in:
Accounts had to have both things we were comparing (Broad and Exact, Max Conversions and Max Conversion Value).
Accounts had to have at least 90 days of spend data at the start point of the analysis (we looked at Q1 of 2023).
Accounts could be any vertical and any spend level. However, outliers (accounts spending more than $5 million per month and accounts that had periods of no spend) were excluded from the study.
Data looks at the following: which thing had more accounts that did better with the mechanic in question, as well as what was the improvement over the other mechanic.
In the Broad vs. Exact Match study, we had 2637 accounts that met the criteria. These accounts come from all over the globe and vary in vertical and spend; 1402 accounts exceeded $10K per month. Additionally, 1235 accounts had less than $10K per month in spend.
When examining Max Conversions vs. Max Conversion Value, we had 1334 accounts that met the criteria. They were a mix of including and not including goals for tCPA and tROAS.
We first wanted to look at overall performance and performance gains. It’s important to note that Optmyzr customers tend to be more advanced than the average advertiser, which means we are taking it as a given that the accounts on the whole will have healthy account structures.
We do not enforce a particular structure on our customers, so there will be a mix of all account structures in the data set. All comparisons are looking at how Broad compared to Exact within the same account.
Overall Data
For Cost Per Click (CPC):
56.55% of accounts performed better with EXACT, and the median percentage difference is 77.96%.
27.34% of accounts performed better with BROAD, and the median percentage difference is 36.96%.
For Click-Through Rate (CTR):
85.65% of accounts performed better with EXACT, and the median percentage difference is 84%.
13.88% of accounts performed better with BROAD, and the median percentage difference is 36%.
For Cost Per Action (CPA):
70.79% of accounts performed better with EXACT, and the median percentage difference is 100.71%.
27.48% of accounts performed better with BROAD, and the median percentage difference is 52.52%.
For Conversion Value/Cost:
64.12% of accounts performed better with EXACT, and the median percentage difference is 122.40%.
19.91% of accounts performed better with BROAD, and the median percentage difference is 79.87%.
For Return On Ad Spend (ROAS):
72.52% of accounts performed better with EXACT, and the median percentage difference is 113.47%.
26.47% of accounts performed better with BROAD, and the median percentage difference is 64.71%.
For Conversion Rate (CVR):
56.73% of accounts performed better with EXACT, and the median percentage difference is 68.63%.
22.72% of accounts performed better with BROAD, and the median percentage difference is 50.12%.
We can see that the majority of the accounts perform better with Exact Match, and the median percentage difference is also better for those users that performed better with Exact Match.
For accounts spending over $10,000:
There were a total of 1402 accounts.
76.03% of the accounts present had better ROAS with EXACT match. 22.54% had better ROAS with BROAD match. 1.43% had no difference.
74.61% of the accounts had better CPA with EXACT match. 24.54% had better CPA with BROAD match. 0.86% had no difference.
57.49% of the accounts had better CPC with EXACT match. 29.24% had better CPC with BROAD match. 13.27% had no difference.
88.23% of the accounts had better CTR with EXACT match. 11.34% had better CTR with BROAD match. 0.43% had no difference.
66.98% of the accounts had better Conversion Value/Cost with EXACT match. 16.98% had better Conversion Value/Cost with BROAD match. 16.05% had no difference.
57.20% of the accounts had better Conversion Rate with EXACT match. 17.76% had better ROAS with BROAD match. 25.04% had no difference.
For accounts spending less than $10,000:
There were a total of 1235 accounts.
69.07% of the accounts present had better ROAS with EXACT match. 30.36% had better ROAS with BROAD match. 0.57% had no difference.
67.21% of the accounts had better CPA with EXACT match. 30.04% had better CPA with BROAD match. 2.75% had no difference.
55.71% of the accounts had better CPC with EXACT match. 24.45% had better CPC with BROAD match. 19.84% had no difference.
83.00% of the accounts had better CTR with EXACT match. 16.44% had better CTR with BROAD match. 0.57% had no difference.
61.78% of the accounts had better Conversion Value/Cost with EXACT match. 23.00% had better Conversion Value/Cost with BROAD match. 15.22% had no difference.
56.36% of the accounts had better Conversion Rate with EXACT match. 27.53% had better ROAS with BROAD match. 16.11% had no difference.
The number of accounts using Exact Match wins irrespective of whether or not their spend is over $10,000. But we can see a slight drop in percentages of accounts that had better metrics with Exact Match for those who spend below $10,000.
Spend may not be the biggest factor at play here, but it does affect the numbers slightly.
Does the data translate over to the volume of conversions or other KPIs?
While we can’t show the average volume of the individual metrics (because of the amount of variables in each account), we can show which account had a higher percentage of the volume within the same account.
For Clicks:
51.28% of the accounts performed better with EXACT, and the median percentage difference is 113.36%.
48.56% of the accounts performed better with BROAD, and the median percentage difference is 115.06%.
For Conversions:
50.32% of the accounts performed better with EXACT, and the median percentage difference is 131.82%.
47.26% of the accounts performed better with BROAD, and the median percentage difference is 130.37%.
For Conversion Value:
52.09% of the accounts performed better with EXACT, and the median percentage difference is 158.10%.
47.29% of the accounts performed better with BROAD, and the median percentage difference is 161.27%.
For Cost:
49.30% of the accounts performed better with EXACT, and the median percentage difference is 99.37%.
50.36% of the accounts performed better with BROAD, and the median percentage difference is 104.31%.
For Interactions:
51.28% of the accounts performed better with EXACT, and the median percentage difference is 113.16%.
48.56% of the accounts performed better with BROAD, and the median percentage difference is 115.06%.
For Impressions:
47.11% of the accounts performed better with EXACT, and the median percentage difference is 111.38%.
52.89% of the accounts performed better with BROAD, and the median percentage difference is 103.46%.
Broad performs a hair better than exact in terms of cost and impressions. Exact performs in every other metric. However, the difference doesn’t seem to be too large. In terms of magnitude, Broad is better in every case except impressions and conversions.
Breaking down each metric and its respective findings
Average CPC
I was genuinely surprised that Broad Match lost to Exact in terms of auction price. There are a few reasons for this:
An assumption is that Google would give Broad Match preferential treatment in the auction and therefore discounted rates. While this ended up being incorrect, it is worth noting that this category was one of the closer ones between Broad and Exact. As such, I’m not surprised that some advertisers will still see better CPCs on Broad than on Exact.
Broad Match tends to have an assumption about it that it will be lower quality, so I thought the human element of bidding down would come into play.
What I didn’t think about until the data came in was how many accounts would be on manual bidding vs. Smart Bidding. Ironically, the enhancements to Broad (e.g. improved audiences) may have made the algorithm bid more than it should have on Broad, while Exact picked up the cheaper rates. This is pure speculation and I would have no way of proving it, but it is an interesting idea.
Average CPC tends to be higher for higher quality leads (or so we’ve been conditioned to believe).
The revelation that Google had been raising the CPC floor by 5%-10% is just enough to bridge the gap between what savings we would expect from Broad vs. Exact. It’s possible if we had run this study a few years ago, the difference in CPC would have been much wider.
The big takeaway from this data point (especially looking at how close low and high spending accounts are) is that you can’t use Broad Match for discounted clicks anymore.
If you use it, you’re using it to gather data on what you should be investing in (and potentially which terms to add as negatives to your account).
CTR (Click-Through Rate)
I don’t think anyone was surprised to see Broad Match had a worse CTR than Exact Match. Broad Match by its very nature is going to expose itself to more queries and therefore be predisposed to lower CTR.
CPA (Cost Per Action)
This is another “not that surprised” category. However, there’s a bit more to dig into here than CTR.
One of the assumptions I and the Optmyzr data team made when we were going through the data is that anything conversion-oriented would be flawed. This was a big reason we only looked at performance in relation to individual accounts and aggregated those results.
However what I was surprised by is how Exact Match did 100% better than Broad when it was the winner, yet Broad Match did 50% better than Exact.
I have a few thoughts on why this might be:
The sophistication of advertisers can mean they know to set more realistic CPA goals as well as budgets to help the campaigns achieve those goals. This likely contributes to why Broad Match advertisers who did well, saw the respectable average of 50% improvement over Exact.
CPA is tied to which conversion actions are considered primary and secondary. While this data set looks at Q1 2023 (before the summer 2023 glitch where advertisers saw new conversion actions being created in their accounts in the migration away from UA), it still is in the sphere of influence. As advertisers were migrating to GA4, it is 100% possible that extra conversion actions could have been factored in.
Because we looked at performance within the accounts, these potential errors/glitches would have been baked in and accounted for. This is more in reference to why the numbers aren’t completely one-sided.
ROAS (Return on Ad Spend)
Similarly to CPA, there is a certain degree of human error baked into anything conversion-related. However, unlike CPA, this metric is very one-sided favoring Exact (even in accounts with less than $10,000 in ad spend).
I was not expecting this to be true due to the perceived hesitation to adopt customer values and value-based bidding. I was expecting this to lead to reduced ROAS adoption.
If anything, this is a great testament to the value of ROAS and value-based bidding because Exact Match would be operating from a perceived point of weakness (lacking the enhancements of Broad Match).
CVR (Conversion Rate)
While this metric feels like CTR, it’s a little less obvious that Exact would win over Broad. There are a few reasons for that:
Given how much audiences factor into Broad match, there’s an assumption that the conversion rates would have been closer. Additionally, since Exact match got more clicks/interactions than Broad on average, it’s reasonable to expect the conversion rate would be lower because of more leads in the pool.
Conversion rates are very much dependent on the ad copy and the landing page. I would have expected both match types to struggle or be closer if ad copy/landing pages were a problem, however Exact clearly won.
Match-Type Action Plan
This is not the time to make drastic changes in accounts if things are working for you. If your account is currently running Broad Match and doing well, do not feel you need to pause those winning keywords.
However, if you’ve been considering “upgrading” to Broad, it’s worthwhile to take a pause and consider whether your account will benefit from the test.
If you do decide to test, make sure you pause your existing keywords and add the Broad Match variants manually. If you remove a keyword, you can’t get it back and you’ll likely want to have the ability to backtrack if you don’t like how broad behaved.
Optmyzr does not have a single “recommended” account structure as we see our customers succeed with different strategies. However, one fairly universal theme is that if you run match-type campaigns/ad groups you will likely get hit with impression share lost due to rank and budget.
Consider consolidating these so that you can have fewer but stronger ad groups and campaigns. Again, there is no conclusive “winning” structure. However, if you’re struggling with impression share, that’s a way to mitigate it.
Finally, there is no data to suggest (quite the opposite) that Performance Max is bad. I’d strongly recommend reallocating any paused Broad Match budget into Performance Max. Absolutely use the search themes in Performance Max to help focus those campaigns.
Which does better: Maximize Conversions or Maximize Conversion Value?
We did not include manual bidding in this analysis. However, it is worth noting that 12% of Optmyzr customers currently use manual bidding, while 66% use some form of Smart Bidding (Max Conversions or Max Conversion Value). We attribute this in large part to the heavy adoption of Performance Max, as well as the average size of Optmyzr customers (we tend to focus on $10,000 or higher monthly ad spend).
Overall Data
For CPC:
44.98% of accounts performed better with Maximize Conversion Value, and the median percentage difference is 64.30%.
36.73% of accounts performed better with Maximize Conversion, and the median percentage difference is 60.61%.
For CTR:
52.02% of accounts performed better with Maximize Conversion Value, and the median percentage difference is 62.43%.
46.48 accounts performed better with Maximize Conversion, and the median percentage difference is 51.15%.
For CPA:
52.55% of accounts performed better with Maximize Conversion Value, and the median percentage difference is 86.29%.
46.40% of accounts performed better with Maximize Conversion, and the median percentage difference is 81.04%.
For ROAS:
60.19% of accounts performed better with Maximize Conversion Value, and the median percentage difference is 107%.
39.58% of accounts performed better with Maximize Conversion Value, and the median percentage difference is 91.31%.
When we compared all the accounts the majority performed better with Maximize Conversion Value and the median percentage gains were better as well.
The 645 accounts with over $10,000 spend in Search
For CPC:
46.67% of accounts had better CPC with Maximize Conversion Value, 36.9% had better CPC with Maximize Conversion
For CTR:
52.09% of accounts had better CTR with Maximize Conversion Value, and 45.74% had better CTR with Maximize Conversion
For CPA:
53.18% of accounts had better CPA with Maximize Conversion Value, 46% had better CPA with Maximize Conversion
For ROAS:
63.26% of accounts had better ROAS with Maximize Conversion Value, 36.4% had better ROAS with Maximize Conversion
The 662 accounts with under $10,000 spend in Search campaigns
For CPC:
43.50% of accounts had better CPC with Maximize Conversion Value, 36.86% had better CPC with Maximize Conversion
For CTR:
52.57% of accounts had better CTR with Maximize Conversion Value, and 46.53% had better CTR with Maximize Conversion
For CPA:
51.81% of accounts had better CPA with Maximize Conversion Value, 46.83% had better CPA with Maximize Conversion
For ROAS:
57.4% of accounts had better ROAS with Maximize Conversion Value, 42.45% had better ROAS with Maximize Conversion
Spend did not impact Max Conversion Value winning and there was very little change in performance looking at accounts that had over $10,000 vs. less than $10,000 in monthly ad spend.
Breaking Down Each Metric
Average CPC
The biggest surprise for me was that Max Conversion Value had the better (cheaper) CPC because it runs counter to what we know of how the algorithm bids. Traditionally we’d expect the algorithm to bid more aggressively for a lead that would have a higher probability of meeting the objective (conversion value goal).
That Max Conversion Value had the cheaper CPC implies the following:
The ROAS goals were more practical than I tend to give folks credit for, so the algorithm didn’t spike bids as much as they might have otherwise. This speaks to the data source and the higher probability that Optmyzr customers will manage their accounts at a higher level.
Bid floors are leveling the playing field so those who are using value-based bidding are getting access to a “smarter” algorithm.
The main takeaway here is that advertisers should not default to thinking cheaper is inherently worse, however getting discounts on clicks is much more about giving data to the algorithm than having a perfect quality score.
CTR
I was not terribly surprised that CTR would be better with conversion value because if an advertiser takes the time to put in conversion values, they likely will put more effort into message mapping creative.
That said, both were close, which implies that it’s more on the human running the campaigns as opposed to the bidding strategy directly influencing the CTR.
CPA
To be honest, I was expecting Max Conversion Value to have a worse CPA because we’ve been trained to believe that CPA can be higher to get higher value customers. However that it had the cheaper CPA overall is more of a wake-up call than anything not to get complacent on CPAs.
It is worth noting higher spending accounts did slightly better with CPA than lower spending accounts (but ultimately it was negligible).
If you’re struggling with your CPA, consider whether you’re asking your budget to do too many things or if the campaign can get enough clicks in the day to lead to conversions. Both those mechanics can influence CPAs being artificially high.
ROAS
It should not come as a surprise that the majority of Max Conversion Value campaigns did better than Max Conversions on ROAS. What is interesting is that there were accounts that saw better ROAS using Max Conversions.
I have a few theories on this:
Some brands are not allowed to use conventional conversions and it’s possible that in those accounts max conversions can do better than ROAS simply because users will represent more than one conversion (and the advertiser intends this).
Max Conversions might have been in older campaigns which would be predisposed to do well.
It’s important to note that we did not include conversion rate in the data because it was essentially the same.
Bidding Strategy Action Plan
There is no good reason not to use Max Conversion Value. Hiding behind a lack of clear customer value is just giving your competitors the chance to overtake you.
When determining your conversion value the best way to do it is to consider your average customer value against the conversion rate of each channel. If you’re unsure what the average would be, you can start with a minimum SQL (sales-qualified lead) or minimum subscription price. While this won’t be perfectly accurate, it will give you a place to start.
My new outlook
The biggest takeaway from looking at the data is not taking anything for granted. Just because we’re told something is true, it’s important to test and prove whether it’s viable in our accounts before committing to it or discarding it.
Additionally, given that the conventional wisdom—that Exact Match and Max Conversion Values are more expensive because they provide more value—didn’t play out at scale, it’s worth doing a deep dive into your accounts if they are driving up your costs.
Consider being more aggressive with negatives and exclusions, as well as owning whether you have the budget to go after desired transactional traffic or if you’d be better served leveraging your budgets on cheaper networks (Microsoft) or top of the funnel (Performance Max, social, video).
We’re very grateful to our customers for allowing us to enable them on the path to profit and victory and it means a lot to get to continue to empower them through automation and freedom of structure.
And if you aren’t an Optmyzr customer, but need help with running more profitable campaigns, sign up for our 14-day free trial today to give our tools a try.
Thousands of advertisers — from small agencies to big brands — around the world use Optmyzr to manage over $5 billion in ad spend every year. You will also get the resources you need to get started and more. Our team will also be on hand to answer questions and provide any support we can.
Google is currently on trial for antitrust allegations from the US Justice Department, and Google employees have acknowledged what we’ve long known about how the ad auction works: Google controls the pricing — and sometimes raises auction minimums.
Here’s a rundown of just how Google controls auction pricing and what advertisers can do to protect their own interests.
Antitrust Trial: How Google Controls Advertising Costs
The trial has focused on Google allegedly using exclusionary tactics to maintain its dominance as the world’s leading search engine. But the US Justice Department is also making the case that Google has monopolistic power over search advertising as a specific industry.
Search ads make up the bulk of Google’s massive revenue, so how Google runs these auctions has become a point of scrutiny.
Ads May Be Promoted Out of Order to Boost Revenue
During the trial, a Google executive shared that the company frequently tweaks its ad auctions in ways that can raise prices for advertisers. One method is out-of-order ad promotion, where a lower-ranked ad gets promoted above a higher-ranked ad. This allows Google to generate more revenue by showing ads in locations with higher minimum prices.
In the ad auction, Google ranks all the eligible ads competing for each ad position on the search engine results page (SERP). The highest-ranked ad usually occupies the most prominent top position.
However, sometimes the top-ranked ad may be ineligible to show in that top spot due to certain rules Google has, even though it won the top rank. For example, Google may require ads in the top position to meet certain editorial or relevance standards that the top ad does not fulfill.
In this case, rather than leave the top spot empty, Google will do an out-of-order promotion. This means they will take the next highest-ranking eligible ad and promote it out of order above the ineligible top ad.
So if ad one ranks highest in the auction but cannot show in the top position, ad two (which ranked second) may get promoted to the top spot ahead of ad one. This allows Google to still show a relevant ad in the most visible placement, while adhering to their eligibility rules.
The key takeaway is that out-of-order promotion allows lower-ranked ads to jump ahead of higher-ranked ads when those top ads break rules about where they can appear on the SERP. It ensures Google can serve ads on premium real estate while enforcing editorial or relevance guidelines.
This helps Google make more money and is beneficial to advertisers because lower-ranked ads aren’t artificially held back by editorial or other issues with higher ranked ads.
Google Ads Auction Has Reserve Prices and Thresholds
The other technique Google deploys to improve its revenue is changing auction thresholds and reserve minimum pricing. Over time, this can increase the cost for advertisers to maintain an ad’s position.
The auction minimum CPM is the lowest amount an advertiser must pay to have their ad shown in a particular ad slot. The corresponding minimum CPC bid is determined by a combination of the auction reserve price and the Quality Score of each ad. Quality Score itself is based on factors like expected clickthrough rate and ad relevance.
Remember that Ad Rank is effectively the equivalent of CPM because in simple terms, Ad Rank is predicted CTR multiplied by CPC, which is predicted CPM.
When Google asks for a minimum CPM to show an ad in a particular location, and that ad’s predicted CTR is a static value determined by AI, the only lever the advertiser can control is their bid. So long as there is headroom with their maximum CPC, Google can raise the effective CPC to meet the new CPM threshold.
How Reserve Prices Raise Auction Prices
If Google increases an auction’s minimum bid, it raises the floor price to get into the auction. Advertisers who previously met the minimum bid at lower CPCs now have to bid higher just to participate and have a chance to show their ads.
So when the auction floor is raised, the only variable that can instantly change is the effective CPC. And so long as that effective CPC is below the maximum CPC, the automated auction can collect a higher cost for the click.
This not only increases costs for advertisers who were bidding near the floor price, but it can also raise costs across the board. Even advertisers who were bidding well above the minimum previously may see their costs go up.
Here’s why: In the auction, the top ad position goes to the highest bidder. When the minimum bid goes up, advertisers bidding near that level must increase their bids to participate. This then bumps up the amounts that slightly higher bidders need to pay to maintain their ad positions. Essentially it has a cascading effect across all bids.
So while the advertisers most impacted are those near the auction minimum, an increase to the minimum bid lifts the overall cost of entry and makes the auction more expensive for everyone. It raises the bar across the board in terms of the bids required to capture various ad positions on the page.
How to Safeguard Against Google’s Black Box of CPC Inflation
As we learned from testimony at the trial, these tactics are sometimes implemented to help Google meet financial targets. More importantly, Google does not notify advertisers when these pricing changes occur.
This may leave advertisers believing their optimizations were counterproductive and led to increased costs, when it was an external factor outside of advertisers’ control that caused the change in price.
Luckily, there are steps advertisers can take to manage this uncertainty.
Quality Score Remains an Important Cost Optimization Lever in PPC
The fundamentals of optimizing for quality score and predicted click-through rate remain essential. Focusing on these factors will help minimize what you pay in ad auctions, even as Google changes minimum price thresholds.
Google’s Quality Score algorithm is complex, but essentially it boils down to predicting clickthrough rate (CTR). The higher a keyword’s Quality Score, the more relevant Google thinks your ad will be for searches on that keyword.
This relevance translates into a better Ad Rank, and when your Ad Rank is higher, you pay less per click to maintain it.
Quality Score is calculated in part based on historical CTR data for your keywords and ads. But many other contextual factors are considered each time your ad enters the auction – like query intent, location, time of day, and more.
So Quality Score is very granular and constantly fluctuating.
The core factors that make up Quality Score are ad relevance to the search query, expected CTR, and landing page experience. When these elements are strong, your Quality Score improves, boosting Ad Rank and leading to lower average CPC.
So time invested in improving Quality Score by enhancing relevance has a clear payoff – maintained visibility at a lower cost.
Monitoring and Alerts Are Critical to Detect CPC Changes
PPC monitoring is critical to get alerts on price changes, and automated rules can pause campaigns if extreme anomalies are detected.
PPC management tools like Optmyzr provide (among other things) automated alerts when metrics deviate from goals. You can get notifications for changes in KPIs, budget pacing, or hitting targets. This allows you to address issues before they become larger problems.
Optmyzr also has customizable rules to tell campaigns what actions to take, like pausing or adding keywords to a report. And when a major performance shift occurs— both positive and negative—PPC Investigator can help analyze its root cause.
With Optmyzr’s robust PPC monitoring capabilities, you ensure the prices of your search ads don’t skyrocket out of control. It’s like insurance for your PPC account. This level of monitoring and automation is now table stakes, and imperative for any modern advertiser who wishes to stay on top of volatile auction dynamics.
Use Vertical Benchmarks to Know Whether CPC Increases Are Your Doing
PPC Vertical Benchmarks in Optmyzr helps advertisers understand the performance of their account relative to that of similar advertisers.
Comparing your metrics to vertical-specific benchmarks lets you assess whether a price increase is an industry-wide trend or unique to your account. This context helps determine the best optimization approach:
If your CPC went up but others’ CPCs increased by more, you’re probably on the right path.
If your CPC increased more than those of your industry peers, it may be time to enable additional optimizations – deploying more negative keywords, adjusting target CPA and target ROAS, and rewriting your responsive search ads to be more relevant.
Watch the Trial – And Your Google Ads Accounts
Google’s antitrust trial is still ongoing and may reveal more about the tech giant’s ad practices. If Google is found to be a monopoly, structural changes to auctions could follow.
As the situation evolves, advertisers need the flexibility and control to respond swiftly. The core principles of automation, vigilance, and relying on data hold true to navigate an ever-changing auction landscape.
Conversion tracking is one of the most important tools in a PPC marketer’s toolkit. By tracking post-click actions that indicate value - like lead submissions, purchases, or registrations - you can understand the true ROI of your keywords, ads, and targeting parameters. This enables you to optimize bids and budgets to drive more of the conversions that impact your bottom line.
However, implementing conversion tracking has never been easy. Traditionally, it requires adding code snippets on your site to track conversions and/or integrating your CRM data with your Google Ads account through their API. For many advertisers, this involves engineering resources or dependency on other teams to execute the technical integration. Even for experienced PPC experts, this process can be time-intensive and risky to implement.
That’s why Google’s new Enhanced Conversions for Leads is a potential game-changer. By streamlining the implementation entirely within Google Ads, this new tracking method can help more advertisers unlock the benefits of conversion data in their campaigns. In this post, we’ll cover what Enhanced Conversions offers, how you can benefit, and best practices for getting started.
What are Enhanced Conversions for leads?
Enhanced Conversions provides an alternative way to enable offline conversion tracking without modifications to your existing CRM or analytics systems. Here’s an overview of how it works:
When a potential customer fills out a lead form on your site, that data including their email address, name, and contact details is captured by your site’s form handler or CRM. With Enhanced Conversions, that first-party lead data can be hashed and sent directly to Google Ads to match it with any corresponding ad clicks.
Later, when that lead converts into a sale or other goal, you upload the hashed lead information to Google. They match that lead to the original ad click, closing the loop on the conversion process. This gives Google a more complete picture of the customer journey and lead quality when optimizing your bids and ad placements.
The key difference from traditional methods is that this integration happens entirely within your Google Ads account, instead of via an API or manual uploads. You don’t need engineering resources to modify your CRM and can leverage the lead data you already have on hand.
Why do existing conversion tracking methods fall short?
To understand why Enhanced Conversions is an exciting update, it helps to know why existing conversion tracking has not been widely adopted.
Advertisers are used to being able to control most elements of their campaigns through self-service tools. But those same marketers usually don’t control the CRM systems where this valuable offline conversion data lives inside their organization. This dependency on other teams and sometimes even engineering significantly reduces the adoption of conversion tracking.
Modifying underlying CRM or analytics systems requires technical expertise that is beyond the access of most marketing teams. Even for those with engineering resources, it can be time-consuming and risky to build out a conversion data pipeline securely and accurately. Testing and troubleshooting errors add further delays.
As a result, many PPC marketers have simply avoided the hassle of offline conversion tracking. But that means missing out on critically valuable data to optimize bids and drive ROI.
Benefits of the New Enhanced Conversions
By removing the dependency on engineering resources, Enhanced Conversions makes this kind of conversion tracking far more accessible. PPC experts can enable it directly within their Google Ads interface in a simpler process.
More importantly, activating this deeper conversion data can significantly improve campaign performance:
Gain a more complete view of the customer journey.
What first touchpoints drive the most valuable leads? Enhanced Conversions connects those initial ad clicks all the way through the conversion process.
Optimize bids for quality over quantity.
Focus ad spend on conversions that impact ROI rather than vanity metrics like clicks. Value-based bidding leverages enhanced conversion data.
Eliminate wasted spend.
Identify low-quality leads that don’t convert and avoid bidding on them. Enhanced Conversions provides that feedback loop.
Improve targeting.
Conversion data reveals your best-performing audience segments, placement types, ad formats, and other factors to refine targeting.
Calculate true ROAS.
Without conversions, ROI metrics are only guesses. Enhanced Conversions provides real data on your return from ad spend.
The bottom line is that this richer conversion data powers more efficient spending and better quality leads. For savvy PPC marketers, it’s essential insights for driving campaigns to the next level.
Best practices for implementing Enhanced Conversion Tracking
Here are some best practices to follow as you enable it in your accounts:
Choose the Right Conversion Action.
Your first step is deciding what conversion or goal you want to track. A few key pointers:
Don’t start by tracking final conversions only.
Look for meaningful mid-funnel steps first like lead submissions, demo sign-ups, or email registrations.
Consider volume.
If you track final conversions and they occur infrequently, the system won’t have enough data to optimize well.
Factor in time to conversion.
Longer time lags make optimizations slower. Shorter time-to-convert metrics are better.
Don’t merge all conversions together.
Isolate specific actions to avoid “junk” conversions skewing data.
Thoughtfully Estimate Conversion Value.
Next, think carefully about assigning monetary values to your conversion actions. Some tips:
Leverage data from your CRM on customer LTV or average order value to estimate downstream revenue.
If exact values aren’t known, use reasonable ranges or tiers for each conversion type. Just avoid only 2-3 wide buckets.
Values don’t have to be precise! Relative differences between your conversion types are what matters most.
Manage the Transition to New Conversion Tracking.
Once you’ve decided on conversion actions and values, you can enable Enhanced Conversions in your accounts. But take care with the transition:
Add the new conversion tracking but don’t change your bid strategy at the same time. Let the data accumulate first.
Allow for an adjustment period of at least 1-2 weeks before optimizing bids based on the data. Avoid major changes in short periods.
Watch performance metrics closely and pause aggressive changes if you see volatility or a decline in conversions.
Implement in smaller campaigns first before rolling out more widely. This minimizes risk.
While proper setup takes patience, taking the time to do it right will pay dividends through improved performance.
Looking Ahead with Enhanced Conversions
Now that Enhanced Conversions removes major barriers to implementation, PPC marketers have an opportunity to more fully realize the benefits of offline conversion tracking.
As this method gains adoption, we should see more granular data-driven bidding, spent aimed squarely at profitable outcomes, and continuously improving performance as the system learns. When conversion tracking is democratized beyond just the most sophisticated enterprises, it raises the bar for sophistication across the whole industry.
And that’s greatly accelerated by inventory-level bidding technologies like smart bidding. The combination of conversion data and automated optimization makes PPC campaigns smarter and more efficient than ever.
For savvy PPC experts, staying ahead of these curves by implementing Enhanced Conversions today means you can outperform competitors who fail to level up their conversion tracking capabilities. That advantage will only compound over time as conversion data accumulation enables greater optimizations.
The opportunity is now yours. Get started with Enhanced Conversions and watch your ad spend get smarter.
And if you need help, Optmyzr makes it easier to protect your account!
Not an Optmyzr customer yet? Thousands of advertisers — from small agencies to big brands — around the world use these tools to manage over $4 billion in ad spend every year.
Sign up for our 14-day free trial today to give Optmyzr a try. You will also get the resources you need to get started and more. Our team will also be on hand to answer questions and provide any support we can.
There’s nothing worse than coming back to a dirty house. The washing is piled high, laundry is draped all over the furniture and there’s a ‘stench’ that fills the air.
Nobody wants to invite people into that situation and it can also be massively embarrassing. Well, no more is this metaphor true than when describing a Google Ads account structure.
As with the analogy above, a messy house can often be a sign of something else going on behind the scenes.
In a bid to help you avoid domestic chaos (from an ads perspective of course), we’ve compiled a list of reasons why having a straightforward account structure is so important and ensures you keep your house in order.
3 reasons why a Google Ads account structure is so important
1. Easier navigation
Firstly, just for your own sanity, having an easy-to-understand structure can save you LOADS of time. On an almost daily occurrence, clients, account managers, or wider members of the team may have general questions about the account and its performance.
When this is the case, there’s nothing worse for both parties than having to sit through someone muddling through a straightforward process. By having a clear and easy-to-navigate structure, you reduce the likelihood of this happening and can help to instruct those asking the question in a much more streamlined way.
2. More precise reporting
Whether working in-house, at an agency, or even for yourself, there’s nothing worse than pulling report data that’s a mess. Building on that, it can create extremely difficult situations for account managers who have to go into great detail about poorly defined accounts that contain irrelevant keywords and queries.
An enhanced structure can improve reporting and make optimization a lot smoother!
This is only going to lose the trust of the client so always ensure that the structure aligns with wider reporting goals.
3. Better results
Arguably the most important reason for a clearly defined structure is performance!
Not only does it help to clearly signpost what is and isn’t working (with poor results standing out like a sore thumb!), but a clear account structure can help improve quality scores.
Ensuring that everything from the campaign through to keyword and content matches up ensures you’re putting your best foot forward from a quality score perspective, which in turn can help to improve overall results.
Depending on how complex an account is there is also the added element of ensuring that the structure aligns with individual campaign KPIs.
For example, if you’re running campaigns that utilize different automated bid strategies (be it brand campaigns with target impression share versus product campaigns driving conversion metrics), it would be recommended to cover this element in the naming structure to help remind management teams of the campaign aims.
The flip side
There is an important element to note with structure and that is being ‘over structured’ - if you’re working across a large-scale account, where you know the inner workings like the back of your hand, just consider how an outsider may see it.
Is your detailed naming structure packed full of abbreviations really working for the client?
Do you have campaigns broken out by match type when there really isn’t enough data to warrant this approach?
While the previous hypothetical questions may work, on the one hand, it can often be beneficial to take a step back and think - ‘how can I make this easier to digest?’
The 4 important elements of a Google Ads account structure
So all of these ideas sound great, but I’m sure you’re thinking ‘but what can I do about it?’ - well fear not! Listed below are some key action points on how to set your campaign up for structure success! :
1. Clearly defined naming structures
PPC 101 here but always ensure the campaign name actually has a link to its contents! It’s such a basic thing but numerous accounts have fallen foul of ensuring keywords align with campaign names, leading to a mish-mash of everything and keyword chaos.
2. Labels
Always the lifesaver of an account. I’d always advise leaning on these when accounts scale. As mentioned though, try to ensure that these make sense, we don’t want to make more trouble for ourselves by having to spend time translating our own work!
3. Shared budgets
Shared budgets can be another great way of keeping a budget in line within a nicely ordered account. Why spend time worrying about underutilized budgets when you can automatically share this allocation with those which may be more stretched budget-wise?
Alongside our additional structure must-haves, shared budgets can be a great time saver!
4. Negative keyword lists
Please, please, please take time before launching to consider whether a campaign by campaign, account-level, or hybrid negative keyword list will be best for your account.
Nobody needs to be rueing misspent clicks when the negative keyword should have been set at the campaign level rather than the account level. Get everything tip-top by taking time to consider your approach to negatives.
Keep your house in order
So next time you’re staring into a messy account - stop for a minute, think about all the tips you’ve learned here, and ensure you’ve followed our key steps to ensure that your house is in the best shape of its life!
When creating a PPC campaign, there are a lot of factors that you need to consider to be successful. While crafting compelling ad copy and setting up an effective bid strategy are a few critical parts of the process, converting paid site traffic into paying customers is what it’s all about.
Landing pages are one of the most essential elements of a successful PPC campaign, as they are the first thing potential customers see after clicking on your ad. A well-designed landing page can be the difference between a conversion and a bounce, so it’s important to consider yours.
In this article, I’ll discuss how you can use video on your landing pages to improve the conversion rate of your PPC campaigns significantly.
But first, let’s quickly go over what a video landing page is and why you should create one.
What is a video landing page?
A video landing page is a type of landing page that uses video to promote a product, service, or brand. Usually, the video is the page’s primary focus, with other elements such as text and images playing a supporting role.
**Source**: [Wistia](https://wistia.com/)
Video landing pages are very effective because they can communicate a lot of information in a short amount of time. They are also engaging and visually appealing, which helps capture visitors’ attention.
What are the benefits of a video on a landing page?
When constructing landing pages for your PPC campaigns, there are several factors to consider. However, adding a video should be at the top of your list, as it can provide many benefits. Here are some of them:
1. Improves Engagement
The first and most obvious benefit of using video on your landing pages is that it can improve engagement. Video is an incredibly engaging medium, and including one on your page can help to keep visitors interested.
A recent study by Myzowl polled over 582 marketing professionals to get their take on the benefit and impact of using videos to improve engagement. 87% of those polled said that video has helped them increase traffic to their sites and landing pages while over 60% said that number of views a video receives directly coincides with the success of the advertising campaign.
By using video, you can tell your story in a more engaging and interesting way than with text and images alone. You can also include calls to action within the video, prompting visitors to take the desired action.
2. Is Useful and Informative
Another benefit of video landing pages is that they can be useful and informative when marketed to the right audience. Unlike text, which can often be dense and hard to read, videos are easy to consume and hold people’s attention.
At the same time, a well-made video can communicate a lot of information in a short amount of time. This is perfect for dynamic landing pages where you need to get your message across quickly.
If you’re selling a complex product or service, a video can be an invaluable tool for simplifying complex concepts. By breaking down your offer into bite-sized pieces and explaining it in an easy-to-understand way, you can help to increase conversions.
When you can define the value of your products or services simply and concisely, people are more likely to take the next step.
4. Builds a Positive Brand Image
In addition to being informative and entertaining, videos can also be used to build a positive brand image. When done correctly, they can humanize your brand and make it more relatable. This is important, especially if you want to build long-term relationships with your customers.
By featuring real people in your videos and telling your brand’s story, you can connect with viewers on a more personal level. This will make them more likely to do business with you.
5. Creates an Emotional Connection
Finally, videos can also create an emotional connection with viewers. This is because they allow you to communicate more personally than text or images alone.
While the features of your product or service are indeed an essential component of your campaigns, it’s also important to focus on the emotional aspects.
10 Tips for High-Conversion Video Landing Pages for PPC Campaigns
Now let’s learn how to create high-converting pages. While there’s no one-size-fits-all approach, these tips can help you get started:
1. Use a Script
Making a script is one of the most critical steps in creating a video. Without one, staying on track and including all necessary information will be challenging.
When writing your script, think about what you want to say and how you want to say it. Don’t worry if it’s not perfect, as you can always make changes along the way. Just make sure that you have a clear idea of what you want to say before you start filming. Doing so will save you a lot of time and frustration.
2. Keep the Video Above the Fold
When creating a video landing page, it’s important to keep the video “above the fold.” This means that viewers should be able to see the video without scrolling down.
**Source**: Wistia
If your video is buried below other content, there’s a good chance that people will never even see it.
3. Showcase the Product in Action
Videos are an excellent opportunity to showcase your product in action. This is especially true if you offer a physical product that can be demonstrated.
**Source**: Wistia
If possible, include a demonstration of your product in the video. This will give viewers a better idea of what it is and how it works. Seeing the product in action will also help to increase confidence and encourage people to make a purchase.
4. Optimize for Search
Just like with any other type of content, optimizing your videos for search engines is important. This will help ensure as many people see them as possible. When optimizing your video, there are some core elements that you’ll need to focus on:
Ensure your videos adequately showcase the value
Make sure the video is easy to navigate
Add metadata to your videos, including SEO titles, descriptions, and tags
Incorporate interactive elements into your videos when able
Make your videos accessible by providing transcripts and captions
Leverage video-sharing sites like YouTube to redirect to your landing pages
5. Keep It Short and Simple
When it comes to videos, less is often more. People generally are not interested in watching long, drawn-out videos.
Instead of trying to include everything in one video, break it up into multiple shorter videos. This will make it easier for viewers to digest the information and keep them engaged.
6. Use Custom Thumbnails
People scrolling through their feeds are likely to stop and watch a video if it has an attractive thumbnail. This is why it’s important to take the time to create custom thumbnails for your videos.
Think about what will grab attention and make people want to watch the video. A well-designed thumbnail can distinguish between someone watching your video and moving on.
7. Avoid Autoplay
While autoplay can be a great way to ensure that people see your video, it’s not always the best option. Sometimes, it can be annoying and lead to people leaving your page.
If you do choose to use autoplay, make sure that it’s not set to too high of a volume. You don’t want to startle or annoy people as soon as they land on your page.
8. Make It Informative
Your video should be informative and provide value to the viewer. If it’s nothing more than a commercial, people are not going to want to watch it.
Think about what you can include in your video that will be helpful or interesting to people. The more value you can provide, the more likely people will watch it all through.
9. Capture Attention in the First Few Seconds
It’s important to capture people’s attention in the first few seconds of your video. If you don’t, there’s a good chance that they’ll move on before it’s even over. The first five seconds should be the most engaging part of your video.
Think about what you can do to hook viewers in and make them want to keep watching. This may mean starting with a question, shocking statistic, or attention-grabbing visual.
Regardless of your choice, make sure it will grab people’s attention and get the point across within 5-10 seconds.
10. Focus on the unique value proposition
Your video should be focused on your unique value proposition (UVP). This is what sets you apart from your competitors and is why people should do business with you.
Make sure that your UVP is clear and concise. It should be evident in the video so that viewers know exactly what you’re offering and why they should choose you over someone else.
Level up your landing pages today
Video is a critical element of a landing page. I’m positive that if you follow and execute these 10 tips, it can greatly help you increase your PPC campaign conversion rates and drive more sales.
It’s no secret that Performance Max campaigns present limitations in terms of data and insights we can pull from them. As a result, understanding the causes of their performance fluctuations can be difficult.
I’ve created an in-depth 44-point checklist for ecommerce businesses in this article to make accomplishing that task easier for you.
Of course, you don’t need to go through every single one of these points. Just go over the ones that are relevant to your business.
I also discussed some of these points on PPC Town Hall with Frederick Vallaeys and Mike Rhodes. You can watch the full video here:
Get actionable PPC tips, strategies, and tactics from industry experts twice a month.
Performance Max 44-point evaluation checklist for ecommerce businesses
Investigate…
Estimated conversion reporting delay.
Average days to conversion from first ad interaction (account-wide and campaign-specific).
Conversion tracking and recent changes to conversion actions.
What “normal” PMax performance fluctuation looks like for the account (if appl.)
Recent changes to budget, bid strategy type, Asset Groups, and Listing Groups
Google Merchant Center product disapprovals and warnings, account issues, and feed issues.
Changes to the site (e.g. navigation/checkout, plugins, hosting, page designs)
Changes to in-stock products, especially best sellers.
Changes to pricing, customer shipping costs, and promotions listed or previously listed on the site.
Extremely negative reviews on and off the site
Google Search Console for “Failing” URLs
Changes in relevant search and buying behavior via the Insights section of your PMax campaign and your account as a whole, Google’s Keyword Planner, Google Trends, your site’s search feature (if appl.), Best Sellers section of Google Merchant Center (if appl.), and Microsoft Ads (if appl.).
New competitors in the market or competitors who are changing their level of competitiveness within ad auctions you compete in.
Major changes in other marketing and site traffic channels outside of Google and Microsoft Ads (e.g. Facebook Ads, email automation, affiliates, third-party remarketing channels)
Major changes in on-site shopping behavior (e.g. cart abandonment, check-out abandonment, sessions with transactions)
Shifts in Shopping network-specific performance for PMax.
Top Bidding Signals report for optimization changes recently made by automated bidding.
Performance shifts of landing pages PMax ad clicks are being sent to.
Major changes made to non-PMax campaigns that may have impacted the performance of PMax.
Major shifts in the performance of high-volume or high-performing search terms, geographies, devices, days, days of the week, hours, audiences, match types, or campaign types in non-PMax campaigns.
Performance metric outliers for the campaign pre and post-major increases or decreases in performance.
Performance metric outliers for the products advertised in the campaign - at the campaign-level and Asset Group-level.
Performance metric outliers for the Listing Groups in the campaign.
Asset Group assets or Ad Extensions with Eligible (Limited) or Disapproved status.
Seasonality Adjustments not being added for major promotions, or for other major expected spikes or dips in conversion rates.
Improperly added Data Exclusions, or for instances where Data Exclusions should have been added but were not.
Scripts or Automated Rules that made changes to the account that may have had an impact on Performance Max.
Account changes by other users who are not the primary account manager.
Auto-applied recommendation changes made by Google.
Customer match list additions, removals, or edits.
Custom Experiments recently ended in the account.
Value rules or conversion value adjustments were added, edited, or removed.
“Best” rated assets inside top performing Asset Groups had a recent change in rating.
High-performing or high-volume search categories or terms shifted away from a high-performing or high-volume Asset Group.
Edits made to a Business Feed or Custom Variable that affected any non-PMax campaigns.
CRM integration issues.
Negative Keyword List was added to the PMax campaign being evaluated per the request of another user.
Negative keywords were improperly added to a Negative Keyword List that is applied to the PMax campaign being evaluated.
YouTube ads were opted out of by another user.
Mobile app placements not owned and operated by Google had major increases or decreases in impressions.
Mobile app category exclusions were applied at the account or campaign level.
Location or Ad Schedule exclusions were added or removed for the PMax campaign being evaluated.
Improperly setup Performance Max URL Exclusions.
Auto-generated YouTube videos were added by Google to the PMax campaign being evaluated.
Want to safeguard your Performance Max campaigns? Click here to learn how.
This is a guest post by Cory Lindholm, Founder of Ads By Cory.
About the author: Cory is a paid search expert in Google and Microsoft Ads. He has helped countless brands grow their businesses with advanced paid search strategies for nearly a decade.
Account management is a necessary task that all PPC managers have to perform on a regular basis.
While it can be time-consuming and tedious (like flossing your teeth), it’s unavoidable if you want to keep your account in good health.
In this article, I’ll share four of the most important “campaign hygiene” tasks our PPC managers at WebMechanix perform on an ongoing basis to keep their accounts humming.
1. Audit the search terms report
Auditing the search terms report at different levels is one of the most time-consuming PPC tasks, but also one of the most vital to keep your account’s performance trending up and to the right.
You need to monitor the search terms like a hawk for three key reasons:
1. Make sure the search terms you show for align with what you bid on
This is especially important with the changes Google has made to match types over the last two years. We now see more close variant search terms showing for Exact Match and Phrase Match keywords, some of which are not relevant.
You also need to make sure that the right ad groups are triggering the correct queries. This is a tactic known as “query funneling”. Query funneling by campaign or ad group ensures that the right keyword, ad, and landing page show for the correct query, thereby increasing the chances of a click and conversion.
2. Save money
By looking at the queries, you can start to compile a list of negative keywords. These are keywords that you do not want to show for.
Negative keywords typically fall into two categories:
Keywords that aren’t relevant to your business goals
High-click queries that have not led to a conversion.
By excluding these queries, you free up money to spend on relevant queries that do convert well.
3. Find new keywords to bid on
Typically, you can find a few high-converting queries that you may not have as an exact match keyword. By adding these high-converting queries as exact match keywords, you make sure that you show for that query more often.
Bottom line: The search terms report is a goldmine for negatives, new keywords, and ensuring search intent. Mine it frequently and extensively.
2. Monitor your quality scores
Quality score (QS) is often an overlooked metric when assessing account performance.
I find PPC managers often fall into two camps.
Camp 1 says, “Quality score is an important metric to assess and try to improve.”
Camp 2 says, “Quality score, shmality score… doesn’t have an iota of impact on account performance.”
At WebMechanix, we fall in the first camp. We’ve found that you can improve quality score while optimizing your accounts!
Besides, quality score is one of two metrics used to determine ad rank and how much you will ultimately pay if your ad is clicked on. So it’s worth paying attention to.
And since Smart Bidding is prevalent in most accounts these days, quality score can often be your only lever to lower your cost per click (CPC).
When assessing quality score, I look at keywords with high click volume to see which ones have low quality scores, and then the reason Google gives for the low quality score. Finding a high-click keyword with a low quality score due to ad relevance is like finding gold within your account.
With the exception of competitor keywords, you should never have a keyword that has an ad relevance below average. That’s because ad relevance is the easiest metric that a PPC manager can influence.
It can easily be improved by adding the keyword with a low quality score to your ad copy. By doing this simple task, you can end up saving literally hundreds of dollars a month (if not thousands).
Bottom line: Quality score is a powerful lever to lower your cost per click and crank up return on ad spend (ROAS). Make efforts to improve quality score a part of your weekly routine.
3. Prune out non-serving keywords
Easier-to-manage accounts are typically the ones that perform the best. So stop overbuilding accounts and adding an unnecessary amount of keywords to each ad group!
One easy way to make your accounts easier to manage is by removing non-serving keywords. Within almost every account, there will be several keywords that have not shown an impression for a large period of time (often 90+ days).
Ask yourself: Are these keywords really necessary, or are they getting in the way and making it harder to assess performance?
Don’t be afraid to go through and hit “pause” on clutter keywords like these. Your future self will thank you when you go to build reports and optimize your account.
Bottom line: Don’t make your job as a PPC manager harder than it has to be. Clean out dead weight keywords regularly and watch your effectiveness soar.
4. Cut ties with low-performing keywords
I know, you probably picked the keyword and really feel that it should be performing for you. But if a keyword isn’t delivering results within a reasonable period of time, you have to make that critical decision and pause.
When onboarding new accounts, this is one of the first tasks our account managers perform. We have seen accounts where only 2% of the keywords that had been clicked over the last 30 days were responsible for a conversion. That’s a lot of wasted spend!
By pausing the high-click non-converting keyword, you are able to spend more on your high-converting keywords — which means more bang for your PPC buck at the end of the day.
Bottom line: Stop wasting spend on low-performing keywords, especially if you have high-converting keywords that are losing search impression share due to budget constraints.
Block and tackle like the PPC pros to win on search
No one said everything about managing a paid search account would be sexy.
In fact, it’s often the unsexy things done consistently over time that drive growth, not the flashy or big sweeping account changes.
And you don’t have to go at it alone — Optymzr has some great PPC tools to help make that daily PPC grind a little bit more automated.
But by executing these four activities on a consistent basis, you’ll be doing the work that most advertisers are too lazy to perform. And you’ll get the results those other advertisers can’t.
Google calls it value-based bidding. We think of it as ROI optimization. Other teams simply consider it maximizing conversion value.
Whatever the name, there’s one outcome: more valuable, higher quality leads that improve overall profitability.
Here’s an example of this strategy in action of our client which is a drug rehabilitation and mental health services facility in Florida.
Watch Taylor Mathauer and Will Gray from WebMechanix share how they used Value-Based Bidding to generate higher-quality leads for their client.
You will learn: - Why they decided to use value-based bidding - Success with value-based bidding - The state of smart bidding and limitations with value-based bidding - Where they’ve seen value-based bidding not work - Requirements for using value-based bidding - When is value-based bidding appropriate - How to track success with value-based bidding
Designing the next step for our client
For our client, volume is the name of the game. Over the course of our campaigns, we’ve optimized for both form fills and phone calls, but calls have historically been our North Star.
While other conversion actions like form fills or insurance verifications are still valuable to their business (and check the box of volume for their admissions team), they wanted to increase the number of calls sourced via Google Ads spend due to their much higher MQL and SQL rate.
The challenge was finding a solution that could prioritize calls while not completely eliminating other conversion actions that are still valuable to their business.
Answering the call to maximize ad spend value
Our solution was to use a value-based bidding strategy to teach Google’s bid strategies which conversion actions are most valuable to our client’s business.
By setting conversion values for our conversion actions and using a value-based bid strategy, we were able to train Smart Bidding to prioritize the action that provides the most value without sacrificing overall lead volume.
Step 1: We did some funnel math to ensure we were setting the correct value for each conversion action. We started by assessing the average revenue each conversion action had driven over a certain time period.
Step 2: We looked at down-funnel metrics such as MQLs, SQLs, and Closed Deals to assign an appropriate value to each conversion action. Below is an example of the math we did to get the accurate conversion value for each action:
Step 3: After setting the correct conversion values for each action, we needed to decide what bid strategy to use. We landed on Target ROAS (tROAS) because we believed that this would increase the number of calls for our clients while improving efficiency.
Note: tROAS works by predicting the value of each query and bidding higher on queries that are more likely to drive a high-value conversion.
Monitoring the outcome for optimal success
We implemented our value-based bid strategy on October 29, 2021.
There are two lenses of performance here: the first looks at the first 4.5 months of implementation, while the second looks at performance since implementing this bid strategy vs. the previous period, to show overall account growth.
The purpose of the latter is to show that as the Smart Bidding algorithms adjust to these users, they’re able to have a rolling impact.
Looking at the last 4.5 months compared to the previous period, we saw a 161% increase in phone calls, 58% increase in form submissions, and a 31.5% drop in cost per lead.
Looking at October 30, 2021 to July 25, 2022 compared with February 3, 2021 to October 29, 2021, we observed a 96% increase in phone calls, 267% more form submissions, and a 54% reduction in account-wide cost per lead.
Conclusion
If the primary goal of your PPC account is to generate leads to be nurtured, there’s a strong case to be made that value-based bidding is your best bet at stretching your ad budget to its fullest capability.
Learn more about how to use this approach to optimize the ROI of your Google Ads campaigns with these resources:
Over the past 5 to 6 years we have all experienced the impact of change within the PPC community. While many of the changes have made tasks faster, advances in automation and machine learning have forced paid search professionals to navigate platform changes without control.
With even more feature confusion marketers can feel overwhelmed by their inability to keep up with Google’s propensity for change.
PPC Marketers are losing control. There is still a hyper-awareness of performance metrics while knowing the industry won’t go back in time. So, what does it all mean?
The two main categories of automation
Task automation
Task automation is pretty simple. Two small examples of automated tasks that have changed over the past few years in PPC include
the ability to find redundant keywords in an account, and
the ability to quickly report data
Both of these tasks used to involve downloading raw data into a spreadsheet and creating pivot tables. Today, both these tasks can be done in minutes using the ‘Recommendations’ Tab or the ‘Report Center’ in the Google Ads interface.
Automation is a positive evolution in the paid search industry for seasoned professionals, but it can be difficult for beginners.
The main drawback of task automation is that people who are new to the field often do not understand why the task is important; they just know to press the button. Finding duplicate keywords for example is a way to avoid competition with ads in the same account.
When there are multiple versions of keywords, ad relevance gets diluted which can impact quality score, reduce click-thru rates and increase CPCs.
When it comes to reporting tasks, prior to automation, segmented reports were cumbersome to create. Reporting can show trended data in the interface but once broken down into segments, the decision-making becomes stronger.
Segmenting data can help determine which campaign type or setting is delivering the most value for the account. Understanding how to segment data and why to segment is a skill that requires experience.
Taking the time to understand why data should be analyzed in different ways will foster better client communication.
Bidding automation
Automated bidding is a different category of automation. Historically, as Google Ads evolved we had only lost control of variants. Automated bidding has been a significant shift. This change means that campaigns need to be consolidated so Google has enough data to learn.
The automation of bidding also favors larger campaign budgets as small daily budgets limit impression share and the ability to get all the data possible.
Lastly, this type of bidding works best when match types are broad because the system can maximize the reach of the keyword and consider the context of the search. This is another area of automation where understanding the history and basics of PPC can shed insight as to why the campaign is behaving in a specific way.
1. Understanding how automation operates is key.
Understanding the types of automation is a key component of effective PPC account management. Showing the trend over time as well as the strategy that has been deployed adds context to client reporting.
Get actionable PPC tips, strategies, and tactics from industry experts twice a month.
You can’t have it all. It’s a sad, but true fact. You can’t scale an account while becoming more efficient. And the tactics and strategies for each goal are fundamentally different.
It’s like trying to make a peanut butter sandwich while getting your nails done: it just doesn’t work. Alignment and understanding here are critical because clients often ask why CPAs are increasing while pursuing a growth strategy.
As marketers navigating automation it is best to plot learning periods, campaign launch days, budget changes, bidding strategies, and campaign reorganization alongside performance data. This is a great way to explain to clients why the data shifted while explaining the impact of different campaigns and strategies.
2. Audience targeting has evolved over the years.
Another shift in PPC has been the evolution of audience targeting. PPC was designed around keywords. Still, in 2022 we create keyword lists and attempt to match keywords to intent.
However, Google has inch-by-inch added supplemental features to allow for more audience targeting. Advertisers can now target ads based on specific groups or demographics of people that share similar characteristics or interests and layer this data into campaigns with keywords.
The audiences provide more context to our paid search campaigns.
Why do audiences matter?
As much as we think we know, keywords aren’t perfect. The intent is difficult to pinpoint and paid search in the search network is based on matching intent.
“Keywords are not focused on the human, instead, they are focused on the word itself and what we think we know. In contrast, audience targeting is all about people. Instead of looking at keywords, audiences factor humans that have certain characteristics, demographics, and behaviors.”
As marketers, we are trying to influence behavior so the human component of audiences is relevant. Merging the keyword with audiences absolutely improves paid search campaigns.
3. The keyword has evolved too.
The paid search community has a hard time admitting that the keyword is not perfect. Bottom-of-the-funnel activities are easy to understand and show high returns.
Get actionable PPC tips, strategies, and tactics from industry experts twice a month.
Those of us who started in the early days lived through a radical budgeting shift. In traditional media such as TV and radio demand capture is harder to measure. Keyword paid search was not only easy to measure but could be directly tied back to sales and actions.
As time went on, advertisers struggled to grow demand. Their problem was that they had invested heavily in demand capture activities and underinvested in demand generation tactics. Large advertisers who had abandoned traditional media began to see the light and reinvested in traditional advertising.
It is no surprise that most advertisers did not put their money back into TV, radio, and newspapers. Instead, advertisers moved to Facebook, programmatic display, and CTV.
These newer platforms excel at demand generation more than the keyword. During this time keywords became saturated. Keyword bidding could feel like hitting a brick wall when it came to increasing lead volume.
Platforms such as Google have this data and realized at some point to grow their revenue they would need advertisers to grow beyond keyword bidding as well. The platforms offered top-of-funnel solutions.
But let’s face it - the community at large was reluctant.
This was the start of automation and platform changes. Today the age of automation is upon us.
At first, advertisers were not even sure how to react. Those who had the highest confidence in their abilities started telling stories of a past life where they had been on the other side of the fence, wearing the shoes of the man who crafted the campaigns himself.
They spoke of spending six hours a day meticulously concatenating millions of keywords, optimizing ad copy, and tinkering with settings, in an attempt to find that golden 1% boost in conversion rate.
Modern advertisers leaned into automation and saw success. They began to lean into a fuller funnel approach.
“Today the best advertisers lean into automation while taking the time to understand platform changes. The understanding comes from reading support documentation, understanding the history of how the tasks worked when being done manually, and having a healthy dose of skepticism when applying changes.”
4. Google support’s quality has degraded.
Another evolution in PPC has been platform support. In recent years, Google customer support has been less responsive than it was in the past.
“Click-to-chat has become the new norm. Calls involve long wait times. Google reps are focused on sales and tool adaption and less focused on teaching and supporting client goals.”
They come across as having their priorities backward, while conversations can be circular arguments with the rep referencing incorrect support documentation or proposing campaign changes that don’t align with the goal.
There have been times it seemed like customer support was handled by a computer instead of a human.
5. The PPC community has become more collaborative.
The PPC industry has become much more open as a result of this lack of support, which has led to an increase in collaboration among members of the community. In the past, as professionals, we were territorial over tactics and resisted openly sharing successes and failures.
Get actionable PPC tips, strategies, and tactics from industry experts twice a month.
Today, we work together to figure out what works and what does not perform as expected.
6. There’s more access to learning resources now.
Another change in the PPC industry is access to information. When I got started in paid search marketing, I had to read blogs to learn. I remember setting up Google Alerts in my inbox so I could read any article about paid search, PPC, or SEO.
Today there are free webinars, books, podcasts, virtual conferences, TikToks, and YouTube channels. There are ways to consume content on your own terms. I’ve been able to attain some of my professional success because of the flexibility afforded by my ability to listen to podcasts or YouTube videos.
“The sharing of information has helped our community thrive in that: it has spread ideas and enabled collaboration. Most of us have stopped trying to outwit the machine and accepted that we can not beat or control it.”
Understanding how machine automation operates is more impactful than deep dives into spreadsheets which was a requirement during the ‘3 million keyword’ days of paid search.
We need to work alongside the machines.
To sum up the changes in PPC - we’re in a battle against the bots. And while it’s up to the industry to fight them together, the onus is on each of us individually to adapt and make the most out of this automated landscape.
It’s important to remember why you got into PPC in the first place - for the opportunities for creativity, for developing your own style, for pushing yourself. If you only view automation as an evil force trying to steal your job, then automation will win.
And maybe that’s how some out there want it - but I don’t think many would be satisfied with a passive existence. Whether or not automation wins, we all need to start looking at new ways to become the best marketers and PPC strategists.
I encourage you to work with your clients to find ways to keep ad campaigns interesting and fresh regardless of what changes come our way.
This is a guest post by Sarah Stemen, Senior Paid Search manager for Marcus Thomas.
About the author: Sarah Stemen is a Senior Paid Search manager for Marcus Thomas based in Cleveland, Ohio. She is a regular participant in PPCChat and a board member of the Paid Search Association. Sarah has been working in paid search since 2007 and has spent time on both the client side and the agency side. When not doing paid search, Sarah is busy with 3 kids.
Get actionable PPC tips, strategies, and tactics from industry experts to your inbox once a month.
Has the world of PPC as we knew it come to an end?
The short answer, my friend, is not yet and, if you continue reading this article, you’ll understand what I mean :-)
I’ve avidly read all articles and reports by Frederick Vallaeys and several of the top most important Google Ads professionals in the world. I’ve also performed a lot of experiments myself and I am sure that there still is a wide scope for manual selective targeting to perform better than machine learning.
But then the real question becomes: how to do it (without losing the immense possibilities provided by AI)? And, under what circumstances is it worth it?
The answer as often is the case in the digital marketing industry, is not easy and has to be applied on a case-by-case basis, after an evaluation of running campaigns.
When is automation worth it?
My almost 20 years in PPC have taught me that there is not a right or wrong way of doing Google Ads, but several more or less effective ways to target your ideal prospects or customers.
I’ve literally seen things in Google Ads campaigns (that you wouldn’t believe) working well, and technically perfect structures failing to meet even the minimal goal they were built for.
This is why I’ve always tried to reach my ideal target audience in the most complete (& simplest) ways the platform allows me to do. This way of doing campaigns will never fail.
But it also means you cannot use a fixed model or structure to promote everything. You always have to try almost completely different approaches to meet your campaign’s goals.
Anyway, after having tested several different ad structures I come to elaborate on a general wireframe, which I hope can help you too.
What is ‘Agile Target Layering’ and how does it work?
I named it “agile” because it is not built on a fixed structure. You have to change it as soon as you see it does not achieve results or if you find better ways to effectively address your audience.
I used the words “target layering” because to get the most out of your campaigns you have to be sure that machine learning perfectly understands which are your ideal audiences and covers them completely.
If it doesn’t, you have to pair it with some manual target “layers” to be sure to cover what you know performs best at the lowest cost possible.
Presently the only way to achieve this goal is to add some “old school” campaigns to the PPC AI, which we are only slowly starting to taste these days.
**The Agile Target Layering framework by Gianpaolo Lorusso**
To explain it in a simple way, you should address the top of the iceberg’s best-converting search intent of your audiences with a phrase or exact match campaign (starting from branded keywords, for instance).
Then leave the conversion stars scouting to machine learning (ML), sculpting these campaigns out with negatives for irrelevant terms and what already is performing well in your “old school” campaigns.
Once ML finds something that converts, you can loop again into the process, and build a new manual target layer upon it, or simply enjoy all the benefits of ML and spend your saved time thinking of other approaches you could use to your target users (or even better spending time with your family 😊).
Agile Target Layering applied to a hyper-competitive industry
Imagine you have to sell luxury home rentals in Sorrento (one of the best seaside spots in Italy) on a global scale.
**Source**: Sorrento Home Rentals
Your Bottom of the Funnel (BOFU) keywords to build specific phrase or exact match search campaigns could then be: “Sorrento luxury villas”, “Sorrento luxury rentals”, “Sorrento villas with private pool”, “Sorrento luxury apartments” etc. That is “specific location + a luxury related term + home rental term”.
Nothing, except branded terms with the name of the villa or website, will ever attract more in-target users to your site.
If your budget allows it, you could then add some broad match MOFU campaigns with keywords like: “Sorrento villas”, “holiday rentals Sorrento”, “Sorrento home rentals,” etc., and see if machine learning can do the magic of finding juicy audiences for you.
Then again you could add a final layer with totally machine-learning-driven campaigns like Performance Max or Discovery/Display to address TOFU audiences to see if you can convince someone who isn’t even aware of the existence of so a beautiful place like Sorrento and only wants a place to literally “spend” their time (and money, of course).
After an initial training period (the lower the budget, the longer the period) you will be able to check what needs adjustments, what has to be stopped, and what deserves more push and optimization.
Final takeaways
I firmly believe that our mission as PPC professionals in this time of great change in our industry is to instruct machine learning on what it doesn’t or cannot know (marginality of sales, seasonality, competitor brands with our same exact positioning in the market, best audiences to start from, etc.) and to be sure that our budget is spent first on what has the maximum chance to convert and then, if profit margins allow it, on what might convert.
This is a guest post by Gianpaolo Lorusso, a PPC & CRO consultant.
About the author: Gianpaolo Lorusso is a PPC & CRO consultant for several medium & large companies. He also founded ADworld Experience, the largest Pay Per Click & Conversion Rate Optimization event in Europe and the largest in the World based on real PPC Cases.
You’ve done your keyword research, narrowed down your top keywords, written compelling ad copy, and created a great landing page for what you’re selling. But you find out your Quality Score is below average.
Improving your quality score increases your ad’s position and as a result, increases its landing page visibility. It’s also an indicator that your ad is relevant and doing well.
Quality Score was and continues to be the key way to understand what Google thinks of the quality and relevance of your ads.
Automation backed by machine learning delivers good results, but it can’t do much about relevance problems, so focusing on relevant ads will improve your performance further.
A better Quality Score always has and always will help you save money.
Time to move on to the meat and potatoes of this post. Don’t worry though, I’d never leave you hanging.
5 Ways to Improve Quality Score
1. Use Optmyzr’s Quality Score Tracker
That’s not to say that you can’t use what Google gives you, but our team uses Optmyzr to track our quality scores. Why? Because when you have as many accounts as we do (I work for a digital ad agency) with dozens of campaigns, ad groups, ads, and keywords in play at the same time, we need all the help we can get in order to quickly pinpoint the areas we need to focus on the most.
We’ve worked the Quality Score Tracker into our daily process and our clients are way better off because of it. We’ve also learned that this is a great tool to show clients. Granted, there is some debate out there about whether quality score is a good metric to show a client or not but with the way we do things, it’s great.
We like to teach our clients because we believe that a learned client is a lifelong client and, as long as they understand what kind of return on ad spend (ROAS) they are getting, one who understands the benefits of larger paid search budgets
Below is a real screen-shot of a dealership client of ours:
Right off the bat, we can see where the issue is. Overall, the account quality score is good at 7.7 but as we all know, there’s always room for improvement. That red circle on the top left stands out, doesn’t it?
Clicking into it we can see the offending ad group in addition to the offending keywords. We can even see the quality score over time. Below where it says Daily Trend (bottom of image) there is a line graph that tells you exactly when the quality score dipped.
Armed with that knowledge, I’m able to go into Google Ads and see that the ad was wrong. While the ad had been changed to include the year of the vehicle, the keywords for this particular ad group didn’t include that information.
Since the keywords being bid on didn’t match the ad and, of course, the landing page when the ad was clicked on didn’t match the ad, the quality score went down.
This took just a few minutes to find and then correct.
2. Use Long Tail Keywords – Expected CTR Quality & Ad relevance
Competitive keywords can be difficult to manage in both organic and paid search, especially in the more competitive industries, which is why you should always be picky about the keywords you use. With long-tail keywords, you can be more specific and specificity equals a higher conversion rate, less cost per click, and a higher expected click-through rate.
If you really want to take the whole superhuman CTR thing to the next level then think about using single keyword ad groups (SKAGs). True, these may take a bit more work to implement but your CTR will thank you.
There are more than a few reasons why you’d want to take a closer look at SKAGs and I encourage you to if you aren’t familiar with them or haven’t tried them yet. One of the main reasons why SKAGs work so well is because they are so very relevant. Using SKAGs you can ensure that every keyword used (don’t forget about long-tail here) is in the ad copy of the ad.
Yes, you can use dynamic keyword insertion for this, but for more flexibility, try SKAGs.
Negative keywords are your friends. For some reason, negative keywords are easy to overlook, but they should be paid close attention to. The search term report will show you the holes that need to be plugged. Plug them, but keep checking back to make sure another leak hasn’t sprung.
3. Use EVERY Ad Extension possible – Expected CTR Quality & Ad relevance
I see a lot of accounts once we take them over from another agency and it always confuses me as to why more ad extensions aren’t used. Not only do they give your ad more bling, but they also take up more space (this is really good on mobile), increase relevancy and drive up the click-through rate.
I understand that not all ad extensions will be relevant in every case, but use all that makes sense. Yes, some are more time-consuming than others but the more you use the better your ads will perform.
Take a look at the price extension. Can you use it? Then do it. It takes up a ton of space on mobile and can really drive your competitors down. Recently, Google announced that price extensions are now available on all devices.
Again, they take up a lot of space and, on desktop, look really cool. Need more of that bling I mentioned earlier? Well, here you go.
Also, make sure that you’re at least using location extensions (if you have a physical location), call extensions, structured snippets, site links, call-outs, and the message extension.
Sound like a lot? This is just the tip of the extension iceberg, make sure to use as many as you can. When it comes to extensions, remember that more specific is better. What I mean by that is that you can add account-level extensions but you’ll see better success if you narrow it down to the campaign level or, better yet, the ad group level.
Just remember to keep your eye on the prize, a better quality score.
4. Ongoing Ad Optimization – Expected CTR Quality & Ad relevance
One ad per ad group isn’t enough, neither are two. Google recommends at least 3 per ad group. The best way to get the best performing ads is by doing A/B split testing, even if you are using SKAGs. Also, think about copywriting and how you can turn a boring ad into a more compelling ad that invites a click.
The best way to ensure that your ads are highly targeted is to always write each one from scratch. Never stagnate, always try to beat your best performing ads by writing even more compelling copy for the next ad.
If you have long-tail keywords going to a highly converting ad then you are well on your way to increasing your click-through rate and your ad relevance.
5. Take a long hard look at your landing pages – Landing page experience
You wouldn’t send an ad about toothpaste to a page selling candy, would you? Rhetorical question, but sometimes it takes an absurd question to drive a point home. My point is that you should be as obsessed with making your landing page match the ad as you are about the ad matching the keyword.
That’s a great start but you need to go further than that.
First, make sure the landing page looks just as good on mobile as on desktop. Pay close attention to the speed of the page because Google has gone on record saying that 53% of smartphone users will abandon a web page if the site takes more than 3 seconds to load.
3 Seconds! Couple that with a recent study that shows we have an average attention span of just 8 seconds (1 second less than a goldfish) and you have a recipe for disaster if you aren’t careful.
While I won’t be going into depth about landing pages in this post I think it’s important to ensure that your landing page has a call to action. What’s a call to action? Anything that gets people to act on whatever it is that you want them to do. It can be a lead form submission, a download, a phone call or even watching a video.
Whatever it is it has to be very easy to do. Making people jump through hoops won’t lead to conversion. Having said that, if it’s not feasible to put the final call to action on the actual landing page, then you must make sure that your site is easy to navigate with a clear path to your desired conversion.
Take a long hard look at your landing page data and pay particular attention to what is happening in analytics. Are they converting? Are they following the path you’ve laid out for them? If not, why not? Take a look at the data from both the desktop and mobile perspective, is anything off? If so, fix it.
Don’t stop there
Keep optimizing. Don’t let your account, or your client’s account, slowly die. Stay active, make adjustments regularly, and become obsessed with raising the bar. Never stop until the bar is as high as it can possibly go. There has been a lot of talk over the years, even research done on the importance of account activity. So, stay active my friends.
This is a guest post. The views and opinions expressed by the author are solely their own and do not represent that of Optmyzr.
Your Responsive Search Ads (RSAs) are your brand’s first impression on the search results page. It’s the moment when a potential customer decides whether to click, explore, or move on to someone else.
Yet too often, RSAs are treated as an afterthought- hastily built, rarely tested, and left to “figure themselves out.”
The result is weak messaging and performance that never reaches its full potential. That’s why I decided to take a closer look at what truly makes Responsive Search Ads perform.
And here are the eight rules of thumb I personally follow when working with RSAs:
1. Should you use all the available headlines?
“Google recommends 15 headlines, so I should use all 15, right?”
Actually, it’s the opposite. I usually stick to around five strong headlines. This saves time, sharpens your messaging, and helps Google’s machine learning find winning combinations faster.
When you add too many headlines, you often dilute your message. Instead of 15 average lines, focus on 5 that clearly communicate your offer, product value, and intent.
Think of it less as “filling all the slots” and more as curating a set of your best angles.
Once those are live, the key is to understand which headlines are actually pulling their weight. Not every idea will perform equally well, and that’s okay.
The trick is to identify your winners and replace the weaker ones without wasting hours in spreadsheets or the Google Ads interface.
This tool breaks your Responsive Search Ads into individual parts: headlines, descriptions, and complete ads, and shows you how each is performing. You can instantly spot which headlines attract clicks/conversions and which ones might be holding you back.
It also offers AI-powered headline and description suggestions based on your ad data.
You can review, tweak, or apply those ideas directly, making it simple to test new variations without starting from scratch.
And if you need to clean up your ads in bulk, say, update an outdated offer or replace “AdWords” with “Google Ads” across all your campaigns, the Find & Replace feature handles it in seconds.
2. Combine broad and specific messages
When writing RSA headlines, I always mix broad messages with specific, intent-driven ones. Broad lines like “Shop the Latest Running Shoes” or “Free Shipping on All Orders” help your ad match a wide range of searches.
But it’s the specific ones, “Buy Nike Pegasus 40 Women’s Shoes” or “Trail Running Shoes for Rainy Weather,” that drive real relevance when users know exactly what they want.
The balance between the two is key.
Too broad, and your ads feel generic. Too narrow, and you miss bigger audiences. If you’re doing this manually, it can take time. That’s where Optmyzr’s A/B testing tool can help.
It automatically compares your ads in the same ad group and shows which ones are performing better based on real data, like CTR, conversions, or cost per conversion.
You can quickly spot which ad copy is winning, pause the weaker ones, and use insights from the best performers to create new variations.
And if you’re short on time, the AI suggestions are always there to help!
3. Use pinning thoughtfully
Pinning can be a great tool, but it’s one of the most misunderstood parts of Responsive Search Ads. I often see advertisers pinning far too many headlines or descriptions, trying to “lock in” what they think will perform best.
However, every time you pin, you reduce Google’s ability to test combinations and learn what actually works.
Pin only when it’s absolutely necessary, like keeping your brand name or a key promo message in a specific position (“Save 50% During Black Week,” for example).
Beyond that, trust the system to do its job.
Of course, it helps to have visibility into what’s pinned and how those assets perform, and that’s where the ad text optimization can help again!
4. Ensure relevance to keywords
I cannot emphasize this rule enough: include your main keywords in your headlines.
When someone searches for “Nike running shoes,” it feels natural and reassuring to see that exact phrase appear in the ad. It signals, “Yes, this ad matches what I’m looking for.”
Even small changes like swapping “Shop the Latest Shoes” for “Shop Nike Running Shoes” can lift your CTR and make your ads feel more personalized.
This isn’t just about optimization metrics; it’s about user experience.
People want to see their own language reflected back to them. It builds trust and helps Google understand your ad’s relevance, which can improve your Quality Score too.
So before you launch, take a moment to check: do your headlines truly echo what your customers are typing into the search bar?
5. Test, test, test
Responsive Search Ads are never “finished.” That’s the mindset I always keep. You don’t write a few headlines, launch the ad, and move on.
You test, learn, and adjust continuously. The trick is not to overhaul everything at once.
Small, gradual changes teach you more over time. Replace one weak headline, try a different call to action, or test a more specific message against a broader one.
Every small improvement compounds.
If you’re starting fresh or want to add new variations, the Create Responsive Search Ads tool can help you build them quickly.
It automatically looks at your existing ads, finds which headlines and descriptions have the best click-through rates, and suggests new combinations. You can review those suggestions, make tweaks, and upload them straight to your Google Ads account (without manual copy-pasting).
Once your new versions are running, you can also use A/B Testing for Ads in Optmyzr to compare their performance.
6. Use assets and extensions with RSAs
Responsive Search Ads work best when you support them with the right assets and extensions. Think of your RSA as the headline (the main story), and your extensions as the supporting details that make the ad more complete.
Sitelinks, callouts, structured snippets, and image extensions don’t just make your ads bigger; they make them more useful.
A sitelink can guide people to your most popular products or landing pages. A callout like “Free Returns” or “24/7 Support” adds confidence.
And image extensions help you stand out visually on a crowded results page.
These extra pieces do more than fill space: they give your ad context, personality, and a stronger reason to click.
7. Focus on a clear CTA
Even though Responsive Search Ads combine multiple headlines and descriptions, you still need one clear, consistent call to action.
Your CTA should tell the user exactly what to do next: “Shop Now,” “Book a Demo,” “Get a Free Quote.” Simple and direct always beats clever but confusing.
The mistake many advertisers make is trying to include too many CTAs in one ad. When every headline says something different: “Learn More,” “Buy Today,” “Sign Up Now,” the message becomes scattered, and the intent gets lost.
Pick one direction, make it visible in at least one headline and one description, and let the rest of the copy support that message.
A clear, confident CTA is like a final nudge; it turns attention into action.
8. Avoid pitfalls
If you can offer next-day delivery, definitely use it; it’s a strong selling point.
But if your delivery time is 14 days, it’s better to leave that out of your headline. Overpromising might win the click, but it will cost you trust later.
The same goes for exaggerated claims or outdated offers.
Your ad copy should be as honest as it is persuasive. If a competitor is promising something you can’t realistically match, focus instead on what you do best, maybe reliability, product quality, or customer service.
Still, mistakes and weak ads can slip through, especially when you’re running hundreds of campaigns. That’s where Optmyzr’s Rule Engine can save you time.
You can set simple rules, like “show me all RSAs that haven’t had any conversions in the past 30 days but are still getting clicks.”
Once you set that rule, Optmyzr will automatically flag those ads and group them in a report, so you can review and fix them before they waste more budget.
It’s a quick way to spot underperforming or risky ads early, whether that means poor ad strength, outdated messaging, or just a copy that’s not connecting anymore.
That way, you spend less time hunting for problems and more time improving the ads that actually work.
Make every RSA work smarter with Optmyzr.
Responsive Search Ads can look unpredictable from the outside, but once you understand how they learn, they become much easier to shape.
Follow these rules, keep testing, and stay honest in your messaging. Over time, small improvements add up to big wins.
And when you combine a clear strategy with the right tools, RSAs start feeling like one of the most powerful parts of your account. That’s exactly where Optmyzr can help.
Start your 14-day free trial today and see how smarter automation and better insights can take your RSAs and your overall account to the next level!
Sign up for more Google Ads tips at SavvyRevenue’s newsletter.
Morten Paamejer is a Senior PPC Specialist at SavvyRevenue, where he helps eCommerce brands grow through data-driven Google Ads strategies and smart account optimization. With a background in digital marketing and several years of experience at agencies like LAZZAWEB, Morten has developed a strong focus on scaling campaigns efficiently while keeping profitability top of mind.
This article is a reflection of the author’s experiences and opinions. Optmyzr believes that there are many ways to win in digital advertising, and is committed to presenting a diverse range of ideas and approaches.
On July 23, 2025, Amazon abruptly pulled all its ads from Google shopping. The move disrupted the paid search ecosystem almost overnight. As one of Google’s biggest and savviest advertisers, Amazon’s exit gave us a rare look at what happens when a major player disappears from the auction.
At Optmyzr, we analyzed data from thousands of advertiser accounts to understand the immediate impact. The results challenge a familiar belief: that less competition means better outcomes. They also offer lessons for brands adjusting to sudden market shifts.
Amazon didn’t wind things down or test a new strategy. They pulled out of Google shopping ads completely and without warning. That created a rare chance to see how Google’s ad auctions respond when a major bidder suddenly vanishes.
In Google’s auction system, advertisers compete in real-time for ad placements based on their bids, ad quality, and expected impact. When a major player like Amazon exits, they don’t just free up a few ad slots. Their absence reshapes the competitive landscape across every keyword, audience, and placement they used to touch.
Our analysis methodology
To isolate the true impact of Amazon’s departure from seasonal effects, we used a precise 7-day comparison methodology with the strictest account matching criteria:
Study period: July 16-22, 2025 vs July 23-29, 2025 Why this matters: We skipped Prime Day (July 8–11) and balanced the weekdays across both weeks. Dataset: Perfect account matching with identical advertiser pools in both periods Requirements:
Accounts must have 3+ days overall in both periods
Accounts must appear in the same shopping ads category in both periods
Accounts must have 3+ days within that category in both periods
This clean comparison lets us tie changes to Amazon’s exit rather than promotional calendar effects, day-of-week variations, or account churn.
Caveats: Conversion lag in ecommerce
Some ecommerce categories have longer paths to purchase. This means part of the conversion value may not have shown up in our initial 7-day window. A lower observed conversion value doesn’t always mean poor performance — it might just reflect a time lag.
To account for this, we’ll re-run the study using the same time window but pull data 30 days later. That way, we can measure any additional revenue that accrues over time and ensure the findings reflect true long-term performance.
Overall market impact: More volume, less value
The data tells a surprising story: less competition doesn’t always help the advertisers left behind.
Key Insight: Advertisers got more clicks for less money, but the value of those clicks dropped. It suggests many of those extra clicks came from people looking for Amazon. When they landed on competitor ads, they brought expectations around price, shipping, and convenience that few brands could match.
The consumer expectation trap
The standout insight: volume went up, but value went down. Advertisers saw:
8.3% lower CPCs — looks good on the surface
7.8% more clicks — more traffic, more chances
5.5% drop in conversion value — less revenue from that extra traffic
The pattern points to buyer behavior. Shoppers looking for Amazon clicked elsewhere, but still expected Amazon-level pricing, speed, and ease. When competitors couldn’t match these expectations, conversion rates and values suffered.
For PPC managers, this highlights the danger of the “volume trap”—celebrating increased traffic without considering whether that traffic genuinely aligns with your value proposition.
Category-by-category breakdown: Winners and losers
The impact varied dramatically across different industry verticals, revealing which types of businesses were best positioned to capitalize on Amazon’s departure.
Electronics: The clear winner
Electronics brands were best positioned to gain from Amazon’s exit. Big players like Best Buy and Apple can compete on the same things Amazon excels at: fast delivery, strong pricing, and trusted fulfillment.
Electronics was the only major category to see increases across all key value metrics: conversions (+81.3%), conversion value (+10.9%), and ROAS (+7.1%).
Despite a moderate increase in impressions (+11.4%) and clicks (+11.5%), these advertisers successfully converted the Amazon-displaced traffic at higher rates and values, likely because they could satisfy consumers’ expectations for fast, convenient delivery and competitive pricing.
Home & Garden: The volume puzzle
Home & Garden presents an interesting case study in the volume trap phenomenon, with significant traffic increases but declining value metrics.
The pattern—significant click growth (+13.1%) and stable cost (+0.2%) but declining conversion value (-7.5%) and ROAS (-7.7%)—suggests Amazon-seeking consumers found home & garden alternatives but made lower-value purchases or were more price-sensitive than typical customers.
Sporting Goods: The volume trap exemplified
Sporting Goods represents perhaps the clearest example of the “volume trap” phenomenon we’ve been describing.
This category saw substantial conversion volume increases (+20.7%) and improved conversion rates (+15.7%) with minimal traffic growth (+4.3% clicks), yet experienced significant value decline (-9.9%) and ROAS deterioration (-8.0%).
Likely explanation: shoppers landed on competitor sites, but bought cheaper gear or held back due to price.
Health & Beauty: Stable volume, flat value
Health & Beauty brands picked up the extra traffic, but couldn’t hold onto revenue per sale.
Despite achieving 14.6% more conversions from Amazon-displaced traffic, conversion value remained essentially flat (+0.3%). Translation: those new conversions were worth a lot less than usual. If quality stayed the same, revenue should have risen in lockstep. But thanks to new clicks being cheaper (-11.5%), ROAS slightly rose (+1.1%).
Tools and Hardware: Similar consumer expectation challenges
Tools and Hardware followed the same pattern as Sporting Goods — more conversions, but lower value.
Like Sporting Goods, this category captured significantly more Amazon-displaced conversions (+14.7%) with improved conversion rates (+7.1%) but struggled to extract the same value per conversion (-6.3% value, -5.9% ROAS), likely due to consumer expectations around pricing and convenience that Amazon had established.
Vehicles & Parts: High-value category decline
Vehicles & Parts showed concerning trends across both volume and value metrics.
Despite modest click growth (+4.8%) and reduced costs (-5.3%), the category experienced declining conversion value (-5.3%), suggesting that Amazon-seeking consumers in this category had different purchase behaviors or price expectations. But like Health & Beauty, the reduction in CPC (-9.6%) helped protect the ROAS (+0.1%)
Apparel & Accessories: Large volume, declining value
As the largest category by volume, Apparel & Accessories demonstrates the volume trap at scale.
Despite representing the largest volume of traffic, Apparel & Accessories saw declining performance across key metrics, with conversion value dropping 9.5% and ROAS declining 7.3%. This suggests that Amazon-seeking fashion consumers had strong expectations around pricing, selection, and return policies that competitors struggled to match.
Arts & Entertainment: The content value challenge
Arts & Entertainment showed mixed results, with increased traffic but declining conversion metrics.
This category achieved significant click growth (+15.4%) but saw concerning declines in conversion rate (-19.9%) and ROAS (-8.3%), suggesting that displaced Amazon traffic in entertainment categories had different engagement patterns or value expectations.
Furniture: Stable volume, value concerns
Furniture presents an interesting anomaly with stable click volume but declining conversion value.
The pattern—stable clicks (+0.8%) and conversion volume (+2.0%) but dramatically lower conversion value (-11.7%) and ROAS (-8.8%)—suggests a fundamental shift in purchase behavior. Despite reduced costs, the significant value decline indicates consumers may have been purchasing lower-priced items or single pieces rather than complete furniture sets.
What this means for your Google Ads strategy
Different categories reacted in different ways — but the patterns offer clear takeaways for PPC teams:
1. Assess your competitive position against Amazon’s value proposition
Electronics succeeded because major players like Best Buy and Apple can match Amazon’s delivery speed and pricing. In contrast, most other categories saw the classic “volume trap”—more traffic but less value as Amazon-seeking consumers brought different expectations.
2. Recognize the volume trap early
Categories like Sporting Goods (+20.7% conversions, -9.9% value) and Health & Beauty (+14.6% conversions, +0.3% value) show how increased traffic can mask underlying performance degradation. Always track value, not just volume.
3. Learn from true success vs. volume traps
Only Electronics truly succeeded with positive conversion value (+10.9%) and ROAS growth (+7.1%). Everyone else hit some version of the volume trap — more clicks, but less to show for it.
4. Understand your category’s vulnerability
If you compete on Amazon’s turf — price, speed, convenience — you’re more exposed. The data shows widespread expectation mismatches across these categories.
5. Focus on sustainable competitive advantages
Rather than simply trying to capture displaced Amazon traffic, develop positioning that attracts consumers who genuinely value your specific offerings.
Why displaced traffic isn’t free traffic
Amazon’s exit highlights something critical: traffic doesn’t shift cleanly when a dominant player leaves. It drags along expectations most brands can’t meet — fast shipping, low prices, and frictionless buying.
That creates the volume trap: cheaper clicks, more traffic, and worse results. Unless you can actually match Amazon’s offer, you’ll struggle to turn those clicks into value.
For the Google Ads ecosystem, this suggests that major ecommerce advertisers play a crucial role not just in competing for inventory, but in training and conditioning consumer expectations. When they leave, shoppers don’t reset. They carry their shaped expectations into your funnel, whether you can meet them or not.
Takeaways for PPC advertisers
What PPC managers should take from all this:
Distinguish true success from volume traps
Only Electronics achieved both volume and value growth. Most categories experienced some form of the volume trap with declining efficiency.
Monitor ROAS alongside conversion metrics
Flat or growing conversion volume can hide declining profitability if conversion values decline or costs increase.
Evaluate displaced traffic quality
Amazon-seeking consumers bring specific expectations that most categories couldn’t meet profitably, leading to either lower conversion values or conversion rate declines.
Consider lifetime value implications
The only justification for accepting lower immediate ROAS is if the additional traffic represents new customers with strong repeat purchase potential.
Focus on sustainable differentiation
The successful Electronics category could match Amazon’s value proposition, while others struggled when competing on Amazon’s core strengths.
Displaced traffic isn’t neutral — it’s shaped by the brand that left. And unless you can meet those expectations or grow LTV fast, it’s traffic you’ll struggle to monetize.
As technology advances and privacy legislation evolves, Meta Ads has adapted accordingly, altering how we reach and connect with audiences on the way to accomplishing our advertising goals.
Behind the scenes, we have Andromeda, Meta’s next-gen ML engine that processes billions of signals to match ads with users in real time. Then we also have the Advantage+ campaigns on the front lines. These span sales, app installs, and now even lead gen. It can automate targeting, creative testing, and budget allocation for peak efficiency
Clearly, we have moved from the hyper-segmentation of audiences and reliance on interest and behavioral targeting to seeing the rise and fall of many custom audiences, such as lookalikes. Now, AI does the heavy lifting, excelling at identifying our target audiences that are most likely to take the actions we specify.
In this guide, we’ll walk through the latest Meta Ads targeting strategies that will help you successfully find and engage customers.
Demographic and detailed targeting for all brands
Before we cover the strategies that I (and many other advertisers) find works best at the moment, let’s address all currently available targeting options—both new and old.
Understanding all of the options helps you determine what type of targeting you want to test to see what works best for your brand, goals, budget, and time so you know exactly where to start.
Depending on the selected campaign objective, in the ad set level, under “Audience controls,” you will see demographic targeting options that include location, age, and language (if you only see location targeting, click the “show more options” link to see age and language options). These are the primary controls for your targeting.
“Choosing a broad area to show your ads within can improve results,” Meta recommends within Ad Manager, “For example, by adding a country instead of several cities.” In my geo-targeting tests, I’ve found that to be accurate as well.
Interest and behavioral detailed targeting
When it comes to detailed targeting, you can target by interests, behaviors, and other demographics. Meta has long been renowned for its precise targeting capabilities, enabling advertisers to find innovative ways to reach their audiences.
However, with the evolution of privacy laws, advertisers have lost many detailed targeting options, decreasing their effectiveness over the last few years.
This doesn’t mean you should abandon these options entirely, but it’s important to note that targeting has (and will continue to) evolve. This shift might indicate a future where traditional targeting methods, such as detailed targeting, may be obsolete. Instead, we’ll likely rely more on machine learning to identify the individuals most likely to achieve our campaign objectives.
If you’re interested in using these targeting options as a standalone test or in conjunction with Advantage+ audiences, you can access them in the “Advantage+ audience” menu (if you don’t see it, click the “Audience suggestion (optional)” button to reveal it).
Detailed targeting for niche brands
If you work for a brand targeting specific job titles (e.g., nurses) or selling niche products (e.g., specialized automobile parts, solar panels, wine), consider using detailed targeting.
This approach can help you gauge effectiveness against broader targeting options, like Advantage+ audiences (which I’ll cover in a later section). You can manually input relevant keywords to see related suggestions, bundle these audiences together for a larger audience to target, and explore other demographics, such as education, relationships, finances, and more.
Make sure to test various strategies to more accurately determine the best approach to reach your desired audience.
It’s also important to remember that niche targeting often means smaller, so you need to watch it closely. If your audience is too narrow, your campaigns may struggle to exit the learning phase, resulting in higher CPMs and inconsistent performance. Track performance visibility and delivery metrics early to decide whether to expand your audience or rethink your segmentation.
Test a few combinations to see what drives the best engagement, then double down on the highest-value segments.
Ecommerce should use Advantage+ shopping campaigns
If you work in ecommerce, consider using Advantage+ Shopping Campaigns (ASC), which offer a more streamlined approach. These campaigns utilize broader targeting, and the only option you can edit is location.
If you’re not in ecommerce, other campaign types (such as the one for leads) feature a more simplified setup with fewer targeting options at the ad-set level. These AI-driven, simplified targeting campaign structures rely on broader targeting and fewer restrictions to deliver better results.
Also, since targeting is largely locked down, your creative becomes your main lever for differentiation. Test multiple variations—formats, messaging, visuals, to feed Meta’s AI with the data it needs to optimize performance. Larger creative libraries can help campaigns exit the learning phase faster and stabilize performance.
💡Pro Tip: Optmyzr’s Rule Engine allows you to automate monitoring. For example, you can create a custom strategy that flags ads with rising cost per result or dropping CTR. Both are early signs of fatigue. The Rule Engine shows suggestions and even lets you automate fixes, so you don’t have to manually check performance every day.
Create custom audiences for prospecting and retargeting
Meta offers an option in the Audiences area of Ads Manager where you can set up custom audiences using customer or lead contacts, website traffic, app users, or Meta’s data (e.g., engagers) for your inclusion or exclusion targeting, for both prospecting and retargeting campaigns.
You can set up a variety of custom audiences using your sources or Meta sources, such as:
Each of the available custom audience types has a retention time lookback window. I typically recommend a longer lookback window so that you have a larger audience pool—this helps the system better serve your ads, with more people seeing your ads, so they will not be saturated as quickly as smaller audiences.
In Optmyzr’s Social Campaign Manager, you can create and organize your custom audiences, then link them directly to new or existing campaigns.
Commonly used custom audiences
Here is a list of some common custom audiences advertisers use for prospecting and retargeting that you may also want to consider:
Website visitors
Leads
Newsletter subscribers
Customers
People who viewed your products in your catalog
Facebook engagers
Instagram engagers
Many of the above are warmer audiences that you can use in your retargeting efforts (or exclude from your prospecting campaigns).
While some advertisers still swear by exclusions, others do not, as some have found that (with privacy changes) they are not as effective as they once were. But again, I encourage you to test; the worst that may happen when implementing them is that they won’t actually exclude some people.
You can also create lookalike audiences from the custom audiences above and utilize them in your prospective campaign targeting to reach new people.
Lookalike audiences and how to use them
A ‘lookalike’ audience is an audience that looks like your original audience, but is composed of new people. For example, if you create a customer lookalike audience, Meta will create a new audience of people that look like your customers—based on the interest and behavioral data that Meta Ads has—which you can use to find more people that may be more likely to convert.
You can designate a percentage of deviation when setting up a lookalike audience. The lower the percentage, the more similar the new audience will be to your initial audience. The larger the percentage, the broader and less similar it will be to your initial audience. I typically recommend testing 1% first and then gradually testing larger percentage lookalike audiences to see if you can achieve more or better results.
Leverage Advantage+ audiences for scalable growth
Although you still have access to the targeting options I explained above, you may have noticed that Meta is making detailed targeting less accessible (often hiding it within dropdown menus). Many advertisers, including myself, foresee detailed targeting eventually disappearing, given the gradual removal of older options.
Even so, don’t let this trend deter you from testing detailed targeting. Instead, use it in conjunction with broader targeting options, such as Advantage+ audiences.
The Advantage+ audience option in the ad-set level uses Meta’s ad technology to automatically find your audience, and it does so quite efficiently.
With Advantage+ audience targeting, you can add a suggested audience to help the system identify your target audience more effectively. This enables the system to prioritize specific criteria to find individuals that closely match your desired profile before broadening the search. Additionally, you can adjust the age and gender of your audience and apply detailed targeting (as discussed earlier).
Over the past year of testing with Advantage+ audiences, I’ve tested targeting some warmer custom audiences (like website visitors, leads, and engagers) to using no suggested audiences at all. My findings indicate greater success when I leveraged Meta’s data-rich, in-platform audiences over my client’s email lists and pixel data. In particular, Facebook and Instagram engagers over the last 90 days were the top-performing audiences.
This means that you will target both warmer and cold audiences in one ad set, so your creatives need to work double duty—balancing credibility and brand trust with clear value props for new users. A/B testing different creative formats and messaging is especially crucial here, since Advantage+ campaigns optimize based on performance signals.
When it comes to targeting, this has become my go-to strategy to find more customers that convert at higher volume, rates, and returns compared to all of the others that are currently available and shared in this article. I highly recommend testing this approach in your account(s) while also testing others (if your budget allows).
To make that process easier, you can use the Ad Analyzer to track creative performance across Advantage+ campaigns. You can filter ads by declining CTR or rising costs per result, helping you catch fatigue early and pinpoint which formats or messages are pulling their weight.
Use saved audiences for better efficiency and consistency
Save time by saving audiences whenever you create manual audiences to test alongside broader targeting campaigns and ad sets. This allows you to easily resume the audience in the future for other campaigns, without the need to recreate it from scratch, allowing you to launch your social campaigns faster.
In the ad-set level (under Advantage+ audience, below all of the targeting options), there is a “Save audience” button you can click. A pop-up window that summarizes the audience will appear and give you the option to name it so you can easily locate it later.
Improve ad spend efficiency with exclusion audiences
While exclusion audiences don’t flawlessly exclude every person in them (due to the nature of privacy, technology, and match rates), they can still help improve your ad spend efficiency by not targeting some people. This can also help prevent ad fatigue among existing customers, avoid showing ads to irrelevant users, and improve performance —especially when you’re looking to scale without letting wasted spend sneak in.
How to Create Exclusion Audiences
To create an exclusion audience, follow the same steps (from above) as you would to create any custom audience. When it’s set up, populated, and ready to use, go to the ad-set level and under “Audience controls,” enter the name of your custom audience in the “Exclude these custom audiences” field.
Use Cases for Exclusion Audiences
During the hyper-segmentation era of paid marketing, exclusions were much more commonly and effectively used; but now, they are less effective in excluding people. At the same time, however, Meta’s targeting has improved.
In some instances, the most common use of exclusion audiences these days is in retargeting campaigns where advertisers exclude recent customers, leads, or purchasers, in order to preserve budget but also to avoid bombarding existing customers with more ads.
Create high-impact ads
Well-crafted ad copy increases the likelihood that your message resonates with your prospective customers, while creative elements like images and videos complement and enhance engagement to drive higher conversion rates.
Together, they create a cohesive, persuasive, and successful ad experience that effectively reaches and motivates your intended customers.
Best Practices for Compelling Ad Copy
When writing ad copy, consider your audience. Craft your ad copy to speak directly to them using language, tone, and references that resonate with pain points, their interests, familiarity with your brand, and how your product or service is a solution or benefit to them.
Use clear and concise copy so that people take the action you want them to (such as learning more, signing up, or shopping now). Get to the point quickly and avoid jargon so that there is no confusion.
While ads contain automatically embedded call-to-action (CTA) buttons, it’s also effective to clearly state what you want the viewer to do in the ad copy (e.g. learn more, sign up, shop now). Make it easy and intuitive for people to know what they should do next, leading them from the ad to the landing page.
If you are running sales or promotions, highlight these alongside unique selling points, special product features, limited time offers, or free shipping details.
Lean in to persuasiveness by adding customer testimonials, reviews, and statistics as that can increase trust and credibility.
Additionally, use urgency (especially in retargeting ads) to encourage immediate action so people don’t miss out on the sale or before a product runs out. Here is a great example of a customer review used very effectively in a clothing ad.
I too, often use five-star emojis on review ads to help draw more attention to them and to visually portray that it’s a well-rated product.
Tips for Creating Effective Images
For images, take high-resolution shots that are clear and visually appealing from various angles.
Make sure the focus remains on the product to prevent any confusion about what you are advertising.
Often, in full-body model images, I’ve seen comments on ads where people ask about where they can purchase various parts of the outfit when the brand intended to promote their jewelry. By concentrating on a single, clear message or product, you can improve performance.
Use minimal text overlays to ensure legibility on small screens and make sure the text complements your visuals.
Tips for Creating Effective Videos
Put your best foot forward in the first three seconds so that you can hook people in and they know exactly what you are advertising. No matter how interesting, entertaining, or helpful your video content is, people will drop off and continue scrolling if it’s not clear what they’re watching.
To improve view-thru rates and conversions, start with an intriguing question, compelling statement, or a striking visual in the first few seconds.
Optimize your video for silent viewing by including text overlays or captions so that your message is clear, even without sound, as this is essential for hearing-impaired viewers or those watching on mute.
The visuals alone should tell the story effectively. Here’s a great example from Ruggable, where the video ad starts with a compelling question:
As for video length, keep it short and ideally about 15–30 seconds. Shorter videos help you maintain viewer interest and convey more of your message concisely.
Lastly, close out your video with a strong call-to-action.
As you get started on creative asset development, understand the various ad placements across Meta’s properties and their specs, so your ads appear optimally and increase your chances for success.
Bringing it all together: Craft a comprehensive strategy for success
Understanding the various targeting options within Meta Ads will help you determine which ones are worth prioritizing for your advertising goals. Lean into the newer features to see what they are capable of so that you don’t fall behind on your advertising skills (which can ultimately hinder campaign success).
If your budget is limited, prioritize testing the more streamlined, AI-assisted targeting campaigns first alongside your current (or older) top performers and, as you gain more conversions, phase out the under-performing campaigns and assets.
Perpetual testing is a big portion of our role in social media advertising, so get comfortable in doing so and creating a process.
As you move forward, the ability to adapt and get creative will be key to your growth and success. By merging strategic targeting with high-impact creatives, you can create a comprehensive strategy that both engages and converts your audience.
As Meta Ads continues to evolve, test new ideas and targeting options, as that will help keep your campaigns thriving.
If you’re looking for a smarter way to manage Meta Ads across campaigns and clients, Optmyzr for Social brings everything under one roof—campaign setup, performance tracking, and optimization. Try it free for 14 days and see how much smoother your social workflow can be.
People also ask
Q. What are the different targeting options available in Meta ads?
Interest and behavior-based targeting, which spans interests, purchase behavior, tech usage, and more
Custom audiences, including website visitors, app users, CRM lists, and engagement-based segments
Lookalike audiences, which target new users resembling your custom audiences using Meta’s modeling
Advantage+ audiences, Meta’s AI-driven targeting option that automates audience matching using broad signals instead of manual settings
Q. What types of custom audiences can I create in Meta Ads?
A. You can build diverse custom audiences in Meta Ads, including:
Website visitors tracked via Meta Pixel
App activity users based on in-app actions
Customer/contact lists using email, phone, or user ID matches
Engagement-based audiences, such as people who’ve interacted on Facebook or Instagram (e.g., likes, comments, video views) These audiences are useful for both prospecting and retargeting campaigns, and can be used to create lookalike audiences for expansion
Q. What’s the best targeting strategy if I have a limited budget?
A. With constrained budgets, it’s recommended to:
Test Advantage+ audience campaigns first, as Meta’s AI handles much of the optimization work
Pair these with well-performing custom audiences like recent engagers or past buyers
Pause manual targeting sets if they underperform, ensuring spend is focused on strong signals
Keep creative quality high—since AI relies heavily on signal inputs, your creatives help Meta learn faster. This mix of broad AI-assisted reach balanced with targeted retargeting maximizes efficiency and results
Akvile DeFazio is the President of AKvertise, an award winning social media advertising agency. With 16 years of experience, she works with eCommerce, lead gen, app, travel, and event clients to reach their goals through future-forward strategies.
This article is a reflection of the author’s experiences and opinions. Optmyzr believes that there are many ways to win in digital advertising, and is committed to presenting a diverse range of ideas and approaches.
When Google launched Performance Max (PMax), it was positioned as the ultimate automated campaign, designed to unify and optimize ads across all of Google’s channels: Search, Shopping, YouTube, Display, and more.
But as many advertisers have found, adding PMax to the mix isn’t always additive. In fact, it might be quietly cannibalizing the performance of your most valuable Search campaigns.
At Optmyzr, we wanted to know just how often this happens and how much impact it has. So we dug into performance data from hundreds of accounts to see where and when PMax overlaps with Search.
The results might surprise you…
Why we ran this study
Advertisers love the control and predictability of Search campaigns. Performance Max, on the other hand, provides less control and is, by design, more opaque.
However, advertisers are encouraged to use both campaign types in tandem, with Google advising that the keywords added to a search campaign should nearly always take precedence over the automated matching done by PMax. They even tell us, “If the user’s query is identical to an exact match keyword in your Search campaign, the Search campaign will be prioritized over Performance Max.”
Scenarios 1-3 in the following table illustrate what that prioritization is supposed to look like.
Prioritization of Ad Serving When Search and Performance Max Compete
Scenario
Keyword
Keyword Match Type
Search Term
Which campaign serves the ad?
Why?
1
Flowers
Exact
Flowers
Search campaign is prioritized
The keyword text is the exact same as the search term text
2
Flowers
Phrase
Flowers
Search campaign is prioritized
The keyword text is the exact same as the search term text
3
Flowers
Broad
Flowers
Search campaign is prioritized
The keyword text is the exact same as the search term text
4
Flowers
Phrase
Flowers Near Me
Depends - Campaign with better ad rank wins
The keyword and search term text are different
5
Flowers
Broad
Deliver Roses
Depends - Campaign with better ad rank wins
The keyword and search term text are different
Scenarios 4 and 5 show what happens when a keyword with the same text as the query doesn’t exist in the search campaign, but a broad or phrase match could have triggered the ad. In those scenarios, auction-time signals are used to decide whether to serve an ad from Search or PMax.
But in practice, many advertisers suspect that PMax is crowding out their Search campaigns, even for keywords they specifically target. They suspect that what actually happens is different from what is explained in the table of what is intended to happen.
So we set out to answer key questions like:
How often does the PMax campaign show an ad for a keyword that exists in a search campaign?
Are the same search terms showing up in both PMax and Search?
Does this overlap happen across all match types?
Which campaign delivers better performance when there is an overlap?
How we ran our search term overlap study
For this study, we reviewed data from February 1 to February 28, 2025, across 503 accounts managed in Optmyzr.
Our analysis had two parts:
Part 1: Exact keyword overlap
We looked for keywords in Search campaigns that also appeared in the PMax search terms report, indicating that PMax triggered ads for keywords explicitly targeted in the advertiser’s Search campaign.
Here’s what that looks like in reports we pulled:
A sample from the data we pulled shows when a search campaign’s keyword text is exactly the same as the search term’s text that triggered a PMax ad.
Note that the text of the keyword is the exact same as the text of the search term that triggered the PMax campaign to show an ad. The keyword match type doesn’t matter; we just check that the text is an exact match.
In our table of scenarios, this would correspond to scenarios 1, 2, or 3.
Part 2: Search term overlap
We checked for search terms that showed up in both PMax and Search campaign reports, and that were not exact matches for an existing search campaign keyword. This indicates that the search campaign contained relevant keywords that could have shown the ad, but sometimes the PMax campaign won the auction and showed the ad for that query.
In our table of scenarios, this would correspond to scenarios 4 or 5.
In both parts, we compared performance for CTR and Conversion Rate. We defined performance differences as “insignificant” if they were under 10% different. We did not include CPC, CPA, and ROAS because Google did not report cost data for PMax search terms at the time of our analysis.
The findings: Keyword overlap is real
When a search campaign contains a keyword whose text matches the search term exactly, Google says the search campaign should be prioritized. What we observed indicates that this prioritization is not what advertisers would expect, and Performance Max frequently cannibalizes the search keyword.
The reason could be that the search campaign was ineligible to show an ad due to targeting or budget constraints. We did not analyze that possibility in this study.
Prevalence of Performance Max cannibalizing search keywords
Accounts: 91.45% of 503 accounts had keyword overlap between Search and PMax.
Campaigns: 56.29% of 5,768 Search campaigns showed this overlap.
Ad Groups: 27.86% of 40,642 ad groups were impacted.
The overlap was identified for all match types, including exact match keywords. So, having a keyword with the exact text of a search term, and making it an exact match keyword, does not guarantee that the overlap won’t happen.
Performance difference when Performance Max cannibalizes search keywords
Ultimately, advertisers care about performance and would likely not complain if Google’s automation did something that led to better financial outcomes for their campaign.
Unfortunately, it’s not possible to measure ROAS differences because PMax campaigns don’t report revenue data at the search term level. So we analyzed two important metrics for which data is available: CTR and conversion rate.
CTR results:
Search campaign performed better: 28.37%
Performance Max campaign performed better: 15.98%
No significant difference: 55.65%
Conversion rate:
Search outperformed PMax: 18.91%
PMax outperformed Search: 6.17%
No significant difference: 74.92%
Takeaway
In most cases, when PMax overlaps with existing search keywords, the performance difference is not significant. However, when the difference exceeded 10%, the search campaign was more often the campaign type with the better performance.
Search term overlap between PMax and search campaigns
This is part 2 of the study. There was also an overlap between Performance Max and Search campaigns when there was no keyword that matched the search query exactly.
This was expected and aligns with Google’s guidance that Ad Rank is the determining factor in these instances. We measured how often this type of overlap exists and how the performance differs.
Accounts: 97.26% of 511 accounts had search term overlap.
Search Campaigns: 76.17% showed overlap with PMax.
PMax Campaigns: 97.40% overlapped with Search campaigns.
Performance difference when Performance Max and search overlap
CTR (424,820 search terms analyzed):
Search won: 32.37%
PMax won: 24.21%
No significant difference: 43.42%
Conversion rate:
Search better: 7.66%
PMax better: 4.32%
No significant difference: 88.03%
Takeaway
Overlap is nearly universal, but performance differences are usually minor. But again, when there is a difference greater than 10%, Search is more likely to be the better-performing campaign type.
Why this matters: Efficiency and control
When PMax runs alongside Search and targets the same queries, it creates internal competition. That means:
You might pay more for clicks that Search could have delivered more efficiently.
You lose control over which creative or audience drove results.
You can’t fine-tune performance as easily because PMax aggregates reporting across channels.
And while PMax is supposed to avoid this overlap, our data shows otherwise.
What advertisers should do
If your Search campaigns are losing impressions to PMax, you’re not alone, and you’re not powerless. The key is to understand that cannibalization isn’t just a function of overlapping keywords. It often happens because your Search campaign becomes ineligible to serve ads in the first place.
That ineligibility can stem from mismatches in location targeting, ad schedules, audience exclusions, or budget constraints. For instance, if your Search campaign doesn’t have enough daily budget to stay active or is limited by a narrower geographic focus, Google won’t even enter it into the auction, leaving PMax to pick up the traffic by default.
To protect your Search performance and regain control:
Use Search Term Insights (e.g., from Optmyzr) to identify where PMax overlaps with Search. When you find converting terms in PMax that aren’t in your Search campaigns, add them as exact match keywords to shift priority back to Search.
Align your campaign settings — check your targeting, bids, and budgets — so Search campaigns remain eligible across the full range of impressions you want to capture.
Turn off auto-apply recommendations that remove “redundant” or “non-serving” keywords. These automated changes often strip your campaigns of the very keywords that protect them from PMax encroachment.
Add branded misspellings as exact match keywords to Search. Even with brand exclusions enabled, PMax can still trigger ads for fuzzy matches that dilute your brand’s performance data.
Remember, PMax thrives when there’s a gap, either in eligibility, bid competitiveness, or keyword coverage. Your job is to close those gaps. Use PMax where it performs best: as a complement to your Search campaigns, not a replacement for them.
Final thoughts
Performance Max can be powerful, but only when it complements, not competes with, your Search campaigns. As this study shows, Google automation’s promise still needs human oversight to reach its full potential.
Search campaigns give you control. PMax gives you scale. But only when you manage both thoughtfully can you truly maximize performance.
Most people assume Q4 is the busiest time of year. But assumptions aren’t analysis.
Every business experiences seasonality differently. Understanding your specific demand patterns—when performance surges or slumps—is how you allocate budgets smarter, optimize campaigns, and predict what’s next.
You don’t need a data science team. You don’t need a PhD in statistics. You need a clean export, a bit of prep, and GPT. Let’s break down how to do seasonality analysis using ChatGPT.
This approach draws heavily on insights shared by Cory Lindholm during one of my PPC Town Hall podcasts, where he talked about seasonality analysis, offering a straightforward way to sharpen your PPC strategy.
What is seasonality analysis?
Seasonality analysis is about pattern recognition. It uncovers recurring spikes and dips in performance over time, helping you stop reacting and start planning.
If you’ve ever wondered:
“Why did conversions tank last May?”
“When should I start ramping budgets for the holidays?”
“Are these results an outlier or a trend?”
Then you’re already looking for seasonality. A formal analysis just answers those questions with data, not guesswork.
What is seasonality decomposition?
It’s the process of splitting your time series data into three parts:
Trend – the long-term movement (up or down)
Seasonality – the predictable ups and downs (e.g., Q4 spikes)
Residual – the randomness (e.g, a one-off campaign anomaly)
Multiplicative: when changes grow with volume Y(t) = T(t) × S(t) × R(t)
That’s the math out of the way. Here’s how GPT does the heavy lifting for you.
How to perform a seasonality analysis using GPT
Here’s the step-by-step process I followed, including a few important checks to ensure reliable results.
Step 1: Export your weekly PPC data
Start with Google Ads Report Editor. Create a report that includes the metrics you want to analyze, such as clicks or conversions, and include “Week” as a row dimension. This creates the time series structure needed for analysis.
Export the report as a CSV file. To get the most out of GPT’s analysis, use at least one full year of weekly data. Seasonality decomposition relies on repeated patterns, so anything shorter may produce misleading or incomplete results.
Step 2: Ensure your data is clean and complete
Before uploading the file, review your data for inconsistencies. Check for missing weeks, duplicate entries, or formatting issues such as commas in column headers or entity names.
In my test, GPT detected and corrected formatting problems automatically. However, starting with clean input data improves reliability and reduces the chances of errors during analysis.
Step 3: Upload the dataset to GPT-4o
Use GPT-4o with the Advanced Data Analysis model. After uploading your CSV, use a prompt like: “I have weekly ads data. Can you perform a seasonality decomposition on it?”
GPT will load your data and ask which metric you want to analyze. You can choose clicks, conversions, or any other time-based KPI included in your report.
Then it asked me which of the KPIs I wanted to analyze for seasonality and replied with: “The data has been cleaned and displayed for your review. Now, I’ll perform the seasonal decomposition on one of the metrics, like Clicks or Conversions, depending on which one you’d prefer to analyze. Should we proceed with Clicks, or would you prefer a different metric?”
I responded with the prompt: “Please perform decomposition on Clicks.”
GPT then responded with the following chart:
Additional tips:
If you want to explore the underlying trends, seasonal patterns, and residual variations in your dataset (like clicks, conversions, or other metrics) across weekly time periods, you can perform time series decomposition.
Clicks Decomposition Example: Decompose your clicks data to understand the trends (e.g., steady growth or decline over time), seasonal patterns (e.g., weekly or monthly peaks and troughs), and residuals (random fluctuations).
Data Characteristics: Based on your uploaded data (with Week as a time series indicator), decomposition can show how much of your clicks or conversions are driven by long-term trends versus recurring patterns.
Model Type: You can use an additive model if the seasonal variation remains consistent over time. Alternatively, use a multiplicative model if the variation grows proportionally with the level of the data (for example, during periods of high traffic).
There are several ways to expand on this.
Analyze by product lines or business segments
Break Down by Product Categories: Segment your analysis by product lines or business units instead of looking at overall data. This helps identify which products or services are more seasonally affected, allowing for precise budget allocation.
Sample Prompt: “Can you help me run a seasonality decomposition on my weekly data, but split by product categories?”
Brand vs. Non-brand analysis
Compare Performance: Separate your data into brand and non-brand traffic or sales, then decompose each time series. This can reveal if branded campaigns follow different seasonal patterns than non-branded ones.
Sample Prompt: “Can you help me decompose my time series data into brand and non-brand categories?”
Agency-level analysis: Vertical vs. advertisers
Vertical Trends vs. Individual Clients: As an agency, you can run a vertical-wide seasonality analysis and then compare individual advertiser data against these industry benchmarks. This allows you to provide insights into how clients perform relative to the industry and make tailored recommendations.
Sample Prompt: “Can you help me analyze a vertical’s seasonality and compare individual advertiser data to it?”
Forecasting PPC budget requirements
Predict Budget Needs: Use the trend and seasonal components to forecast future performance. This will help you predict when budget increases will be necessary to maximize return on ad spend (ROAS). This is particularly useful for managing Q4 budgets effectively.
Sample Prompt: “Can I use the trend and seasonal data to forecast my PPC budget requirements for the upcoming months?”
Seasonality insights for inventory management
Optimize Stock Based on Seasonality: For businesses with physical or e-commerce products, understanding seasonality can help forecast inventory needs, ensure enough stock during peak periods, and reduce surplus during off-peak times.
Sample Prompt: “Can seasonality analysis help me forecast inventory requirements by product line?”
Optimize marketing strategies
Tailor Campaigns to Seasonal Peaks: Use the seasonal component to adjust your PPC or display advertising strategies, targeting higher-intent periods for specific products, and plan remarketing efforts during off-peak times.
Sample Prompt: “Can you suggest strategies to adjust my marketing campaigns based on seasonal trends?”
Cross-compare channels
Analyze Seasonality Across Multiple Channels: To gain deeper insights into your marketing efforts, you can run seasonality analysis across different channels (e.g., Google Ads, Facebook Ads, organic traffic) to identify patterns such as which channels perform best at different times of the year. This lets you optimize your ad spend and focus on the most effective platforms during key periods.
This process is made easier by simply swapping the datasets you use for each channel. Whether you’re analyzing clicks, impressions, or conversions for Google Ads or Facebook Ads, the same approach applies; just change the dataset to reflect the relevant channel.
Sample Prompt: “Can you help me run seasonality analysis across different marketing channels?”
Fine-tune your PPC campaigns for maximum efficiency.
You already have the data. Seasonality analysis turns it into leverage.
It’s how you stop chasing performance and start anticipating it. With a single GPT prompt, you can surface trends your competitors are still guessing at. Forecast demand. Time your spend. Outsmart seasonality instead of getting blindsided by it.
No more “gut feels.” No more blown Q4 budgets. No more surprises.
Just sharper campaigns, better timing, and marketing that actually plans ahead.
You’re not just reacting to seasonality. You’re using it.
It goes without saying that the key to growth for ecommerce businesses is selling more products. Sounds simple. And obvious. But a lot of businesses aren’t looking closely enough at each product when planning how to achieve sustainable growth and stand out amongst the competition.
Product feed optimization is increasingly important for AI-driven signals and intent in search results.
Yes, having an aesthetically pleasing website with good UX, easy navigation, desirable high-quality products, and good customer service is important.
But search engines don’t focus on the pretty stuff.
First, they read the details. The words. The descriptions. The most identifiable attributes and information that make your products unique and in demand. Think function over form.
Screenshot shows improvements after simple product feed optimizations completed for a high-value furniture manufacturer
Why is feed optimization so important?
In basic terms, a product feed (or datafeed) is a structured way of submitting product information from your website to another source, such as Google Merchant Center.
One of the best ways to improve results for ecommerce businesses is to focus on product feed optimization to increase visibility, relevancy, conversion rate, and conversion value. This is crucial for businesses running Google Ads, particularly Shopping and/or Performance Max campaigns.
Not only can this positively impact performance for paid shopping placements, but it can also improve results in organic search (free listings).
Note: While this also applies to Microsoft Ads and other PPC channels, this article focuses on opportunities specifically within Google Merchant Center (GMC).
Here are four ways to optimize your product feed for Google:
Directly add & optimize rich product attributes for all products.
Create feed attribute rules in GMC.
Create and upload a supplemental feed.
Use a 3rd party tool for feed management and support.
Now, let’s see what the most important attributes you should be using to improve your product listings, examples of attribute rules in GMC, supplemental feeds, and some of the shopping ads solutions offered by Optmyzr to help make management easier and more efficient.
Key product attributes for feed optimization
There are obvious things a customer needs to know before making a purchase, such as what a product does, what it looks like, and how much it costs.
Google specifications outline what information is needed to submit products to Google Merchant Center, including which details are required and which are optional.
Surprisingly, a lot of businesses only complete the minimum requirements for feed approval. This means there is an opportunity to further improve what is submitted, in addition to providing more meaningful and helpful product details that are optional.
From a paid search perspective, feed attributes have been a focus of optimization tactics for several years. There has now been even more awareness of the importance of product attributes for SEO since the launch of Google Merchant Center Next.
This is partly due to increased visibility and reporting capabilities in both Google Merchant Center and Google Search Console related to product performance and the buzz around product schema for rich organic results.
Note: Even newer AI-powered shopping experiences, like ChatGPT’s, are starting to rely on structured product data, which is another reason to get your schema in order.
Examples of key attributes for optimization include:
Product Title
Product Type
Google Product Category
Description
Inclusion of additional relevant attributes such as size, color, and material
Images
Let’s break this down in further detail for the most important opportunities.
Product Title
Product titles are weighted for search relevance. Do not ignore the opportunity to improve this for both paid and organic listings.
This attribute has a direct impact on user experience, CTR, and CVR, as well as influencing the algorithm. Include the most important details first, and note that the majority of users will only see around the first 70 characters of your title.
For most product categories, a well-optimized product title will use the following formula:
Brand + Product Title + Product Type + Attribute
Include rich keywords for long-tail visibility.
Keep it under 150 characters.
Include any attributes important for your product, such as size, color, and material, where appropriate.
Be consistent with the attributes you choose and the location within the title (ie, if you include color, don’t put it at the beginning of one title and at the end of another)
Avoid vague or duplicate titles.
Do not include promotional copy, such as free delivery.
Avoid using ALL CAPS unless part of a brand name or common abbreviation.
Note: In some cases, a business may wish to include the brand name at the end of the title if the business is a manufacturer or if the brand name is not significant.
Product Type
Product types are significantly weighted for search relevance and allow custom categorization. This optional attribute is one of the most underutilized and misunderstood attributes in a product feed.
Always include product type in your feed, even though it’s optional. This attribute operates behind the scenes and is not visible to users.
Use rich keywords to help the algorithm better understand how to categorize your product. This attribute helps organize and segment your shopping and Performance Max campaigns.
Keep it under 750 characters.
Aim to use at least 3 levels of breadcrumbs.
Use the greater than ‘>’ symbol to separate each level, similar to how Google Product Categories are shown. Usually, this would follow the breadcrumb structure on your website, so specify this with SEO in mind.
Google Product Category
This is another golden opportunity. Although the Google product category is automatically assigned by Google, in many cases, it can be improved. Product titles, brand, GTINs, and descriptions all influence the automated categorization, which is another reason it’s important to make these as accurate as possible. Be sure you check these using Google’s predefined taxonomy for the most specific option related to your products.
Choose the most specific category possible.
Only use product categories defined by Google; you cannot create your own.
Use Google’s product categories as a hint for how users might search. If you’re using older versions of Google product categories and updates are made to the taxonomy, Google will automatically map this to the latest version.
Understand the difference between Google product category and product type, as they are similar but serve different purposes.
In certain countries, such as the USA, UK, Australia, Germany, France, Italy, the Netherlands, Brazil, Norway, Sweden, Turkey, you can use the Google product category to segment shopping and PMax campaigns.
Here’s an example of an improvement we made for a client selling outdoor chairs:
Here’s how we optimized the category: Furniture > Outdoor Furniture > Outdoor Seating > Outdoor Chairs
Description
Descriptions add context to products and help both users and search engines better understand the purpose and intent of a product. The primary goal is to sell your product to the right customer. Use this as an opportunity to highlight what your product is, what purpose it serves, what it looks like, and why customers need it.
Imagine a user cannot see the picture. Create a description that allows the customer to visualize the product with their eyes closed.
List the most important features first.
Include up to 500 characters.
Use the product description to list key features and benefits.
Include technical specifications, such as dimensions or weight, if appropriate.
Describe other key attributes in the written product description for visibility, such as colors, textures, materials, patterns, and size.
Don’t keyword stuff your descriptions, and don’t include promotional copy such as “free delivery” or sale pricing.
Avoid using ALL CAPS or emojis and special characters - this looks spammy and less trustworthy.
Identify descriptions created using generative AI with the structured_description attribute.
Images
An image is worth a thousand words. It is also often the first thing that catches our attention when viewing a page full of products. With the rise in popularity of image search, multiple quality product images are more important than ever.
Additionally, with recent enhancements in shopping features such as 3D spin and virtual try-on, you can future-proof your business by improving product photos now.
Use tightly framed, bright, vibrant photos
Include up to 10 images
Test various lifestyle formats in addition to product shots
Do not use text overlay on product images
Other attributes, such as colour, material, and size
As with the attribute examples outlined above, use every possible attribute that applies to a product.
Clearly define attributes that help sell a product to the right customer.
Be consistent and concise to enable insertion into product titles and descriptions.
Use words and phrases that will be easily understood by users and search engines. For example, instead of a color attribute “Marshmallow”, consider using the word “White”.
⭐ Important note related to any product optimizations above:
While these capabilities are in place to assist with optimizing your product feed, it’s not recommended to change any product attributes frequently. Doing so can adversely impact product performance for both paid and organic shopping.
Additionally, attributes such as product type, brand, and Google product category are often used to organize and segment Google Ads campaigns, so please DO NOT make any changes here without communicating with your Google Ads folks.
It can wreak havoc on paid campaigns or even break them fully without proper communication between business owners, Google Ads, and SEO teams. So please play nice and over-communicate any optimizations before they happen.
How to update product data?
Now that you know which attributes to update, there are a number of ways you can put them to work. For some businesses, this information will be updated behind the scenes in the website CMS (ie, Shopify, WordPress, etc) and automatically submitted to GMC.
For other businesses, there may be some challenges with getting this information to sync in Google Merchant Center if feed plugins or 3rd party sources are outdated or aren’t correctly configured or managed.
Fortunately, management of product feeds and product information is becoming easier and less technical, which was one of the key objectives of upgrading from classic GMC to GMC Next.
If you don’t already use a feed API or a 3rd party feed solution, the following 2 ways are ideal for easy setup and management:
Feed attribute rules
Supplemental feed uploaded via Google Sheets
If you do not find the option to add either of the above solutions, check your settings to confirm the add-on is enabled.
Go to: Settings > Add-Ons > Advanced data source management
Feed attribute rules
Feed attribute rules work well when there is a large volume of products that require bulk optimization updates directly in Google Merchant Center.
To use this feature, go to:
Settings > Data Sources > Primary Sources(click on the feed name)> Attribute Rules
From here, a number of rules can be created to automatically apply to any feed or supplemental feed already used in Google Merchant Center. You can use a variety of different data source operations, such as:
“Set to”
“Set to multiple”
“Extract”
“Extract multiple”
For example, you can create rules to:
Automatically add a brand name to the beginning (or end) of all product titles
Automatically detect keywords used in product titles and assign a product type
Automatically add key attributes such as color, size, or material to product descriptions if they are not already included
Creating rules within Google Merchant Center is an easy way to manage accounts with a high volume of products while maintaining consistency. You can also preview and test what the rules look like, as well as remove or update them at any point.
If you have never used feed attribute rules, it is recommended to dive deeper to gain a better understanding of how they work before you start making changes. Review Google’s official documentation on attribute rules (previously known as feed rules).
Alternatively, you can reach out to a third party for advice and support or choose a more manual method, such as supplemental feeds.
Supplemental feeds
Another option for updating product information and overriding attributes submitted in the product feed is a supplemental feed. Personal preference will indicate which method you use, but Google Sheets is a straightforward option.
To use this feature, go to:
Settings > Data Sources > Supplemental Sources > Add Supplemental Product Data
If using Google Sheets, remember to set your sharing permissions to allow anyone with the link to view the sheet (otherwise, Google won’t be able to read it).
Supplemental feeds are an ideal solution if:
You don’t use an API, third-party tool, or if you don’t feel comfortable creating attribute rules in Google Merchant Center
You have a manageable selection of products
You want to add or modify information already submitted in your primary feed
You would like to use formulas in Google Sheets to combine columns and optimise product titles directly in the spreadsheet (ie, Brand + Product Title + Product Type + Attribute)
If you need to create custom labels for products that meet certain criteria, such as seasonal products, bestsellers, high-margin products, or promotional products
You would like to use the find/replace function to make bulk changes to specific attributes
How to know what’s working?
Now that you have worked so hard to optimize your product feed and everything is updated in Google Merchant Center, how do you know what’s working? Of course, you will be able to see the actual performance metrics in GMC analytics along with your shop quality score, but how do you get under the hood and actually see the strengths and weaknesses of your feed optimization efforts?
Optmyzr offers a suite of tools specifically for shopping, including:
The Shopping Dashboard is a comprehensive tool designed to provide an overview of all Shopping and PMax Retail Campaigns, as well as the merchant feeds that support these campaigns. It allows you to view, monitor, and optimize retail campaigns from a single, user-friendly interface.
Screenshot shows the Shopping and Performance Max Retail Campaigns widget on the Shopping Dashboard
Shopping Feed Audit
The Shopping Feed Audit tool grades your merchant feed and shopping campaigns based on common parameters to identify quick opportunities for improvement. By providing a series of product, campaign, and product/listing group audits, the tool helps you maintain a well-structured and organized campaign setup.
Screenshot shows the Shopping Feed Audit
Screenshot shows the Feed Audit Score
Smart Product Labeler
The Smart Product Labeler helps you simplify and enhance product labeling in your shopping campaigns. You can create custom rules to label your products based on performance metrics and feed attributes.
You can also get custom suggestions for performance buckets and labels to help you segregate your products more efficiently.
When did feed optimization become so important?
Feed optimization is not a new concept, but it is one that has been gaining more interest since the launch of Google Merchant Center Next and the rise of AI-signaling.
A few reasons for the increased interest are due to growing awareness of the power of feed optimization, the AI signals it provides to assist results and match user intent, along with the rising interest from businesses and SEOs who have discovered the true power of GMC.
Other reasons for increased interest in product optimization:
Improved visibility and product reporting metrics in GMC, including the ability to view both paid and organic shopping results
The merchant opportunities report in Google Search Console
The ability to create custom reports and dashboards in Merchant Center
Go to: Settings > Add-Ons > Custom reports
While this article focuses on product-specific optimizations, it is not intended to be an all-inclusive list of merchant opportunities.
Some other items that directly influence performance on Google Shopping include:
Overall shop quality score
Price competitiveness
Promotions
Shipping and returns
Product ratings
Payment methods
The full rollout of GMC Next replaced the classic Merchant Center experience for all retailers in September 2024, however, many businesses opted to begin using it earlier to become familiar with the newest features. If you’re still getting familiar with the latest version of GMC, roll your sleeves up to acquaint yourself with the navigation, reports, and settings available.
Optimized feeds, optimized performance.
Product feed optimization is one of the most powerful ways to improve performance across Google Shopping and PMax campaigns. When you give Google rich, accurate, and structured product data, you make it easier for your ads to show up in the right places and for the right people. That means more visibility, better clicks, and higher conversions.
Optmyzr’s suite of Shopping tools, like the Shopping Feed Audit, Smart Product Labeler, and custom dashboards, makes it easier to spot issues, apply improvements, and scale your feed optimization efforts with confidence.
Thousands of advertisers — from small agencies to big brands — worldwide use Optmyzr to manage over $5 billion in ad spend every year.
You will also get the resources you need to get started and more. Our team will also be on hand to answer questions and provide any support we can.
Let your bidding strategy scale with your ambition.
Casey Gill is a Senior Google Ads Specialist atWebSavvywith global ecommerce experience across the USA, UK, Europe, UAE, and Australia. She was recently listed as a ‘Top 100 PPC Influencer’ worldwide by PPC Survey.
This article is a reflection of the author’s experiences and opinions. Optmyzr believes that there are many ways to win in digital advertising, and is committed to presenting a diverse range of ideas and approaches.
A sweeping 10% tariff now applies to nearly all imports to the US, with a staggering 125% duty on goods from China (as of this post). While many prices haven’t surged yet, they will soon.
When they do, advertisers will be one of the first to feel the pressure.
Ad budgets will likely get cut, retailers will scramble, clients may panic and as always, marketing will be expected to do more with less.
Thankfully, history and our friends are a wealth of proactive advice!
We’ve dug into previous trade wars and gathered insights from top advertisers, agency leaders, and marketing economists.
In this guide, we’ll break down:
What history tells us about the impact of tariffs on marketing
What’s different (and more dangerous) in 2025
How to protect your budget, prove your value, and keep your strategy sharp — even in a downturn
What does history tell us about tariffs and ad budgets?
This isn’t the first time tariffs have shaken the economy. Here’s what we saw in the past:
“Steel tariffs” (2002–2003)
U.S. steel prices rose by ~30%
Auto and appliance industries slashed marketing and hiring
Ad spend dropped in durable goods and B2B categories
U.S.-China trade war (2018–2020)
25% tariffs on $250B in Chinese imports
Ad spending in retail dropped 5%, and auto ads fell 7%
The common thread here is that when margins get squeezed, advertising is one of the first things on the chopping block. Brands either pull back or shift to lower-cost, more trackable channels.
What makes 2025 different?
According to NRF and Deloitte, 2025’s economic outlook is more fragile than that of prior years:
Retail growth projections dropped to 2.7–3.7%, down from a previously forecasted 4.5%.
Ad growth projections were already revised down by Madison & Wall and MAGNA before the full extent of the tariffs was known.
The IAB reports that 94% of advertisers are worried about cuts, and 60% expect ad budget reductions of 6% to 10%.
Layer on continued inflation, geopolitical tensions, and inventory challenges, and we’re looking at a perfect storm.
What problems could you face, and how could you overcome them?
Here’s what you could be dealing with in the coming months and what today’s top experts suggest doing about it.
Problem 1: Budgets could disappear overnight.
“We had Q2 spend planned and ready — the next day, it was on hold indefinitely.”
— Casey Gill, WebSavvy
“We’re seeing panic responses. Some clients are scaling back before they even run the numbers.”
— Dii Pooler, Pooler Digital
Why this matters:
When headlines trigger panic, budget cuts often happen suddenly — and without warning. If you’re not pacing spend in real time or watching for campaign spikes, you could miss your window to adjust before the budget’s already gone.
What to do:
Offer weekly pacing + ROI check-ins to give clients a sense of control
Prepare “what-if” scenarios so you’re not caught scrambling
Show how even small budgets can still drive performance with the right optimizations
How Optmyzr helps:
Optmyzr’s Budget Pacing feature shows how spend is tracking relative to the ideal pace for the month, adjusting for seasonality, days elapsed, and linear benchmarks. It flags whether you’re underspending or overspending at any point, so you can rebalance before it’s too late.
On top of that, the Anomaly Detector script alerts you when key metrics (like cost, conversions, or impressions) suddenly deviate from expected levels, even down to the hour. That way, if a campaign starts to underperform or overspend before leadership cuts the budget, you already know, and you’re already acting.
“The Budget Pacing tool is a team favorite. It allows us to show visually where the money is going and helps us figure out where best to invest the budget for clients.”
— Mike Rhodes, WebSavvy
Problem 2: You’re optimizing for margins that no longer exist.
“Clients are still optimizing based on pre-tariff product costs. That’s a trap.”
— Duane Brown, CEO, Take Some Risk
“Some brands are upside down on containers they already sold. They’ll lose money on every order once tariffs hit.”
— Sam Tomlinson, EVP, Warschwaski
Why this matters:
If your campaigns are still built around old pricing models, you’re likely overbidding, overexposing, and over-promising. With tariffs pushing up COGS, even previously “profitable” SKUs may now be selling at a loss.
You need to realign your bids and targeting around current product profitability, not pre-tariff assumptions.
What to do:
Help clients recalculate post-tariff margins and rebuild campaign targets accordingly
Segment and prioritize products based on actual margin, availability, and pricing competitiveness
Optmyzr makes it easier to respond to shifting margins with tools that give you granular visibility and control over your product-level campaigns.
With the Shopping Feed Audit, you can catch issues like overlapping products, disapproved listings, missing data, or overpriced SKUs — all before they waste spend.
The Product Group widget helps you split large product groups into tighter segments, so you’re not bidding the same on high-margin and low-margin SKUs.
The Custom Label widget lets you tag products dynamically based on margin, stock level, or pricing competitiveness so your campaigns always stay aligned with your business goals.
“Optmyzr’s monitoring, alerting system, and shopping feed audit were incredibly helpful in keeping campaigns and product feeds optimized. The reporting features generate qualitative reports with one click, which is invaluable during high-demand periods.”
— Matthieu Tran-Van, Consultant
Problem 3: Global messaging needs to shift fast.
“We’re softening our U.S. brand voice when advertising in Canada.”
— Julia Vyse, Digital Director, Dentsu Digital
“Messaging that leans on ‘Made in America’ is landing differently across regions — sometimes not at all.”
— Marilois Snowman, CEO, Mediastruction
Why this matters:
Tariffs aren’t just an economic issue — they’re an emotional one. In times of global tension, how you talk can matter just as much as what you sell.
Messaging that worked three months ago might now feel tone-deaf or even offensive, depending on the market. Geo-sensitive campaigns are no longer optional; they’re essential.
What to do:
Run structured A/B tests across markets to learn what tone, phrasing, or offer resonates best
Experiment with angles like: “Inventory landed before tariff hikes.” “Local quality, global delivery”
Reassess ad copy weekly based on geo-specific performance
How Optmyzr helps:
Optmyzr gives you everything you need to adapt messaging and targeting by geography without guesswork.
The Geo Heatmap helps you spot which locations are driving ROI, and which ones are costing you without converting. You can visualize this data using a heatmap segmented by city, region, or country.
Geo Bid Adjustments lets you automatically raise or lower bids based on a location’s past performance, even if that region wasn’t previously targeted.
And if you’re managing multiple ad accounts, the Ad Analyzer helps you scan campaigns to find winning creatives and flag poor performers across locations, including Meta Ads placements.
Problem 4: Ad spend is being reallocated across channels.
“Search is still seen as gold in volatile times.”
— Ewan McIntyre, Gartner VP & Analyst
“Microsoft Ads is a smart play right now. Low competition, solid returns.”
— Casey Gill, WebSavvy
Why this matters:
When uncertainty hits, advertisers stop experimenting and go back to what works. Search, Shopping, and email/SMS retention tend to hold strong, while CPM-heavy or top-funnel channels often take the first hit.
The challenge is that many advertisers still have their budgets locked into legacy structures — channels that are now too expensive, or product groups that are no longer profitable.
What to do:
Rebalance toward ROI-driven channels like search + shopping
Test platforms with lower CPMs (Microsoft, Pinterest, Reddit)
Double down on email + SMS for retention
How Optmyzr helps:
Optmyzr’s Shopping Campaign Management tool gives you the flexibility and control needed to confidently shift spend where it performs best, especially during volatility.
Launch Google Shopping, Performance Max Retail, or Optmyzr Smart Campaigns (with Target ROAS baked in) all in just a few clicks
Use feed-based rules to filter which products go into each campaign based on performance or custom attributes like margin or price sensitivity
Restructure existing Shopping or PMax campaigns, even those created outside of Optmyzr, by splitting product groups or redefining ad group hierarchies
Reallocate budget dynamically across campaigns and ad groups using advanced bidding and targeting settings
Sync campaigns with real-time feed changes from your Merchant Center — keeping your product ads up-to-date, without constant manual intervention
Problem 5: Inventory gaps will tank your ROI.
“You can’t run ads on products that are out of stock. That kills trust.”
— Andrew Dimitriou, Global Marketing Strategist
“We’ve got brands promoting SKUs they literally don’t have anymore. That’s wasted spend.”
— Sam Tomlinson
“Inventory unpredictability is back, just like COVID. If your messaging doesn’t match your shelf, you’re in trouble.”
— Julie Friedman Bacchini, Founder, Neptune Moon
Why this matters:
Tariffs are already disrupting global supply chains, and as delays and stockouts increase, you risk spending real dollars promoting products that simply aren’t available.
This kind of misalignment doesn’t just waste budget. It confuses customers and erodes trust.
What to do:
Sync campaigns with real-time inventory feeds or Merchant Center updates
Prioritize products with healthy stock levels and solid margins
Monitor campaign performance weekly to catch unexpected drops tied to inventory or feed issues
How Optmyzr helps:
Optmyzr helps you stay ahead of inventory-related issues by surfacing exactly what’s causing your campaign performance to slip, so you can take quick, focused action.
The PPC Investigator analyzes your account’s data and pinpoints the root cause of performance changes, like a drop in conversions or ROAS. Whether it’s a paused product group, an out-of-stock SKU, or a feed issue, you’ll know exactly what’s driving the problem and where to fix it.
With the Cause Chart and Root Cause Analysis, you can drill down by campaign, keyword, product type, or placement to get full visibility on performance volatility, especially helpful when your feed or inventory status is in flux.
Pair this with the Shopping Feed Audit, which flags missing data, disapprovals, and products that have vanished from your campaigns before they create real revenue leaks.
What will smart marketers do differently?
The smartest advertisers right now are:
Running margin-aware campaigns
Shifting spend toward search, shopping, and retention
Offering preemptive messaging around pricing
Helping clients renegotiate SaaS and agency contracts
Automating what can be automated to buy back time
As Jasmine Enberg from eMarketer put it:
“This is a new era of uncertainty, and marketers are already playing defense.”
You don’t need to panic. But you do need to plan.
Tariffs may be outside your control. But how you respond is where leadership lives.
If you only do 3 things after this:
Re-calculate your margins and rebuild bids around profitability
Pivot your messaging to match shifting inventory and customer sentiment
Double down on automation to stretch your time and team further
And if you believe Optmyzr is the tool for you, sign up for a 14-day free trial today.
Thousands of advertisers — from small agencies to big brands — worldwide use Optmyzr to manage over $5 billion in ad spend every year. Plus, if you want to know how Optmyzr’s various features can help you in detail, talk to one of our experts today for a consultation call.
Ever looked at past PPC performance and wished you could tweak reality just a little? Now you can! Introducing Optmyzr RetroEdit™—the world’s first campaign-editing tool powered by quantum PPC technology and advanced time-travel algorithms.
How RetroEdit™ Works
Pick a Past Campaign: Choose any historical campaign.
Select Your Metrics: Want more conversions? Higher revenue? Lower CPC? Adjust any metric you like.
Edit the Results: Type in your desired number and hit “Apply Retroactively.”
Instantly, RetroEdit™ rewrites history to reflect your changes, updating metrics, financial reports, and even your actual bank balance!
Important (and slightly concerning) Warnings
Increasing Revenue: May lead to unexpected bonuses, spontaneous celebrations, or confused accountants.
Decreasing Metrics: Be cautious—reducing conversion values might lead to negative bank balances and awkward calls from finance.
“User Testimonials” from Alternative Timelines
“I boosted my conversions last quarter from 50 to 500. Now I’m employee of the decade and nobody seems to question it!”
— Marty McFly, Flux Capacitor Marketing
“Reduced CPC by 99% retroactively and started receiving random refund checks from Google. Thanks, RetroEdit™!”
— Doc Emmett, Founder, TimeTravel PPC Agency
Reality Check!
Of course, RetroEdit™ isn’t actually real—Happy April Fool’s Day!
While altering history isn’t possible (yet!), Optmyzr helps you optimize your PPC campaigns for real-world success with genuine insights and powerful tools.
Enjoy the laugh, and when you’re ready for real results (in this timeline), Optmyzr is here to help! Sign up for a14-day free trialtoday.
When ad platforms provide guidance, it is often taken as absolute truth. The expectation is that their help documentation and support channels offer accurate, actionable advice.
However, despite providing clear guidance after reviewing the findings from Optmyzr’s experiment, Google spent months telling advertisers PMax exclusions would not be respected if they came from the API.
Here’s Google’s previous documentation:
Here’s Google’s answer in their AI overviews:
The same was shared in their communications with advertisers.
This post outlines an experiment conducted to determine if API placement exclusions work for PMax campaigns, contrary to Google’s previous claims.
It’s worth noting that as a result of this experiment, Google did some digging into their own systems and came up with the following response:
As the screenshot shows, this is how to think about placement exclusions:
We’ll also explore what this means for advertisers and how to navigate support discrepancies moving forward.
What we uncovered from our experiment
Details of the experiment
Optmyzr conducted a controlled experiment to test whether placements excluded via the API would be respected for PMax campaigns. Here’s what we did:
1. Setting up the campaign
We launched a brand new PMax campaign in our brand’s ad account on December 30th 2024. We gave the campaign till Jan 13, 2025 to accrue clicks, impressions, and placements.
2. Applying exclusions
Identifying placements we wanted to exclude, we implemented these exclusions through our API connection. The exclusions appeared at the account level, despite Google’s documentation stating that placement exclusions must be done through the UI. We applied these exclusions on Jan 13, 2025.
3. Monitoring the results
No ad spend occurred on the excluded placements as of Jan 21, 2025, proving the API exclusions were effective. The example placement we chose to follow was “Mobile App: Vita Mahjong (iTunes App Store), by VITA STUDIO PTE. LTD.”
This experiment’s results reveal a stark contrast between Google’s official guidance and the platform’s actual functionality.
What are the implications for advertisers?
1. Documentation vs. reality
This finding underscores the importance of questioning and testing platform limitations. While help documentation serves as a baseline, advertisers can no longer treat it as definitive. PMax, as an evolving ad type, requires a proactive approach to testing features and functionalities.
2. Efficiency through the API
Excluding placements via the API is significantly more efficient than using the UI. The UI process involves cumbersome formatting and limitations, which can deter advertisers from making necessary exclusions.
The API’s effectiveness, as demonstrated in our experiment, offers a faster, more scalable alternative.
The miscommunication around how placement exclusions are respected came from the very real issue all SAAS faces: innovation happens faster than support documentation can keep up.
What advertisers should do next
1. Embrace testing
Treat every rule or limitation as an opportunity to test. The findings from this experiment reinforce the need to verify functionality instead of relying solely on documentation.
2. Leverage tools and expertise
If you’re an Optmyzr customer, rest assured that our rule engine and smart exclusions protect your accounts effectively. For non-customers, consider engaging with experts like Nils Rooijmans and Mike Rhodes, who offer many scripting solutions and insights.
3. Active account management
Ensure your accounts are actively monitored. Automated rules are valuable but should not replace ongoing oversight. Regular checks are critical to adapting to platform changes and discrepancies.
A balanced perspective
Despite these challenges, Google remains a meaningful channel for advertisers. Properly applied exclusions and strategic management can yield exceptional results. Optmyzr customers can use our Smart Exclusion tool to quickly identify and exclude wasteful exclusions. We also encourage testing alternatives like Microsoft’s PMax and exploring other platforms.
At Optmyzr, our mission is to safeguard your ad investments. By staying informed and proactive, you can navigate the complexities of digital advertising and adapt to the fast-changing industry
Not an Optmyzr customer yet? Now’s the best time to sign up for a full functionality 14-day free trial.
Thousands of advertisers — from small agencies to big brands — worldwide use Optmyzr to manage over $5 billion in ad spend every year.
You will also get the resources you need to get started and more. Our team will also be on hand to answer questions and provide any support we can.
For years, Cyber Monday has held the title of the biggest online shopping day, and recent reports like Adobe’s 2024 study confirm this with $13.3 billion in total e-commerce sales, compared to Black Friday’s $10.8 billion.
But here’s where things get interesting: when we narrow the focus to Google Ads-driven sales, the narrative flips. Optmyzr’s analysis of 11,423 accounts found that Black Friday consistently outperforms Cyber Monday in ad-driven conversion value.
Does this mean advertisers may be focused on the wrong day to drive most of their sales? Let’s dig into the findings and see what they mean for marketers.
The data that flips the script
From Optmyzr’s perspective based on a subset of accounts:
Black Friday 2024 (Nov 29) drove $94.62 million in Google Ads-attributed conversion value, eclipsing Cyber Monday’s $64.07 million.
The average value per conversion on Black Friday was $85.09, significantly higher than Cyber Monday’s $74.82.
These findings reveal that for advertisers leveraging paid media, Black Friday is the clear leader—not Cyber Monday.
Optmyzr’s study about Black Friday vs. Cyber Monday
Ad Spend
Conversion Value
Value per Conversion
ROAS
2024
Black Friday
$15,321,664
$94,624,043
$85.09
617.58%
Cyber Monday
$14,121,621
$64,070,399
$74.82
453.70%
Ad Spend
Conversion Value
Value per Conversion
ROAS
2023
Black Friday
$13,990,189
$101,574,600
$78.37
726.04%
Cyber Monday
$13,250,633
$71,587,342
$69.88
540.26%
This Optmyzr data is as of Dec 7, 2024 for 11,423 accounts that advertised on Google Ads on Black Friday and Cyber Monday this year and last year. Note that conversion values are self-reported by advertisers, and that the 2024 conversion value numbers are likely going to be higher than what is shown here due to conversion delays.
Why Cyber Monday isn’t always the clear winner for ecommerce
So, why does Adobe’s data crown Cyber Monday the overall e-commerce champion, while Optmyzr’s data gives the edge to Black Friday? The answer lies in segmentation and shopping behavior:
1. Broader ecommerce vs. paid media attribution
Adobe tracks all e-commerce sales, regardless of traffic source. Cyber Monday’s strength comes from organic and direct channels like email marketing, bookmarked deals, and returning visitors. Optmyzr focuses specifically on sales attributed to Google Ads, where Black Friday’s urgency and high-ticket deals drive stronger ad-driven performance.
2. The role of urgency in Black Friday ads
Black Friday is a high-advertising day, with retailers flooding paid media with aggressive promotions for big-ticket items. Shoppers are primed to click and convert, leading to higher ad-attributed sales.
3. Cyber Monday’s organic advantage
By the time Cyber Monday arrives, many shoppers have bookmarked deals or received email reminders, reducing reliance on ads. The day’s strength lies in smaller, follow-up purchases driven by organic and direct traffic.
Why should you care
For advertisers, understanding the segmentation between total e-commerce sales and ad-driven performance isn’t just an exercise in analytics—it’s the key to making smarter budget decisions. If you rely on Google Ads to drive your holiday sales, the conventional wisdom that Cyber Monday is the biggest online shopping day might lead you to misallocate resources.
Optmyzr’s data shows that Black Friday drives more value for paid media campaigns, suggesting that ad budgets and strategies should align with the day’s urgency and consumer behavior. Recognizing these nuances enables advertisers to optimize their campaigns for maximum return, standing out in a crowded holiday marketplace.
What you should take away
Advertisers should rethink how they approach Black Friday and Cyber Monday 2025 in their holiday strategies. Here’s how to act on these insights:
1. Double down on Black Friday ads
If you’re running Google Ads, Black Friday offers unparalleled opportunities for high-value conversions. Allocate larger budgets to capture the wave of motivated shoppers and focus on premium products and bundled deals.
2. Leverage Cyber Monday’s organic strength
Cyber Monday remains vital, but its strength lies outside of paid channels. Use retargeting and email campaigns to re-engage shoppers who browsed during Black Friday.
3. Reevaluate attribution models
The segmentation between total sales and ad-attributed sales underscores the importance of understanding your channel performance. A broader e-commerce win for Cyber Monday doesn’t diminish the fact that Black Friday delivers better results for paid media campaigns.
Tailor your campaigns based on data
The holiday shopping narrative has long been dominated by Cyber Monday’s total sales supremacy. But Optmyzr’s data suggests that for advertisers using paid media, Black Friday is the real champion.
This insight challenges conventional wisdom and opens up new possibilities for advertisers looking to make the most of their holiday budgets. By recognizing the strengths of both days and tailoring campaigns accordingly, you can drive performance that outpaces competitors who stick to the old playbook.
And after what you read here, if you think Optmyzr is the tool for you to drive higher performance, sign up for a 14-day free trial today.
Thousands of advertisers — from small agencies to big brands — worldwide use Optmyzr to manage over $5 billion in ad spend every year. Plus, if you want to know how Optmyzr’s various features help you in detail, talk to one of our experts today for a consultation call.
In Google Ads, attracting the right traffic isn’t just about selecting keywords—it’s about aligning those keywords with user intent. Understanding when to use exact match, phrase match, broad match, or negative keywords is crucial for maximizing ad spend and targeting effectively.
The stakes are high: the wrong match type can waste budgets on irrelevant clicks, while the right choice can drive higher click-through rates, return on ad spend, and quality leads.
This guide provides a clear, practical breakdown of each match type. You’ll learn the strengths and weaknesses of exact, phrase, and broad match, along with the best use cases and key findings from our latest match type study which analyzes data from Q3 2024 (July to September) on advertiser preferences and performance.
What are the different keyword match types in Google Ads?
Google Ads offers three main keyword match types, each with unique targeting criteria:
Exact Match (EM): Targets searches that closely match the keyword, delivering high precision with limited reach.
Phrase Match (PM): Matches ads to searches that align with the keyword’s meaning, even if wording or order varies.
Broad Match (BM): Provides the widest reach, allowing ads to show for a broad array of related searches.
These match types suit different campaign goals. Understanding their individual advantages allows advertisers to structure campaigns for the best performance.
When to use each match type?
Exact match: Best for precision
Ideal for branded keywords or high-intent searches where relevance is key
Ensures minimal wasted clicks and higher engagement from users who search for the exact keyword meaning
Works best in campaigns targeting specific product terms or high-value, bottom-of-funnel audiences
Phrase match: Balance between reach and control
Useful for competitive markets and thematic keyword groupings
Helps broaden reach to intent-aligned searches while maintaining relevance
Effective for capturing closely related search queries without overly restricting traffic
Broad match: Maximizing reach with Smart Bidding
Ideal for top-of-funnel campaigns or discovering new audiences at scale.
Works well when paired with Smart Bidding to improve relevance by analyzing user intent in real-time.
Requires careful monitoring and the use of negative keywords to avoid irrelevant clicks.
Performance insights from our study
Strategic Data: Our November 2024 analysis of 992,028 keywords across 15,491 ad accounts highlights the unique strengths of each match type:
Source: Optmyzr Keyword Study - November 2024
Key Takeaways:
Exact Match achieves the highest ROAS (415%) and CTR (21.66%), proving its value for high-intent campaigns.
Phrase Match shows a strong balance with a high conversion rate (9.31%) and solid ROAS (313%), making it ideal for advertisers needing both control and reach.
Broad Match delivers high volume at a lower ROAS (277%) and CTR (8.5%), making it suitable for large-scale or exploratory campaigns where volume outweighs precision.
Our analysis of keyword match types from 2022 to 2024 reveals consistent patterns in how advertisers allocate their keywords across broad, exact, and phrase match types. The distribution of match types has remained largely stable over the past two years, with only minor shifts in usage:
Broad Match: Increased from 33.12% in 2022 to 36.67% in 2024 (+3.55%).
Exact Match: Declined slightly from 37.11% in 2022 to 34.35% in 2024 (-2.77%).
Phrase Match: Marginally decreased from 29.77% in 2022 to 28.98% in 2024 (-0.79%).
This consistency highlights that advertisers continue to use match types in similar proportions, suggesting their strategic value has not significantly changed over time.
Phrase match still dominates in terms of usage, followed by exact match, with broad match showing the most growth—likely due to advancements in Smart Bidding and Google’s improved intent-matching algorithms.
So what does this data say?
The relatively static distribution reflects how each match type serves distinct campaign goals:
Phrase Match remains a popular choice for balancing reach and relevance, particularly in competitive markets.
Exact Match continues to serve as the go-to for precision targeting, despite a slight decline in usage.
Broad Match shows steady growth, indicating more advertisers are willing to leverage it for discovery and scale, particularly with the support of Google’s AI-driven bidding strategies.
These findings reinforce the importance of understanding when and how to use each match type effectively, as their roles in campaign strategy remain crucial even amidst changes in Google Ads’ algorithms and AI capabilities.
To maximize results, you need to optimize campaigns regularly by analyzing keyword performance, adjusting bids, and refining negative keywords. Brand exclusions and inclusions are also useful tools, particularly when working with phrase and broad match, to control the quality and relevance of ad placements.
Best practices for each match type
Exact match tips
Stick to specific keywords: Limit exact match to precise, high-intent terms, such as brand names or product-specific keywords.
Monitor regularly: Adjust keywords based on performance to ensure that you’re not missing out on potential traffic due to overly narrow targeting.
Phrase match tips
Organize thematically: Group keywords by related themes to improve relevance.
Use brand exclusions: Prevent ads from appearing on searches for your brand terms that you already have in branded campaigns.
Add negative keywords: Continuously refine your negative keyword list to filter out less relevant searches.
Broad match tips
Leverage smart bidding: Broad match works best with Smart Bidding, which adjusts bids based on Google’s analysis of search intent.
Track search terms: Regularly review search terms and add irrelevant queries as negative keywords.
Use brand inclusions: For increased precision (but lower volume), consider allowing ads only on queries related to your brand.
Capture the right clicks with precise targeting
In Google Ads, your choice of keyword match type is more than just a technical detail.
But no match type is a magic bullet. Success requires a hands-on approach—analyzing performance, adjusting bids, adding negative keywords, and refining your strategy as the data comes in.
If you need help with that from a proven set of tools, try Optmyzr.
Success in advertising isn’t just about driving immediate sales; it’s about building long-term growth and sustainability. While most advertisers rely on metrics like ROAS and ACoS to measure campaign performance on Amazon, these metrics don’t speak to how your overall sales have grown due to your advertising activities.
You need to look beyond short-term wins and focus on strategies that improve your overall paid and organic business growth.
For Amazon advertisers, TACoS is a more robust metric that can provide you with a more complete picture of your campaign’s performance.
In this article, I’ll walk you through everything you need to know to get started with TACoS and how to manage it for greater product visibility and less reliance on ads.
What is Amazon TACoS?
Amazon TACoS, or Total Advertising Cost of Sale, is a metric that measures ad spend against total sales (both ad-driven and organic). Monitoring TACoS enables you to gauge the efficiency and impact of your Amazon ads on a more macro level, as I’ll discuss in the following sections.
Unlike ACoS (Amazon Advertising Cost of Sales; which only accounts for revenue generated through ad-driven sales), TACoS helps you see how your ad efforts contribute to your total sales growth, including organic sales (which might be influenced by advertising).
Why you should consider organic sales when evaluating ad performance
Organic sales (i.e., sales generated through non-paid sources) increase with greater brand awareness or organic rankings, both of which your ads might influence (either directly or indirectly). When you evaluate ad performance with only ACoS, you overlook the long-term impact ads can have on organic sales—whereas TACoS captures the full picture.
Declining TACoS over time shows that your business is becoming less reliant on ads to drive revenue and more on organic growth.
The difference between TACoS, ACoS, and ROAS
Every metric offers a different perspective on advertising efficiency, and understanding each of their distinct roles and the specific insights they provide helps you know which metric(s) to track.
Here’s a quick overview of the metrics:
METRIC
FOCUS
FORMULA
IDEAL USE CASE
ROAS
Revenue return on ad spend
Ad revenue / Ad Spend
Measuring profitability of ad campaigns
ACoS
Efficiency of ad-driven sales
(Ad spend / Ad revenue) * 100
Tracking short-term campaigns focused on direct sales
TACoS
Impact of ads on total revenue
(Ad spend / Total sales) * 100
Tracking long-term strategy for balancing ad-driven and organic growth
Return on Ad Spend (ROAS)
ROAS, or Return on Ad Spend, measures ad efficiency in terms of revenue generated relative to ad spend.
When to track ROAS: Use ROAS to measure campaign-level profitability, especially in paid search and display advertising. Since ROAS only accounts for ad spend and revenue, it omits the impact on organic sales and thus doesn’t provide a complete picture of how your ads affect total sales.
Advertising Cost of Sale (ACoS)
ACoS, or Advertising Cost of Sale, measures the cost of advertising relative to the revenue generated solely from ad-driven sales. You can use it to assess the immediate efficiency of your ad spend (a lower ACoS is more efficient).
When to track ACoS: Use ACoS to answer the question, “How much did I spend to make this sale through ads?” You can also use it to measure campaign performance over the short term (i.e., when the goal is direct sales through ads).
Total Advertising Cost of Sale (TACoS)
TACoS, or Total Advertising Cost of Sale, includes both ad-driven and organic sales to give a fuller picture of the impact of ads on total revenue. It can indicate how your ads contribute to both immediate sales and brand growth over the long run.
When to track TACoS: TACoS is invaluable for guiding long-term strategy. It helps you track organic growth alongside ad spend, making it a key metric for brand-building campaigns where you want to see a reduction in TACoS over time (as organic sales increase). TACoS that declines over time suggests a healthy balance between ad-driven and organic sales, and signals reduced dependency on paid ads.
Why TACoS is north star metric for Amazon advertisers
While ACoS has been the traditional metric Amazon advertisers use to measure ad spend efficiency, we’ve seen (in the previous sections) that it has a very narrow focus.
You need to track TACoS for a more comprehensive picture of your company’s performance. It is important to note again that the goal of investing in advertising is not just to get more ad-driven sales, but also to build awareness, improve rankings, and ultimately lower your reliance on paid ads—all of which you can track by monitoring TACoS.
While ACoS may remain stable or even increase during certain periods, if your TACoS goes down, it’s a sign that your ads are working as planned, creating more organic interest and sales.
So, a lower TACoS means you’re getting more value out of your ad bucks and becoming less dependent on ads to keep sales steady.
In a way, TACoS is like a long-term health check for your ad strategy. If your TACoS is dropping, it’s telling you that your brand is gaining strength organically, which is what every business wants.
Manage TACoS in Amazon Ads: Best practices
Now that you know when to track TACoS, follow the best practices below to ensure that you’re getting actionable insights from this data:
Include all product variations to avoid skewed data
Balance between product and brand campaigns
Track TACoS by product or product group
Set different KPIs for TACoS at various stages of the product’s lifecycle
1. Include all product variations to avoid skewed data.
Make sure you include all variations of your products (i.e., different sizes, colors, flavors, etc.) when tracking TACoS. This helps you get an accurate view of how your whole product line is performing. With all variations included, you can easily spot which products are naturally gaining organic traction and which ones might still need a little extra ad support.
This will prevent you from overspending on ads for products that are doing well on their own, and enable you to allocate budget where it will make a bigger difference.
2. Balance between product and brand campaigns.
Amazon offers different types of ads to help you reach your goals: Sponsored Brand Ads to build brand awareness and Sponsored Product Ads to drive sales of specific products. Knowing when to use each type can make a big difference in managing your TACoS.
Brand campaigns can have a powerful, long-term impact on TACoS. They work by boosting brand awareness, which translates into more organic sales over time, gradually lowering your TACoS. On the other hand, product-specific campaigns tend to generate quicker sales but often rely more on ad spend, which can keep TACoS higher initially.
A smart approach is to balance your ad spend between these objectives:
Use brand campaigns for steady, long-term TACoS improvement
Use product campaigns to drive immediate sales when needed
This way, you’re setting yourself up for both immediate results and lasting growth.
3. Track TACoS by product or product group.
While tracking ACoS at the campaign level can give you some insight into ad performance, it doesn’t tell the whole story—especially since each product behaves differently depending on where it is in its lifecycle.
When you track TACoS at the product level, you get a clearer view of which items are thriving from your ad spend in terms of both paid and organic growth. Products that perform well typically have a lower TACoS because they’re gaining strong organic sales, while newer products may have a higher TACoS as they rely more heavily on ads to get noticed.
If you’re only looking at ACoS, high numbers might seem concerning. But TACoS paints a fuller picture by factoring in organic sales generated by your advertising. In the early stages, you might see a higher TACoS, but as the product gains traction and starts pulling in organic sales, TACoS should naturally decrease.
Tracking TACoS at the product level helps you stay focused on both short-term and long-term goals. It allows you to see where ad spend is working to boost organic growth, so you’re not just chasing immediate results but building a more sustainable business.
ACoS may remain stable or increase, but if a product performs well, tracking TACoS will reveal a decline over time as organic sales grow and reliance on ad spend decreases.
4. Set different KPIs for TACoS at various stages of the product’s lifecycle.
Now that you know that TACoS can vary across product groups and lifecycle stages, it’s good practice to also set different expectations for each group or stage:
PRODUCT SCENARIO
WHAT TO EXPECT
THE GOAL
Product launches (High TACoS)
Expect a higher TACoS for new launches because they need greater ad investment to drive initial awareness.
At this stage, the goal is to establish product visibility and boost organic ranking over time.
Established products (Moderate TACoS)
For products that have been around a while or recently went out of stock, TACoS may temporarily increase as ads help re-establish their organic rankings.
Here, the goal is to recover organic traction rather than immediate profitability.
High-converting products (Low TACoS)
For established products, TACoS should reflect a lower dependency on ads and hold higher organic strength.
The KPI here is a lower TACoS, indicating that the product now sustains on organic sales with minimal ad support.
How to improve TACoS and overall ad strategy
The bottom line is that lower TACoS means less reliance on ad spend to drive product sales. Follow these tactics to position your product listings for organic growth so that you can divert ad budget to where it’ll make the greatest impact:
Optimize product listings for organic visibility
Focus on long-tail keywords in ads
Leverage seasonal and promotional campaigns
Use bid adjustments to optimize spend
Analyze and pause non-performing ads
1. Optimize product listings for organic visibility.
If a product’s TACoS remains high despite consistent ad spend, the listing may need better content. Improve your product titles and descriptions with relevant, high-traffic keywords to increase organic searchability.
High-quality visuals and Enhanced Brand Content (EBC or A+ content) help improve conversion rates, which can drive organic ranking. When your listings are optimized and appealing, you’ll rely less on ads to maintain visibility, which helps bring down TACoS.
2. Focus on long-tail keywords in ads.
Long-tail keywords are usually less competitive and can yield higher conversion rates than more generic head terms. These keywords help drive initial sales without significant ad spend, increasing organic ranking over time and reducing TACoS.
Keep an eye on which keywords perform well and refine your targeting to make sure your product appears in the right searches. Also, be aware that optimizing product listings for long-tail keywords likely means fewer impressions relative to head terms (but, again, these terms should convert more frequently as well).
3. Leverage seasonal and promotional campaigns
Increase ad spend during high-demand seasons like holidays and festivals to maximize sales and organic ranking. Even if TACoS goes up a bit during these periods, the boost to organic sales afterward can be well worth it.
If you run a promotion, monitor TACoS afterward to see if those extra organic sales persist. If so, your strategy has likely helped build a stronger organic presence.
4. Use bid adjustments to optimize spend
Regularly review and pause or lower bids on keywords that don’t convert as well. Direct more budget to high-conversion keywords that support both ad-driven and organic sales to improve TACoS.
Adjust and increase your bids during high-demand times, like holiday seasons, to capture more conversions when shoppers are most active. This can increase ad-driven conversions and reduce the need for ad visibility throughout the year, helping you improve your TACoS over time.
Products with lower TACoS benefit from high organic sales, so you can gradually reduce ad spend and adjust your bids to focus on cost-effective keywords. This frees up budget to support newer or underperforming products. Allocate more budget here and increase your bids to improve visibility and drive early growth.
5. Analyze and pause non-performing ads
Make it a habit to review your ads at regular intervals, pausing any that aren’t bringing in conversions or have a high ACoS. By reallocating budget to ads that consistently perform well, you not only improve immediate results but also increase the chance of these ads positively impacting organic rankings.
Build a sustainable growth strategy with TACoS
Using TACoS effectively means thinking beyond the immediate results of your ads and recognizing the broader role they play in building sustainable, organic growth. By tracking TACoS, you’re able to see not only how your ads perform but also how they help your products gain traction over time.
If you have your TACoS data, Optmyzr can make all actionable steps, like bid adjustments and keyword optimizations, simpler by enabling bulk changes. You can use the Rule Engine to integrate TACoS data directly into your ad strategy and automate your ad spend optimization based on that data.
When tracked efficiently, TACoS can reveal your business’s growing independence from ad spend. It can be your strategic tool for building a stronger, more self-sustaining brand on Amazon.
Performance Max revolutionized the way marketers advertise on Google, allowing them to advertise across Search, Youtube, display, Discover, Gmail, and local with a single budget and different creatives. Some have fallen in love with the ad type because it removes the bias from budget allocation, while others distrust it because PMax doesn’t allow for as much control and reporting as conventional Google campaigns.
However, the biggest reason PMax is such a polarizing campaign type is because there are no concrete best practices on what makes a successful PMax structure. So, we decided to investigate the most common PMax trends and shine a light on the ones that perform best as well as the tactics that underperform.
In this study, we’ll assess:
Whether what the majority of advertisers are doing is profitable
The impact of other campaigns on PMax
Whether human bias affects performance
How creative and targeting choices impact PMax
What a ‘healthy’ PMax campaign looks like
Methodology
Before we dive into the data, it is worth noting that there is a mix of ecommerce and lead gen campaigns in the cohort.
A total of 9,199 accounts and 24,702 campaigns are included in the data.
Accounts had to be at least 90 days old and have conversions.
Accounts had to have at least $1,000 monthly budget and could not exceed a $5 million monthly budget
We did our best to account for different structure and creative choices, however data at this scope cannot perfectly segment out each use case. We dug into a random assortment of accounts in each question (below) to confirm trends we’re seeing.
Data Questions & Observations
Below, you’ll find the raw data from the study. We’ve also organized the findings in the sections that follow.
Raw Data
Typical structure:
Impact on performance when an account was below or above the average for typical structure:
Only PMax or Media Mix:
Other Campaign Types Present:
This table shows the performance of the PMax campaigns when an account did or did not have the specified campaign type.
Bidding Strategies Used:
This is the breakdown of how each bidding strategy in PMax performs.
Impact of Using Exclusions:
This data shows the impact of using brand exclusion lists and other types of exclusions (negative keywords, placements, and topics).
Is Feed Present:
This data highlights whether there’s a feed in the PMax campaign.
Impact of Audience Signals:
Impact of Search Themes:
PMax Structure:
In the interest of making it easier to understand each Pmax campaign type, we’re applying labels to them:
Starter Campaigns: one campaign/one asset group
Focused Campaigns: multiple campaigns/one asset group
Conversion Hungry Campaigns: one campaign/multiple asset groups
Mixed Campaigns: multiple campaigns/multiple asset groups
How Many Conversions Does PMax Need?
Number of Assets and Types of Assets:
*note there aren’t enough statistically significant amount of advertisers using hotel ads, but we wanted to share the data for those who do use that format.
Percentage of Spend Going To PMax:
What Are Most Advertisers Doing & Is It Profitable?
We organized the findings by major category.
PMax Structural Choices
Most advertisers (82%) in the study run Performance Max alongside other campaign types. The data shows PMax campaigns struggle when paired with other campaign types, which lends credibility to Google’s claims that other campaigns will take priority over PMax.
In addition, there is no clear majority on PMax structure. With that in mind, multiple campaigns with a single asset groups have the best ROAS, second highest conversion rate, and CPA. A single campaign with one asset group might win on CPA and conversion rate, but has the weakest ROAS.
A slight majority of advertisers (55%) don’t use feeds in their PMax campaigns, and see better conversion rates and CPAs, with weaker ROAS. One can infer accounts with feeds are ecommerce and using Max Conversion Value.
Most accounts meet the 60+ conversion threshold needed for success with PMax. Those who didn’t saw worse performance across the board (save CTR).
Pmax Strategy Choices
A slight majority (55%) use the Max Conversion Value bid strategy. 45% use thes Max Conversions bid strategy. Predictably, Max Conversion Value does better with ROAS, while Max Conversions does better with CPA and conversion rate. CPCs and CTR are slightly better for Max Conversion Value.
Surprisingly, the majority of advertisers don’t use exclusions (brand lists, negatives, topics, and placements). Most advertisers (58%) saw a slight improvement in performance when they had no exclusions, but it was ultimately flat. It’s worth noting almost no advertisers use the brand list exclusions (97%) and it was even flatter.
Ninety-two percent of advertisers use audience signals and their accounts struggled on all metrics, save for CTR and ROAS (which were essentially flat). This puts in question whether it’s worth the effort to add in audience signals and if the data seeding the signals can be trusted.
Seventy-one percent of advertisers use search themes and results are mixed, but mostly favor NOT using them.
Most marketers (57%) use all assets available (call to action, text, video, and image). They achieved ‘average’ performance across the board. Interestingly, the ‘best’ performance belonged to PMax campaigns using only text assets. However, this defeats the purpose of PMax, which is designed to help budget go where it can do the most good (visual content and text content). It also illustrates that our perception of ‘best’ is skewed by a search bias.
Perhaps the most surprising insight is how much budget advertisers allocate to PMax—51% of advertisers allocate more than 50% of their budget to this campaign type. Campaigns in these accounts have the strongest ROAS, however every other metric is mixed.
What Impact Do Other Campaigns Have on PMax?
I was not expecting other types of campaigns to ‘triumph’ over PMax campaigns in the same account: Many advertisers assume that PMax will cannibalize branded search and will get preferential treatment in the auction. However, the data seems to suggest that PMax almost always takes a backseat to siloed campaigns.
While the most common other campaign type (Search) had the most obvious wins over Pmax, Shopping had fairly impressive wins as well.
It’s worth noting that visual content (Video and Display) is fairly flat on ROAS, and Display is flat on CPA. This suggests that these campaigns are not as focused on conversion.
Percentage of Spend Going to PMax:
As I mentioned above, there are a surprising number of marketers putting more than 50% of their budgets towards PMax. While these marketers saw the strongest ROAS in their PMax campaigns (625.03%), there are also potential conversion rate and CPA advantages when keeping PMax limited to 10%–25% of the budget.
Does Human Bias Help or Hurt PMax Performance?
PMax’s core guiding logic is ‘profit without bias.’ However, this is also a source of friction for advertisers who are used to having near-complete control. Based on the data, it seems like adding exclusions hurts performance.
This could be for a few reasons:
Branded traffic is cheaper and has better conversion rates. That said, performance was fairly flat between brands that excluded branded terms and those that left them in.
The exclusions were too strict and caused performance issues due to missed placements.
While we can’t say that the exclusions were inherently a bad idea, they represent clear bias around what we think has value. Based on the data, there may be value in loosening exclusions, leaning into content safety settings instead.
The relatively flat performance between these differing tactics is interesting, but not conclusive.
How Do Creative & Targeting Choices Impact PMax?
There’s a common assumption that doing more work on a campaign should lead to better results. Taking the time to teach the algorithm what you value should lead to better results.
However, the data seems to contradict this assumption.
Impact of Audience Signals:
Impact of Search Themes:
As we can see, performance is flat (or worse) when Audience Signals and Search Themes are included. This seems to indicate that investing the effort on these tasks isn’t worth the ROI.
However, it’s also worth remembering PMax will take a back seat to siloed campaigns. Search Themes remain one of the most powerful ways to ‘mark’ traffic for PMax (over siloed campaigns). This is because Google prioritizes exact search terms going to exact match.
Brands should be intentional with audience signals and search themes, treating them as guidelines instead of hard targets.
With regard to creative, while the majority of advertisers lean into all assets, there seems to be a decided benefit to just including the assets you can reasonably support. There is no denying the text-only asset cohort skews the numbers for including one asset, however the correlation on ROAS supports not including creative just for the sake of it.
It’s also important to remember the wide ranges of CPAs reflect a wide range of industries, and there are some categories with statistically insignificant data.
Number of Assets and Types of Assets:
If there’s one ‘magic’ creative button for PMax, it’s video. While text-only had the best overall metrics, those are limited exclusively to Google Search. Video’s strength is that it keeps up with text while accounting for lack of focused transactional intent.
From these two datasets, you can see that it’s best not to mindlessly fill out all the fields. Be intentional about your targeting and creative choices, honoring the point of the ad channel you’re using to reach customers.
What Does a Healthy PMax Campaign Look Like?
Now that we’ve investigated what the majority of advertisers are doing, let’s look at some directional queues we can take from the data.
PMax Structure:
The metrics seem to favor running multiple campaigns with one asset group per campaign, allowing brands to utilize unique budgets and negatives. However, there are also CPA and conversion rate gains associated with one campaign-one asset group.
This inspired us to investigate whether the latter group were ecommerce advertisers building on the habit of Smart Shopping (which didn’t require as much segmentation). However, most marketers in this category didn’t attach a feed and had better results. So, there is something to the single campaign and asset group strategy.
These findings run counter to the data that we pulled last time and shows Google has significantly improved how it understands user queries. That said, if you can find the conversions, multiple campaigns with a single asset group are the way to go because they guarantee budget access for the parts of your business you care about.
We took some benchmarks on how most of the 9,199 accounts are structured and found the following averages:
3 PMax campaigns per account
4 asset groups per campaign
34 assets per asset group
We explored accounts that fell below and exceeded these numbers:
These figures are mostly impacted by the number of asset groups and assets. The data seems to indicate fewer and more thoughtful entities have a higher chance of success than loading up on all the assets and asset groups.
Finally, we couldn’t have a complete conversation about healthy campaigns without diving into conversion thresholds.
How Many Conversions Does PMax Need?
It shouldn’t surprise anyone that PMax needs more conversions to be useful, but what is surprising is how flat CTR is compared to conversion rate. I would have expected CTR to have more volatility at lower conversion rates, (due to Google trying to figure out which traffic is valuable).
This data supports the idea of limiting campaigns if you won’t be able to hit 60+ conversions in a 30-day period.
Tactics from the Data
As we stated previously, we’re not going to declare one path as correct or incorrect. However, based on the data, we feel confident sharing the tactics below:
Multiple asset groups in the same campaign don’t work as well as ad groups in a campaign because there aren’t asset group-level negatives. Depending on your budget and ability to meet conversion thresholds, you can decide to run a single PMax campaign with a single asset group or multiple campaigns with a single asset group.
Be careful about biases on where ads should serve and how many negatives to include. While some exclusions are necessary for brand safety, the data is clear that PMax needs fewer limitations on its learning. Consider using account-wide exclusions over campaign-level ones.
PMax is designed to work in concert with your other campaigns, and brands that rely solely on PMax (as well as brands that run Pmax on auto-pilot) will struggle to achieve sustainable results. Brands that use PMax as a testing ground for keyword concepts, placements, and other insights will get more out of this campaign type because they are allowing the bias-free traffic to add incremental gains.
Experts React
“It was super exciting to dive into research that explores such a dynamic and evolving campaign type as Performance Max (PMax). This study offers valuable insights that both confirm and challenge established PPC strategies.
One of the standout findings is the critical importance of conversion volume. The data reinforces the idea that achieving an optimal level of conversions is essential for campaign performance. This makes it a key consideration when planning or restructuring campaigns - ensuring enough conversion data is present to enable effective machine learning and optimization.
I also found the analysis of campaign and asset group configurations intriguing. While it would be useful to further explore how these configurations differ across ecommerce and lead generation accounts, the findings can serve as a solid foundation for further experimentation and optimization.
Moreover, the study challenges some widely accepted beliefs about audience signals and search themes. The findings suggest that adding more signals doesn’t always result in significant performance gains, which prompts a re-evaluation of the resources invested in these areas. This invites a fresh perspective on how we approach campaign management - focusing less on volume of inputs and more on the quality of core components like conversion data and asset structure.”
Julia Riml, Director of New Business, Peak Ace
“The most important finding to me (and further confirming what we already knew) is the importance of sufficient conversion volume which is important for machine learning to work to it’s full potential and which also guides our optimization steps.
The aspects I found most surprising were how many advertisers seem to be running PMAX as a standalone campaign (without search, video and display campaigns accompanying it) and that PMAX campaigns that didn’t utilize a feed (lead generation?) on average tend to perform better with regards to CVR and CPA.
Lastly, it shows the importance of diversifying your spend - the more you spend on PMAX in relation to other campaign types, the worse your CVR and CPA tend to be.
Super intriguing stuff and a must read for everyone working with Google Ads."
Boris Becceric, Google Ads Consultant, BorisBecceric.com
“I am a PMax skeptic, however this analysis presented me with a few surprises, in among what we already know to be true. It is not a surprise that PMax performs better with max conversion value and with more conversion data. However, I am surprised at the amount of advertisers spending the bulk of their budget on PMax, and at the impact (or lack thereof) of exclusions.
As with anything in the PPC world, it remains important to assess your individual business context. What metrics are most important to you? At the very least, I’d argue PMax now deserves to be tested by everyone who can accurately assess/import conversion value.”
Amalia Fowler, Owner, Good AF Consulting
“This Performance Max study provides valuable insights into the strengths and weaknesses of this Google campaign type. The most striking finding I noticed is that PMax often plays a secondary role compared to other campaign types like Search and Shopping, indicating that PMax does not always receive preferential treatment in the auction process.
The data suggests that multiple campaigns with a single asset group yield the best ROAS, and that limiting exclusions and avoiding the indiscriminate addition of assets are key to success. Despite the growing adoption of PMax, human bias can sometimes hinder performance by imposing too many restrictions. From my experience and knowledge I would highly recommend to make sure to test best practices and always be aware that it’s not a one-size fits all campaign type.”
Lars Maat, Owner, Maatwek Online
“One of my biggest takeaways from this study is that PMax seems to perform better when it’s targeted well and not used more broadly. For example, multiple campaigns with one asset group being one of the highest performers stood out to me. PMax learns at the campaign level so, perhaps these campaigns are more highly targeted allowing the campaign to learn exactly who to target. While the one PMax with multiple asset group set up more than likely has variation by product or service type meaning multiple types of customers need to be targeted. As mentioned, PMax lacks the ability to have asset group level exclusions or asset group level ROAS/CPA targets to help control for variations in users or goals. Additionally, that campaigns with fewer assets seemed to perform better suggests that more targeted creative is a better option than generic or broad assets.
Based on this study, with the data and signals that PMax has access to, it seems that focusing it on targeting one customer type with plenty of data can be a successful strategy. This would allow you to keep your creative narrow and use only very specific signals.
As always, this is another excellent thought provoking study into Google Ads from Optmyzr!”
Harrison Jack Hepp, Owner, Industrious Marketing LLC
“Another insightful case study by Optmyzr. Some of the results are consistent with the finding of the previous one on bid strategies - Max. Conv. and Max. Conv. value again deliver what is expected from them.
An important finding for me is the benchmark of 61 conversions, which can explain why sometimes single PMax campaigns can be the better option. Still, some of the results suggest that multiple campaigns with a single asset group are a great option too. For E-Commerce, I have a clear preference for Performance-Based-Bucketing and in my experience multiple campaigns deliver better performance than a single consolidated campaign.
The case study undoubtedly demonstrates that human bias can hurt performance. I was aware that Search themes have negative effects on other campaigns, but now I am surprised that they might be having them on PMax too. The most surprising results regard the use of Audience signals (associated with negative performance effects) and the efficiency of PMax for Lead Gen accounts. I am ready to adjust my strategy and leave out Search themes and Audience signals behind (probably except for Customer match and Remarketing lists) and give more chances to PMax for LeadGen.”
Georgi Zayakov, Senior Consultant Digital Advertising, Huttler Consult
“The fact that Performance Max (PMax)-only campaigns show higher ROAS doesn’t surprise me, as PMax often behaves like a bottom-of-funnel conversion campaign. When other campaigns, such as non-brand search, are run alongside PMax, I expect metrics like ROAS and CPA to be worse, since these campaigns target different stages of the funnel and often require more consideration from consumers.
One particularly interesting finding is the limited use of PMax alongside YouTube video campaigns. Despite the control YouTube offers, PMax seems to underutilize video, reinforcing its role as a bottom-of-funnel tool, however I would have expected the ROAS difference to be higher.
I’ve also found that standard shopping campaigns often conflict with PMax, so seeing higher ROAS in these cases is surprising—though I’d handle this on a case-by-case basis.
The study’s insight into a single asset group driving higher ROAS is fascinating. I typically run different creatives for seasonal campaigns or separate product lines with similar margins in their own asset groups under one Pmax campaign. However, this data suggests that brands can simplify their approach, running a multi-product photoshoot with a branded YouTube video and still see success. This significantly lowers the creative burden for advertisers.”
Sarah Stemen, Owner, Sarah Stemen LLC
“My team found this report immensely helpful and illuminating. We have heard conflicting things from Google on Search themes, for instance. It was helpful to confirm our suspicions that they don’t have much impact on PMax performance so we can invest our energy elsewhere. We are still pondering the study in general as to how it will practically impact the way we segment campaigns, but there are certain things we gained immediately from it. We always create Standard Shopping campaigns in accounts, even if they are PMax heavy, so it was encouraging to see this supported in the study and we have more confidence in the energy we invest in that effort now that we have read the study. I also was particularly intrigued by another study (similar to the one Mike Ryan and SMEC did awhile back) looking at conversion volume. Without a doubt now after these two studies, a significant amount of conversions are needed to increase confidence levels in PMax success. Overall, I found this study thought-provoking and practical, thanks Optmyzr team!”
Kirk Williams, Owner, Zato PPC Marketing
Final Takeaways
PMax’s evolution invites us to evaluate our previous strategies. Where exclusions and specific human control used to be key to success, we seem to be entering an era where we won’t have enough data to make those choices ourselves.
However, key business info (conversion value/efficacy, removing existing customers/users who won’t be a good fit, and creative) still require human involvement.
If you’re looking for ways to achieve better automation layering, Optmyzr can help! Between our tools to help with PMax search term analysis, budget allocation, and removing bad placements, there’s a whole world of innovations and optimizations to explore.
One of the most critical parts of advertising is choosing the right bidding strategy for your campaign. However, with so many conflicting viewpoints (usually data backed and/or voiced by experts), it can be hard to understand what the right strategy for your client(s) should be.
To that end, we wanted to examine two key questions:
Which bidding strategy performs best over the most accounts?
When advertisers use more than one bidding strategy, what percentage of ad spend goes to which strategy?
Methodology: Data Framework and Key Questions
First, let’s look at how this study is organized. We divided the data and questions into the following sub-questions:
Which is the best overall bidding strategy: Smart, Auto, or Manual bidding?
Do bidding strategy targets help improve campaign efficiency?
Do bid caps help improve campaign efficiency?
What are the real conversion thresholds for optimal performance?
Does spend influence the success of a bidding strategy?
What percentage of advertisers use more than one bidding strategy?
Does The Data Translate To Lead Gen & Ecommerce?
Criteria and Definitions
To answer these questions, we did a deep dive into the international Optmyzr customer base. This study looks at all Google bidding strategies (with some inferences applicable to Microsoft Ads) across 14,584 accounts. We applied the following criteria:
Accounts must be at least 90 days old.
Accounts had to have conversion tracking configured.
Accounts must spend at least $1,500 and could not spend more than $5 million per month.
Before we dive into the data, it’s important we clarify a few key terms:
Smart bidding — Bidding managed by an ad platform based on conversion data
Auto bidding — Bidding managed by an ad platform based on clicks or impressions
Manual bidding — Bid and bid adjustments managed by a human
1. Which Is the Best Overall Bidding Strategy: Smart, Auto, or Manual Bidding?
Before we go over observations and takeaways, it’s really important to understand that the data may point to a ‘winning’ strategy that may not work for you and your business. Always factor in your own business conditions before making bidding decisions.
We’ll first share with you the raw data, then we’ll share the ranking based on weighting the following metrics in descending order:
ROAS: 40%
CPA: 25%
CPC: 15%
Conversion Rate: 10%
CTR: 10%
Observations:
Max Conversion Values continues to beat Max Conversions with a significantly better ROAS, CPA, CPC. While conversion rate and CTR are slightly better for Max Conversions, Max Conversion Value wins where it matters (ROAS).
Max Clicks delivers acceptable performance and is an underutilized bidding strategy.
Manual CPC is not the outright winner in any category, but delivers strong performance. The caveat to this is it’s not as efficient for CPA, CTR, or conversion rate.
Target Impression Share’s metrics indicate top-of-page placement helps CTR and conversion rate, but won’t actually help with profit metrics (CPA, ROAS).
Takeaways:
There is no clear winner between Smart, Auto, and Manual bidding. All three types have strong and weak metrics.
Max Conversion Value is the most efficient Smart bidding strategy.
Maximize Clicks is the most efficient Auto bidding strategy.
Manual bidding has the third highest ROAS, but really struggles in other categories. As such, you should only use it when you can actively manage the bids (more on this in the tactics section).
There is room for testing as the stronger bidding strategies have less adoption than their weaker counterparts.
2. Do Bidding Strategy Targets Help Improve Campaign Efficiency?
With regard to targets, there are essentially two schools of thought: they’re either useful to help guide the algorithm or they represent risk due to human error.
Here’s what the data says:
Observations:
The majority of advertisers using Max Conversions do not set a target and see better performance on the most important KPIs like ROAS and CPA than those who do.
It’s a similar story for Max Conversion Value; advertisers who do not define a target see improved results for all metrics except ROAS which has a slight dip but is essentially flat. However, the majority of advertisers do set a goal.
There doesn’t appear to be a bidding strategy that significantly benefits from adding a goal, which is unfortunate because adding goals is tied to bid caps and floors. It’s unclear if this is due to human error or the nature of goals themselves.
This is where we get to see the real impact of eCPC (retiring March 2025). While conversion rates and CPA are great, the ROAS doesn’t meet expectations. However it is worth noting that eCPC beat Max Conversions
Takeaways:
Setting targets for bidding strategies has a higher likelihood of hurting accounts than helping them.
The only bidding strategies where targets appear to help are Manual bidding and Target ROAS. It seems reasonable to assume that if an advertiser is willing to take on the work of bid adjustments and accurate revenue/profit sharing, they will set accurate bidding goals.
3. Do Bid Caps Help Improve Campaign Efficiency?
One of the biggest reasons to opt into bidding goals is to access bid caps (and floors). A bid cap is the most you’re willing to let Google bid, while the floor forces Google to use a minimum bid for all auctions. You can access these settings through portfolio bidding strategies for Smart bidding and Max Clicks/Target Impression Share.
Observations:
Whether or not bid caps are used has no consistent impact on performance, which explains why most advertisers don’t use them. This also explains why some advertisers avoid bidding goals (given that bid cap access is one of the big benefits of goals).
ROAS-oriented bidding strategies seem to benefit the most from bid caps. CPA-oriented bidding strategies are mixed (decent ROAS, but weak CPA and CPC). CTR and conversion rates are strong but not strong enough to make up for almost double the CPA.
While Max Clicks appears to have mixed results with bid caps, Target Impression Share clearly needs them (note: there wasn’t a statistically significant sample size for non-bid cap Target Impression Share).
Takeaways:
Most advertisers don’t use bid caps. Whether this is a good or bad thing depends on the bidding strategy.
Bid caps are not inherently good or bad, however they do introduce the potential for human error.
Bid caps (and floors) only make sense to use if you also apply intelligent bid caps and floors.
4. What Are the Real Conversion Thresholds for Optimal Performance?
We’ve long since passed the ‘15 conversions in 30 days’ era of Smart bidding. Ad platforms recommend that we meet minimum thresholds to see success. However, we weren’t sure what the threshold actually is for different types of bidding strategies…enter the data!
Observations:
Most advertisers clear 50+ conversions in a 30-day period and see better performance compared to accounts with fewer conversions.
The jump from under 25 conversions to 25–50 conversions doesn’t always result in a performance improvement. This may explain why some advertisers don’t trust Smart bidding at lower conversion volumes.
Manual bidding also benefits from high conversion volume.
Max Conversion Value has a slight edge over Max Conversions at all conversion volumes, indicating that Google has an easier time working with conversion values than stand alone conversions.
Takeaways:
The threshold for any bidding strategy to be predictably successful is 50+ conversions.
Some success can happen at lower thresholds, but there’s more volatility.
Manual bidding also benefits from higher conversion volumes, so if your only reason for choosing manual bidding is your lack of conversion data, we recommend finding ways to increase conversion volume.
5. Does Spend Influence the Success of a Bidding Strategy?
One of the most common assumptions around Smart bidding is that it requires big budgets to be successful. We were curious if this held up across all bidding strategies.
We ranked the bidding strategies by their probability to achieve profitability at lower spend levels (using the same criteria as before) from highest to lowest:
Observations:
The only bidding strategy where performance consistently improves as spend increases is Manual bidding.
The sweet spot for Smart bidding appears to be $10K–$50K (focusing on ROAS and CPA). Conversion rate and CTR seem to favor higher spend, but those aren’t profit metrics, which might explain why some brands tank their campaigns with large budget shifts if/when they move to Auto or Smart bidding).
Most advertisers using Max Clicks are low budget accounts, which makes sense given the conventional wisdom that ad accounts need big budgets for conversion-based strategies.
Takeaways:
As long as you have the conversions, low spend shouldn’t get in the way of Smart bidding.
The only bidding strategy that seems to handle big changes to budgets consistently is manual. Every other bidding strategy does best with specific spend brackets.
6. What Percentage of Advertisers Use More than One Bidding Strategy?
An interesting finding that came out of the data is exactly how many advertisers use multiple bidding strategies in the same account.
Category
COUNT of accounts
% of accounts
Multiple bidding strategies
7,061
48.42%
Single bidding strategies
7,523
51.58%
Observations:
Most advertisers use the same bidding strategy throughout their account.
Those using multiple bidding strategies seem to have a ‘starter’ bidding strategy as campaigns ramp up, and then transition to others.
Those sticking with one bidding strategy seem to have ‘loyalty’ to one. They stick with the same bidding strategy regardless of performance fluctuations.
Takeaways:
Testing bidding strategies is healthy but it’s not mandatory for success. Clinging to one bidding strategy may be comfortable, but it’s not as risk averse as it seems.
7. Does The Data Translate To Lead Gen & Ecommerce?
There is no denying lead gen and ecommerce strategies are different. As such we wanted to share the data of how bidding strategies fared with each account type.
Observations:
Max Conversion Value continues to dominate in lead gen. While CTR and Conversion Rate are lower than ecommerce, all metrics beat out Max Conversions.
Ecommerce advertisers seem to struggle with Manual CPC and Max Conversion bidding. I find it odd how many ecommerce advertisers are using Max Conversions instead of Max Conversion Value.
While more ecommerce use Max Clicks, lead gen advertisers seem to do better with it. Manual CPC seems to be the safer “early stage” campaign bet (despite it being a weaker bidding strategy overall for ecommerce).
The most popular bidding strategy for the studied ecommerce cohort is Max Conversions. The most popular bidding strategy for the studied lead gen cohort is Maximize Conversion Value. This was a shocker, because
Some of the cheapest Lead Gen CPCs and strongest ROAS was with Max clicks and manual CPC.
Takeaways:
Lead Gen Max Conversion Value outperforms Max Conversions by almost 300% on ROAS. This supports advertisers using Max Conversion values regardless of whether they are lead gen or ecommerce.
Tactics from the Data
There are a lot of tactics that come out of the bidding strategy data, but the biggest one is not to fall into the trap of thinking that Smart or Auto or Manual are inherently better or worse than the other. It all comes down to execution and where your account is on the conversion volume/efficacy front. Many accounts use mixed bidding strategies, which speaks to the value of leveraging all the bidding strategies at each stage in the account.
As a general rule, Manual and Auto bidding are favorable in early stage accounts. This is because these bidding strategies aren’t reliant on conversions and represent learning opportunities around auction price. As an account ramps up, it’s reasonable to start testing Smart bidding (provided that you have at least 50 conversions in a 30 day period).
However, just because an account is low-budget doesn’t mean that it can’t see success with a Smart or Auto bidding strategy:
High-spend accounts ($100K+) didn’t always fare better than lower-spending accounts (i.e., less than $10K).
Maximize Conversions had a median conversion rate of 10.68% on low-spending accounts, while high-spending accounts had a conversion rate 7.01%.
While it’s true that the ROAS was slightly better (at 184% versus 175%) with higher spend, it doesn’t change the fact that the CPAs, CPCs, and click-through rates were better at less than $10K spend.
However, conversion thresholds still matter. There is no account that performed better at less than 25 conversions than those that had more than 50. In fact, even Manual bidding did demonstrably better on cost per acquisition, ROAS, click-through rate, CPC, and conversion rate when there were more conversions.
The big takeaway here is that just because your spend is low doesn’t mean you have to shy away from Smart bidding, but it does mean that you need to be honest about your conversion actions. In terms of which conversion actions you include, you can consider using micro conversions if you want to avail yourself of Smart bidding, but it’s really important that you actually put in the different conversion values for each action so that Google can get the data it needs to efficiently allocate your budget.
The other major optimization opportunity within the account is thinking about how you allocate your budget. Of all the bidding strategies, only Manual bidding had a linear correlation between budget size and bid performance. However, when you look at all the other bidding strategies, big spikes or decreases in budget did cause performance issues.
As a general rule, when you’re increasing or decreasing a budget in a Smart bidding campaign, you’ll want to make sure that you allocate somewhere between two to three weeks for that budget to settle.
In regards to bid caps and floors, as well as setting targets, I was surprised that targets seemed to hurt performance more than help it. And while I have my suspicions that human error (seting caps/goals that don’t align with the budget and targets) is part of the issue, there is no denying that applying a target represents risk.
If you’re going to use targets, which unlock the path to bid caps and floors (that can lead to performance improvements in certain cases), ensure that you apply the right targets (and bid caps and floors).
The first thing to consider is what a reasonable target for your campaign might be. So if you historically hit a $50 cost per acquisition or a 200X ROAS with no goal, it is reasonable to set a cost per acquisition goal of $45 to $55 not see any major change (i.e., you are keeping the goal +/-10% of the original performance). The moment you go beyond that 10%, you invite risk. And so the only reason to do this is if you know that the historical performance doesn’t reflect the actual results you are seeing.
For example, if you know that your conversion tracking isn’t set correctly, or if you don’t trust your data, you can play a little bit faster and looser with the settings, because the information that’s currently fed to Google isn’t accurate. And as a reminder, you may decide that you want to exclude certain data that you know you don’t trust.
When it comes to bid caps and floors, I have always endorsed keeping bids to 10% (or less) of your daily budget, so you can fit at least 10 clicks per day.
If you choose to go beyond that 10%, there’s a very real chance that you will not get enough clicks per day, and Google will either under serve your budget, or your bid floors will be too low, you’ll over serve in the wrong auctions, and you will have misguided your budget.
When setting up your bid floors and caps, be mindful that you’re doing so as corrections, not as a control lever. If you see that your impression share is historically lost due to rank, you may decide that you want to set a higher bid floor (while not including a cap) to force Google to invest your budget in the way that will serve you.
If you’re struggling on quality, you may decide that you want your bid cap to be 10% or even 15% of your daily budget, but acknowledge that you’ll get fewer clicks per day. So, you just have to account for that in your conversion rates. It’s really critical that you’re honest about the quality of your leads and what those bid caps and floors can do for them, as well as making sure that your targets are reasonable based on your historical performance.
Experts React
“This study challenges many misconceptions about Google Ads, which is thrilling! Seeing that campaigns using Target CPA achieve the lowest CPA of all bid strategies, and that campaigns using Target ROAS achieve the highest ROAS of all bid strategies, confirms the effectiveness of target-based Smart Bidding.
The most important takeaway from this study for me, however, is that budget is not the most important factor in Smart Bidding success; conversion volume and values are. Increasing your budget does not mean you’ll achieve better efficiency, but increasing your conversion volume is correlated to better results for every single bid strategy studied.
Going forward, I will continue recommending that my clients implement micro-conversions if they don’t have sufficient conversion volume, and continue recommending using conversion values even for non-ecommerce businesses.“
Jyll Saskin Gales, Founder and Coach, Jyll.ca
“My question as I read through all the data was - what percentage of the accounts reviewed were e-commerce? I’d love to see how the data shakes out across these categories for e-commerce and lead generation.
But even without that split being shown, seeing that accounts really do need 50+ conversions is validating! As someone who often works on accounts with low (fewer than 50 per month) conversions, I have long believed that those conversion levels were a hinderance and seeing it confirmed in a large data set is helpful.
It is also nice to see that manual bidding does have a place in these automated times! The data about using conversion values and not just bidding toward conversion generally was also very interesting. I think we can sum up where things are continuing to go by saying Google wants more information from advertisers (conversion values being one data point) so that it can add that to their system data to try to increase campaign performance.
Also nice to see that adjusting your budgets with some of the auto or smart strategies can cause volatility. Again, many of us see things in the accounts we work on and hear about it from friends and their accounts, but seeing a large data set reporting that it is widespread is also very helpful in setting expectations - both ours and for our clients.”
Julie Friedman Bacchini, Founder of PPC Chat/President and Founder of Neptune Moon
“One of my first takeaways is that max clicks performs at a similar if not better level than max conversion. As was noted, maximize clicks is really an underutilized bidding strategy as users try to jump straight into smart bidding using maximize conversions. I’ve found that using maximize clicks with appropriate bid adjustments can actually be a winning strategy for some accounts.
I wasn’t surprised to see that the key component in bidding strategies continues to be conversions and conversion volume, however. This remains one of the biggest challenges for smaller advertisers and even manual CPC or auto bidding doesn’t entirely overcome the challenge. The importance of micro conversions only continues to grow for marketers who work with lower conversion volumes.
I’ll also admit that this study challenges my view on maximize conversion value as a bidding strategy. I’ve always thought that maximize conversions was a better bidding strategy and have often only used conversion value bidding if I can set a target ROAS with it. This serves as a good reminder to test your assumptions or at least avoid writing strategies off without due consideration!”
Harrison Jack Hepp, Founder of Industrious Marketing LLC
“Some big surprises here at first glance, but things are never simple. As the saying goes in the SEO community: “It depends,” and that holds true here as well. Take, for example, setting up targets and bid caps. The data shows that these strategies aren’t always beneficial. Does this mean we’ll change our advice to clients? Likely not. It may seem surprising until we consider who sets those numbers and based on what data. We’d still argue that in many cases, setting a CPA target while also establishing bid caps and floors is a balanced strategy—assuming the data is reliable.
In essence, the study confirms what we universally know: better data equals better performance. Unfortunately, not everyone understands what “better data” really means or how to achieve it. That’s where the complexity comes in, especially with increased focus on privacy. We’ve already been developing strategies to improve the data quality and the study confirms the need. Strategies such as server-side tracking which in testing is showing 18% uplift in main conversion event relative to client-side. This is all data that helps us and the system make informed decisions that manage risks. But again, it only works if the setup and measurement framework are solid from the start. That’s the difference between stunting your account’s performance and letting Google do as Google wants.”
Emina Demiri-Watson, Head of Digital Marketing, Vixen Digital
“This study provides really valuable insights into Google Ads bidding strategies. One surprising finding was the high usage of ‘Maximize Conversions’, despite its relatively low ROAS and high CPA. I understand that the accounts are using multiple bid strategies and the bigger picture is important but I found this interesting non-the less. As a proponent of Maximize Clicks, I’m pleased to see its performance validated. This bid strategy is particularly suitable for smaller businesses or those seeking a less hands-on approach. I recommend max clicks for alot of my b to b clients when there isn’t much competition and when the terms that are searched are straightforward. This data point is helpful to that cause.
The study also highlights the importance of conversion volume for manual bidding. This aligns with the traditional “rule of 100s,” where bids were adjusted based on performance metrics (100 clicks or more with no conversions lower the bid, or if a keyword spends $100 or more with no conversions lower the bid). While this is an old school way of doing manual bidding, we still relied on data to make the decision before smart bidding. Seeing this data shows that 15 years ago we weren’t as far from the mechanics as we thought.”
Sarah Stemen, Founder of Sarah Stemen LLC
“I always enjoy it when I get my hands on Google Ads studies that look at big data sets.This one about bid strategies provided great insights. Among the things I found confirmed from my own analysis are the importance of conversion volume as the basis of any bid strategy and that maximize clicks still has its place. It can perform the same or even better in certain scenarios.
What surprised me, as a proponent of bid floors and bid caps, was the section about bid caps not having a consistent impact on performance. Guess that goes to show that, as the saying goes, it depends.
I was pleasantly surprised by manual CPC and the way it performs, but only when you actively manage the bids - but this always used to be the case and us “old schoolers” are used to it being that way.”
Boris Beceric, Founder and Coach, BorisBeceric.com
“I’m pleased to see that, as of today, there is still no universally superior bidding strategy; performance varies based on execution, conversion volume, and account specifics. When you have 50+ conversions, Smart Bidding is often the best approach, and this aligns with my observations.
A key takeaway for me is the quality of data we provide to Google. Different bidding strategies require different data inputs. It’s crucial to include micro-conversions when they are relevant, and the bid strategy must align with this data. When aiming to drive high-value deals, both the data quality and campaign setup are critical.”
Andrea Cruz, Sr Director, Client Partner Tinuiti
Final Takeaways
Bidding strategies should be evaluated based on the goals for the campaign and resources available. There is no concrete answer on which bidding type (Smart, Manual, or Auto) is better, however there are signals advertisers can follow for the best one for their campaign.
Just because you’re using Smart or Auto bidding doesn’t mean you lack control. If you’re interested in layering automation into your workflow and getting the most out of your budget, Optmyzr has several tools to help you on the path to profit and victory.
If you’re not an Optmyzr customer already, you can sign up for a full functionality trial here.
Great ad copy is critical for Google Ads success. However, it can be tough to understand which rules of engagement work best in today’s PPC landscape.
While there are many perspectives on the best way to optimize ads (and each method has its own place), few are backed by statistically significant data.
At Optmyzr, we have access to that data, so we asked our analysts to look for trends in ad optimization strategies that drive meaningful performance improvements.
We believe it’s important to share this data—not to amplify or discourage any specific strategy, but to inform you about what each creative choice can mean for your account. Ultimately there is no right or wrong answer, just higher or lower probability for success.
Let’s take a look at the data so that you can better contextualize which ad optimizations might yield the best ROI for your campaigns.
Methodology: Data Framework and Key Questions
Keep in mind the context below as you review our study and takeaways.
About the data:
We reviewed over 22K accounts that had been running at least 90 days with a monthly spend of at least $1500.
We reviewed over one million ads across responsive search ads (RSAs), expanded text ads (ETAs), and Demand Gen. However, API limitations prevented us from pulling asset-level data for Performance Max campaigns.
For monetary stats, we converted currencies to USD and used those to find the average CPAs and CPCs.
Here are the questions we aimed to answer:
Is there a correlation between Ad Strength and performance?
How does pinning impact performance?
Do ads written in title case or sentence case perform better?
How does the length of the creative (character count) affect performance?
Do ETA tactics translate to RSAs and Demand Gen ads?
When evaluating our results, it’s important to remember that Optmyzr customers (the data set) represent advanced marketers. As such, there may be a selection bias that could result in more data on successful strategies. It’s possible that results could vary when evaluating a wider advertiser pool with a more varied range of experience.
Ad Creative Choices Data & Analysis
In the sections below, we’ve included raw figures, observations, and takeaways to help you better understand the degree to which various ad optimizations influence performance.
Is there a correlation between Ad Strength and performance?
While Google has made it very clear that Ad Strength is not a ranking factor and meant to be a helpful guide, practitioners tend to have mixed to negative sentiment towards it because it gets conflicting attention from Google and doesn’t seem to be useful in managing creative.
“A higher Ad Strength doesn’t mean a better CTR or a better conversion rate or a better Quality Score. If you’re new to advertising or don’t know what’s going to work, consider this a piece of advice.
But if you’re an experienced advertiser, go ahead and do what you do best. Create the ad that resonates well with your target audience and keep the focus on performance. Don’t just be blinded by the Ad Strength.”
Does the data back him up? Below (and for all the tables in this study), we’ve listed the rows of data in order of descending performance (i.e., the first row is the highest-performing group, while the last row is the lowest-performing):
Responsive Search Ads (RSAs):
Demand Gen Ads:
Observations:
RSAs with an ‘average’ Ad Strength have the best CPA, conversion rate, and ROAS.
Other than ROAS, Demand Gen ads with an ‘average’ Ad Strength performed the best.
There is no meaningful difference in CTR for ads with different Ad Strength labels, which indicates that Ad Strength either doesn’t factor it in, or likely could never be a ranking factor. This is of note because Quality Score (which is a factor in the auction/Ad Rank) does have a clear relationship with CTR. We include this point because many were suspicious of Google using Ad Strength as a ranking factor.
For RSAs, ROAS appears to decline sharply when going from ‘average’ to ‘good’ Ad Strength. While the transition from ‘good’ to ‘excellent’ shows a slight increase, it doesn’t come close to the disparity between ‘poor’ or ‘average’. This may be influenced by the ‘human’ factor (the majority of advertisers favor max conversions and simple conversion values, according to our bidding strategy study [10,635 use Max Conversions vs 7916 Max Conversion Value]).
Demand Gen’s metrics make a stronger case for paying attention to Ad Strength due to clear ROAS win in the ‘good’ category, however the decline associated with ‘excellent’ Ad Strength still makes it a dubious optimization guide at best.
The conversion rates for Demand Gen ads are very similar to those of RSAs. This is surprising, considering Demand Gen ads drive awareness whereas RSAs are traditionally focus on driving transactions.
Takeaways:
There is no clear correlation between ad performance and Ad Strength. Ad Strength is not a metric to sweat over.
The majority of ads have an Ad Strength label of ‘poor’ or ‘average’, but perform well on typical advertising KPIs.
Ads with ad strength labels of ‘good’ or ‘excellent’ have mixed performance on typical advertising KPIs.
How does pinning impact performance?
Pinning refers to designating an asset to a particular position in the ad (Headline 1, Headline 2, or Headline 3). Pinning came about with the rise of Responsive Search Ads.
Some preach pinning everything to force ETAs (meaning there would only be three headlines and each would be pinned to their respective spot), while others prefer to abstain from pinning. Those who abstain from pinning lean into RSA’s built in testing. Check out the “Experts React” section for specific reasons why some pin or don’t.
Here’s the data on pinning (including the performance from ETAs for easy comparison—note that ETAs are a retired ad type and cannot be edited):
RSAs:
ETAs:
(We’ll revisit this table when we discuss creative length.)
Observations:
Some pinning continues to be the winning strategy based on CPA (though no pinning is a close second), ROAS, and CPC. Conversion rates suffer when you pin.
Ads where every element is pinned have the best performance for the relevance metric: CTR.
Ads with some or no elements pinned have the best performance for conversion or cost-based metrics, like CPA, ROAS, CPC, and conversion rate.
While CTR is technically a win for pinning, the CTRs are very close, so it’s hard to say pinning is truly responsible.
In most cases, RSAs outperform ETAs (even in ads with all pinned assets). However ETAs with 31+ characters (indicating DKI/ad customizer usage) performed so well that it comes across as outlier data.
Takeaways:
Advertisers who attempt to recapture the ETAs days are setting themselves up for worse conversion-based performance.
Pinning some assets has a positive impact on ad performance, but it’s essentially flat compared to pinning no assets (ROAS is the only exception). As such, pinning should be a creative/brand choice—not a concrete Google Ads tactic.
Most advertisers would benefit from fully migrating to RSAs (which allow for pinning).
Do ads written in title case or sentence case perform better?
The ‘title case vs. sentence case’ debate is probably one of the firecest debates, so we were curious how this stylistic choice impacted ad performance.
For your reference, here’s a text example with each respective formatting:
Title case:This Is a Title Case Sentence
Sentence case: This is a sentence case sentence
We’ve grouped the accounts based on the percentage of an account’s ad text elements that use title case. So for example, accounts in the row marked ‘0%’ use no title casing at all. 0% should be understood as pure sentence case structure, while 75-100% should be understood as pure title case.
RSAs:
ETAs:
Demand Gen:
Observations:
The biggest observation is the number of advertisers who mix title and sentence case in the same ads and accounts. This runs counter to the historical norm that advertisers tend to pick one and stick with it.
ROAS seems to favor sentence case, but most advertisers tend to use title case.
There is no hard-and-fast rule for all ad types. RSAs and Demand Gen ads appear to do better with sentence case, while ETAs seem to do better with title case.
Takeaways:
As RSA and Demand Gen ads using sentence case performed best on all primary advertising KPIs, we recommend all advertisers include ads with sentence case in their testing.
One possible reason why ads using sentence case perform well is that they are the same format typically found in organic results, which are usually perceived as higher quality by users.
Do not turn off ETAs that perform well, as they have the potential to outperform RSAs (though most won’t) and you won’t be able to re-enable them again later.
Title case seems to be a habit from ETAs, but in most cases, advertisers do better with sentence case.
How does the length of the creative (i.e., character count) affect performance?
Ad copy is a kind of haiku—you need to convey clear and enticing meaning in very few characters. Yet there’s more nuance to consider: is bigger better?
(Example SERP with three RSAs—each with some creative cut off or moved to a different spot.)
Google has made a habit of truncating creative for years, and it’s no surprise that headline creative gets more viewership and impacts performance to a larger degree than the description. However, since underperforming headlines can appear in descriptions (instead of being in position #2), there’s an even greater pressure to get the balance right.
Headlines appear to benefit from concision, while descriptions appear to benefit from some length (but not too long).
In most cases, DKI/ad customizers don’t dramatically improve or hurt performance. We should assume that all ads in a “+” category are using DKI or customizers as that’s the only way they’d be able to exceed the character count.
RSA and ETA performance trends do not line up perfectly, and those trying to apply ETA tactics to RSAs see declines in almost all metrics (potentially due to how Google combines lines of ad text to render long headlines).
CPC fluctuation implies that asset length isn’t as important as other factors, like the Quality Score and Ad Rank of the ads. If there was a clear correlation, one could infer Google’s character count preferences.
Takeaways:
The historical trend of longer ads being better isn’t playing out in today’s ad types. Quality over quantity seems to be the path to better CTR, conversion rates, and ROAS. Focus on including a strong and compelling message in your ad, rather than attempting to max out the character count.
Ad Optimizations That Boost Performance
Now that we’ve reviewed the data, let’s talk about the tactics you should adopt and the ones that no longer make sense.
For me, the biggest insight related to our findings about mixing sentence and title case: I didn’t expect the CTRs and conversion rates would be so similar. While sentence case ‘won’ for RSAs, performance was close. As such, only test sentence case in ads that are underperforming (as opposed to changing existing successful ads to sentence case).
Another big takeaway is that pinning should not be done for complete control. Instead, marketers should focus on securing creative in intended spots (i.e., not having a headline drop to the description). Leave some room for Google to decide where to place the creative.
Regarding Ad Strength as an indicator, seeing as how it does not correlate with performance, it doesn’t make sense to build Ad Strength into audits or sales tools. However, it is a useful filter to find ads whose creative may not be high enough quality to generate a meaningful number of impressions. We did see a strong correlation between shorter and brand-agnostic creative and higher ad strength.
Experts React
“A couple things stood out to me right away. The first is how little the CTR was impacted across the variety of ad types and strategies. Most of the changes studied saw no more than a 0.5-1% change across the CTR. Secondly, it appears that many marketers, myself included, haven’t completely adjusted to RSAs despite them being the primary ad type for over a year now. RSAs perform in a completely different way than ETAs regardless of how you format them. Rather than trying to replicate ETAs or using old best practices, advertisers need to lean into RSAs and determine how to make them work best for their accounts.
I think all of this highlights the case that many of us who have been practicing Google Ads for a long time need to revisit our habits. Google Ads continues to change at an accelerating pace and we need to lean into making it work for us now and not hold onto old tactics.”
Harrison Jack Hepp, Google Ads Consultant, Industrious Marketing
“As the “Chief Strategist” of a digital marketing agency, I’ve always prioritized strategies that maximize performance, often relying on data-driven decisions over Google’s recommendations. This study reinforces that approach, especially regarding Ad Strength and pinning. The data confirms that Ad Strength doesn’t reliably predict ad performance, so experienced advertisers should focus on crafting ads that resonate with their audience rather than chasing high Ad Strength ratings. While Google offers pinning as a tool, the findings suggest that allowing some flexibility for Google’s AI can yield better results than over-pinning and that using pinning selectively is not as harmful as I may have previously thought. However, the most surprising insight is the impact of creative length. Contrary to my belief in maximizing ad real estate (which I also push when it comes to Meta Data on the SEO side of things), the data suggests that concise, impactful messaging can outperform longer ads. This challenges the notion that more is always better and highlights the importance of quality over quantity in ad copy. Based on this study, I will push our teams to test creative length more rigorously.”
Danny Gavin, Chief Strategist and Founder, Optidge
“This study highlights the importance of humans using Google Ads. As experts, we analyze Google’s documentation, PR statements, and real-world advertiser performance to offer guidance.
While ‘Excellent’ ads have higher click-through rates (CTRs), this study confirms that ad strength can mislead advertisers into prioritizing clicks over conversions. ‘Average’ ads actually have higher return on ad spend (ROAS), suggesting that aligning ads closely with keywords (to get an ‘Excellent’) can lead to more clicks but not necessarily more sales.
I was also intrigued by the impact of pinning. Historically, I’ve avoided using pinning and relied on RSA automation. This data demonstrates that human intervention and knowledge can produce better results. In light of this, I’ll consider incorporating pinning into my strategies.
Lastly, as a proponent of title case, the study’s findings on title case versus sentence case were surprising. While many ad experts stick to one format, the study suggests that staying updated with case studies is crucial. In today’s environment, where individual accounts may lack sufficient volume for testing, tools like Optmyzr are more essential for providing data-driven insights and challenging the status quo.” -
Sarah Stemen, Owner and Coach, Sarah Stemen, LLC
“This is a good reminder of how dynamic best practices really are. Just a few years ago, filling up all the character space in an ad was a great way to give your ad more real estate. With RSAs, using every available character can actually backfire, since it can keep H3 from serving.
Writing Google Ads can be really overwhelming. Knowing what correlates with better performance and what doesn’t (ahem…Ad Strength) offers valuable benchmarks. These insights allow you to move past internal tests for things like capitalization and pinning, and instead focus on the qualitative aspect—developing stronger, more substantive messaging that attracts buyers.”
Amy Hebdon, Founder, Paid Search Magic
“This study is FASCINATING!
The things that stood out to me were pinning, sentence case and length of assets.
First, pinning - I am happy to see that pinning is not completely penalized. There are very legitimate reasons an advertiser might want or need to pin assets. Could be compliance or could be that their brand standard demand certain things must appear in advertising. I am glad that is not an automatic performance killer. It makes sense that selective pinning does well and full pinning does less well.
The title versus sentence case data was also really interesting! For those of us who have been doing this for a long time, title case is really ingrained in our heads for headlines. It almost feels blasphemous to use sentence case for headline assets. But the data, I think, is starting to show us that Google is viewing ad components/assets differently.
Which leads me to my thoughts on the length of assets. Again, those practitioners who have been doing Google Ads for 10+ years, our mantra has always been use all the characters! We strove to have long descriptions and use all those title characters pretty much every time. But the data is showing us that the system prefers shorter (not maxed out) assets. And I can’t help but wonder if this is hinting on Google Ads not distinguishing so much between title and description assets in the future. They have already started by sometime using titles in description areas. I think this is where it is eventually going.
All that to say, we probably need to adjust our thinking about today’s ad assets and test different lengths and case structures if you don’t have variety in your current ads. Look forward to more studies illuminating other aspects of Google Ads!”
Julie Friedman Bacchini, Founder of PPC Chat/President and Founder of Neptune Moon
“What I found most compelling from Optmyzr’s latest study is that ads resembling organic content outperform those that employ typical best practices for Responsive Search Ads. For example, Google’s own research from a few years ago found that Title Case outperforms Sentence case for RSA headlines and descriptions, but Optmyzr’s new study shows that the more “natural” Sentence case text is associated with better ROAS, CPA and CTR in 2024.
Similarly, practitioners have typically tried to maximize real estate by using all available characters, but this study shows that shorter headlines and descriptions generally have better CPA and CTR than longer ones.
I look forward to testing these new findings with my clients. As organic-feeling social media ads have taken over platforms like TikTok and Meta, it’s interesting to see a potentially similar shift coming to Google Ads.”
I’ve long said that focusing on ad strength too much is detrimental for performance and I’m glad to have this confirmed.
What’s really important is understanding the restrictions you have in your account (available impressions per ad group) and tailoring your RSA to that, plus the ability to communicate the message effectively and speak to the user in a way that resonates with them.
Best practices are but that - the average of things that typically work."
Boris Beceric, Founder and Coach, BorisBeceric.com
“Referring back to Fred’s advice, the single most important tip is to write ad copy that addresses your user’s or buyer’s concerns—it’s basic marketing 101. That said, the more you can customize each input, the better the performance will be. With increased AI search integration, expect Google to improve its ability to create a personalized search experience based on a multitude of signals.
Additionally, don’t forget the basics: dynamic countdown clocks for promotions, ad customizers that mention names of stores or service locations, dynamic keyword insertion (DKI), and using ad-level UTM parameters to trigger landing page content aligned with the keyword or ad theme will all contribute to better CTR and CVR.”
Andrea Cruz, Sr Director, Client Partner at Tiniuti
Final Takeaways
Ad Strength is not a major metric, nor has it proven to be a reliable predictor of ad copy performance. The most useful signals seem to be the formatting of the ad (title vs. sentence case), as well as length of the copy. Don’t fall into old creative habits—honor the new rules of engagement and, if you need help managing profitable ad tests, Optmyzr has a free trial with your name on it.
During GML 2024, Google shared a really interesting stat: raising your OptiScore 10 points leads to a 15% conversion rate improvement.
This stat raised eyebrows for a few reasons:
Advertisers can raise OptiScore by dismissing Google’s recommendations, which can be considered a loophole in the system.
Maintaining a minimum OptiScore is required for partner status, which doesn’t always align with business and marketing goals.
OptiScore tends to be conflated with account recommendations, which seem like a sales tool.
For your reference, here’s Google’s OptiScore support documentation:
Optimization score is an estimate of how well your Google Ads account is set to perform. Scores run from 0-100%, with 100% meaning that your account can perform at its full potential.
Along with the score, you’ll see a list of recommendations that can help you optimize each campaign. Each recommendation shows how much your optimization score will be impacted (in percentages) when you apply that recommendation.
Note: Optimization score is available at the Campaign, Account, and Manager Account levels. Optimization score is shown for active Search, Display, Video Action, App, Performance Max, Demand Gen, and Shopping campaigns only.”
— Google support documentation
With that in mind, we decided to explore the following questions:
Is there a performance difference in accounts with 70+ OptiScores (compared to sub-70)?
Are most advertisers achieving high OptiScores by accepting Google’s recommendations (and do they see better results than advertisers who reject them)?
Does spend play a role in OptiScore?
For this study, we looked at 17,380 Google Ads accounts that met the following criteria:
Running at least 90 days
Spending at least $500 per month
Maximum spend $1M per month
Global accounts that could be in ecommerce or lead gen.
The Data
We’ll review each major question in detail, but here’s a quick summary of the findings:
32% of accounts have sub-70 OptiScores.
19% of accounts achieved an Optiscore of 90+ without accepting Google recommendations.
5.5% (less than 1000 accounts) accepted Google recommendations, however the best performance belongs to the 333 accounts that accepted Google suggestions and have a 90-100 OptiScore.
Spend doesn’t really impact OptiScore—there’s too much fluctuation in the spends to point to any correlation or causation.
There is a correlation between higher OptiScores (80+) and improved CPA, conversion rate (though sub-70 did ‘win’ this category), and ROAS. There is no correlation between CPC and CTR.
Q1: Is there any performance difference between accounts with high/low OptiScores?
A big reason we wanted to explore the difference in OptiScore brackets is to see if it can be used as a health indicator in accounts. Here is the raw data:
As you can see, there is a clear correlation between high OptiScores and strong performance on all metrics (save for CTR). However, there are a few caveats:
Sub-70 OptiScore accounts won on conversion rate and nearly won on CTR.
ROAS is pretty flat between OptiScores of 70–90.
CPCs fluctuate (although lower OptiScores do correlate with higher CPCs).
Accounts in the 90-100 OptiScore range:
Beat accounts with a sub-70 score on ROAS by 186%.
Had the cheapest overall CPAs (despite not having the cheapest CPCs or best conversion rates).
Had the lowest CTR, which speaks to the value of PMax and visual content being part of the marketing mix.
Regarding Google’s claim on conversion rates being tied to OptiScore improvements:
This holds true for those going from 70 to a higher tier.
This does not hold true for advertisers going from sub-70 to 70+.
CPA and ROAS still win the day as you increase your OptiScore.
Q2: Are most advertisers achieving high OptiScores by accepting Google’s recommendations?
There’s strong skepticism around Google’s OptiScore metric. While our data shows there is a strong performance gain when an account achieves a better OptiScore, there remains the question of how the score is achieved. So ahead of this study, we ran an anecdotal poll and found that the majority of advertisers reject recommendations to raise their score (or outright ignore the metric).
Here’s the raw data:
While the vast majority of accounts (95%) do not accept Google suggestions, it’s worth acknowledging that the accounts with the best performance did accept Google recommendations and have an OptiScore of 90+. The data suggests that advertisers may have raised their scores by rejecting suggestions, however that didn’t always lead to the best results.
A few notes:
The suggestions varied across accounts, however the most common accepted suggestions revolved around hygiene fixes (e.g., conflicting negatives, missing assets, other clean up alerts).
Accounts that rejected suggestions may have still done the suggested action, but at a different time.
The main takeaway here is that you shouldn’t dismiss Google suggestions out of hand. An additional takeaway is that advertisers who are active in their accounts tend to see higher OptiScores, which does seem to correlate with improved performance.
Q3: Does ad spend play a role In OptiScore?
There has been a bit of skepticism around Google and how much spend plays a role in ‘favorable treatment’. While this wasn’t directly asked by the community, we thought it would be interesting to see whether spend impacts OptiScore. Here’s the raw data:
Spend is flat between the OptiScore brackets, and there’s no obvious correlation between spend levels and OptiScore.
While one could argue that jumping from sub-70 to 70–80 does add cost, the cost fades away in the upper brackets. This bracket had the best CTR, so it’s possible the increased spend is tied to advertisers doing a great job writing compelling ads that couldn’t capture conversions (either due to user experience or privacy).
Strategies for Leveraging OptiScore
Now that we’ve explored the data…what do we do with it? Should OptiScore be the new quality score?
No, but we also shouldn’t dismiss it. While Optiscore will not impact how you enter the auction, the data is undeniable that it can serve as a useful health indicator of where to work in accounts. While sub-70 accounts can see success, the strongest performance is in the 90+ bracket.
Don’t make it a goal to raise your OptiScore, which can be done through rejecting suggestions. Instead, focus on improving your account (with guidance from OptiScore). As Ginny Marvin, Google’s ads liaison shared:
The recommendations that surface with OptiScore refresh in real time and are based on your performance history and both inferred and expressed campaign goals (e.g., your bid strategy) as well as broader trends and market data. I tend to see two misperceptions about OptiDcore that keep advertisers from utilizing it effectively.
The first misperception is that OptiScore has a direct impact on performance. As with other diagnostic tools in Google Ads, such as Ad Strength and Quality score, OptiScore has no influence on the auction. On the other end of the spectrum is the second misperception that it’s simply a vanity metric that doesn’t reflect meaningful insights. OptiScore reflects how well your account and active campaigns are set up to perform.
While not all recommendations may be relevant (you know your business best), we continue to see that, on average, higher OptiScores correlate to better advertiser outcomes. Understanding what your OptiScore reflects, and reviewing the recommendations with an eye toward your goals, can help you surface new opportunities and prioritize where to focus your optimization efforts.
If you’re an Optmyzr customer, you can find OptiScore highlighted in Audits. Now that we know there is a positive correlation between OptiScore and account performance, we will begin looking at expanding its utility in Optmyzr’s suite of tools.
If you’re not an Optmyzr customer, the best way to leverage OptiScore is to use it as a focusing tool, as well as a weighting system to prioritize which optimizations/tests to perform.
Thoughts From PPC Experts
We asked PPC experts to weigh in on the data with their honest takes. The responses were mixed.
Pleasantly Surprised
I was pleasantly surprised to see a correlation between higher OptiScore and better campaign results (lower CPA/higher ROAS). I was more surprised to see even better results for those that accept rather than dismiss Google’s recommendations.
None of us, not even Google, would conclude that higher OptiScore is the cause of better results - though we all owe Googlers an apology for how much we’ve mocked their OptiScore stats over the years! I think the true cause for both higher scores and better results is a) actively managing and ’looking after’ an account, and b) being open to considering new ideas and opportunities.
Most experts are quite critical of Google’s recommendations, especially when it comes to OptiScore (myself included). However, I am also willing to eat my words when proven wrong. I was quite surprised by the clear correlation between OptiScore & ROAS, CPA & CVR (and yes, I did my own analysis).
I’ve always maintained that not all recommendations are useless and that you should judge them by their usefulness for your accounts. I guess now it’s time to go back to my accounts and see what else can be implemented.
The results were very interesting to me, as a member of camp ‘reject most suggestions.’ I imagine that the level of expertise of the account manager plays a role, sometimes what Google suggests is an action I was already going to take. I’d recommend that nobody blindly dismisses or accepts recommendations and instead considers them carefully, as you are the only one with context. I also believe ecommerce clients should pay particular attention to the ROAS results of this study!
Google isn’t inside the accounts but I know I’ll be more carefully considering their suggestions going forward and I believe the season of ‘blindly dismiss’ (if that’s been your MO) being the default has come to an end.
— Amalia Fowler, Owner, Good AF Consulting
I worked at Google on the Google Optimization project and have seen firsthand how some recommendations from the system can be highly relevant. For instance, addressing conflicting keywords, fixing conversion tracking issues, and implementing enhanced conversions are all critical for improving campaign performance. Additionally, adjusting ROAS targets or increasing target CPA during peak auction times can also bring better results.
This data reassures me that recommendations correlate positively with performance. However, I still believe that certain areas, such as adding new keywords or changing match types to broad match, require further improvement. Overall, the study’s outcomes are pleasantly surprising and validate the use of some of Google’s optimization suggestions.
— Thomas Eccel, Senior Performance Marketing Manager, Jung von Matt Impact
Skeptical or Indifferent
The Optmyzr study highlights benefits to Google’s OptiScore and suggestions, (which is seen especially in the 90–100 range), with a better CPA and ROAS compared to the lower OptiScore brackets.
This study supports what I tend to believe and it is great to have the data to prove that some recommendations directly found in the Google Ads interface are beneficial to account performance.
All that said, the Google interface and Google reps independent of the study push the score. Google pushing the score gives me pause, even when independent study data supports that OptiScore’s net positive on performance.
— Sarah Stemen, Business Owner, Sarah Stemen, LLC
While I don’t pay much attention to OptiScore or give much value to recommendations, we do review recommendations on an ongoing basis because they can surface some things we may not have seen as easily.
— Menachem Ani, Founder, JXT Group
I usually reject most of the recommendations and ignore OptiScore, unless we are about to lose our Google Partner Badge. After checking all of our accounts, I would like to add that nowadays the recommendations have increased in number and in variety than several years ago. Search is much more visual, and for instance, accepting the recommendation to add more images or enable dynamic images is rather beneficial with less risk for harm. Improving ads and assets, in general, makes sense too.
Our smallest accounts suffer most in terms of OptiScore because the system does not like limited budgets—for some of them, a budget increase might improve the score by 13%. For lead gen and gambling accounts (which underlie strict regulations), PMax would bring a score improvement of over 10%, which again does not make sense business-wise. Switching accounts optimizing on CAC to Target-ROAS for the sake of several OptiScore points already goes in the direction of business suicide.
— Georgi Zayakov, Senior Consultant Digital Advertising, Hutter Consult AG
Summary & Final Takeaways
OptiScore is not and should never be a KPI. It is a useful tool to focus work, though it should not be the only tool you use. Make sure you balance all recommendations from Google with the actions and optimizations that best serve your campaigns and business.
If you would like to have a third party to sanity check recommendations and strategies, check out Optmzyr’s PPC Management suite for Google and beyond.
At the height of the Roman Empire, pepper was so highly prized that spice traders’ wealth grew faster than they could spend it. And nowhere was it more available and expensive than in Italia province where Rome stood – and where the average income was higher than that of the entire empire.
In a way, Roman traders were the progenitors of value-based bidding by putting their most profitable merchandise in front of those likeliest to pay the most for it.
Today, it’s a Google Ads’ methodology to help advertisers maximize the conversion value of their ad spend, and one of several cards you can play to unlevel a playing field where every advertiser is using the same automation.
But things have changed a little bit since the Romans were in charge, and there’s more to value-based bidding than starting a price war over spices.
In 2021, around 80% of Alphabet’s $257 billion in revenue came from Google’s advertising channels including search, shopping, and YouTube – that’s a huge ecosystem of people searching for products and information.
With it, Google has acquired a staggeringly large data set rich with consumer intent to inform its decisions. This is paired with world-class AI and machine learning that helps advertisers make the right decisions for their clients and businesses.
But that data is incomplete; it doesn’t account for account-specific information like who bought from you via a Google advertisement but later returned their purchase, or how one customer from geo 1 may have 10x the value of a customer from geo 2.
Value-based bidding closes that information gap by telling Google what your business considers to be the most and least valuable sources of traffic.
On our video podcast, PPC Town Hall, Google explained to us everything about Value-Based Bidding: how it works, best practices to follow, and common pitfalls to avoid.
Get actionable PPC tips, strategies, and tactics from industry experts twice a month.
Bidding to value happens when you tell Google things that Smart Bidding can’t measure, such as:
How much a customer is worth to your business, revenue stream, and profitability
Which conversions turned out to be money in the bank and which ones didn’t
The steps a lead took online or offline after converting via Google that resulted in revenue, and how much you value each of these conversion action steps
This graph is a hypothetical example of how value-based bidding helps you maximize your conversion value; it’s not how value-based bidding works in all cases. It’s possible to generate a higher volume of lower conversion value customers as well. The goal is to maximize conversion value, not the number of conversions.
Traditional conversion-based bidding methods don’t account for this level of nuance. With value-based strategies, you spend more of your budget acquiring customers most likely to create profit for your business.
In short:
Differentiate your customers. It’s likely you already segment customers based on their value to your business, but Google doesn’t have this information.
Bid on what matters. With a value-based bid strategy, Google learns which potential customers are most valuable to you.
Drive increased performance. Bidding higher on more valuable customers delivers incremental revenue lift and profitability.
Remember that different Google channels have different prerequisites and settings to enable value-based bidding. With Smart Shopping migrated to Performance Max, the only option is bidding to value. Search and Standard Shopping give you a choice between conversion-based or value-based strategies.
There are two broad ways to share data with Google.
Online Conversions
Global Site Tag and Google Tag Manager help you pass back online data points with additional tag parameters at the time of conversion, to help Google understand a conversion’s value.
Conversion data makes or breaks your success with value-based bidding. Be sure to set up and track more accurate conversions that match your business goals.
Some advertisers still use pageviews and other low-touch actions as conversions. We suggest something more indicative of interest, such as a form submission or purchase.
Offline Conversions
Offline Conversion Imports let you directly import conversions that took place offline, which you can pass back to Google via tools like Zapier, direct CRM integrations with Salesforce and HubSpot, or by uploading formatted spreadsheets. Anyone who clicks on your ad gets assigned a Google Click ID (GCLID). Use this anonymous identifier to report back on their conversion path while keeping customer data private.
For an advertiser who sells cosmetic products using an omnichannel strategy, using Offline Conversion Imports can tell Google data associated with different GCLIDs. For example:
True transaction value after a customer makes a full or partial return
Different values for first-time vs. repeat customers
The purchase value of a transaction in-store, with or without clicking on a digital ad
Offline Conversion Imports applies data up to 90 days old to the bidding algorithm (anything outside is used for reporting purposes only). You can either share the information daily and use conversion adjustments later on (Google-recommended best practice), or delay uploading conversions until you know more as long as it meets this threshold.
You can also use the Offline Conversions API in Google Marketing Platform to upload offline actions into Campaign Manager, Search Ads 360, and Display & Video 360 keyed to a DoubleClick User ID, GCLID, Device ID, or Match ID to view offline conversions.
We’ve talked about the importance of using conversion values, but how do you decide what numbers to use? Consider these elements the next time you set them up for an account.
Estimated Value: This is your most educated guess as to how much money a conversion has or will generate. Depending on your needs, you could consider immediate top-line (revenue), bottom-line (profit and margin), forecasted profit, or customer lifetime value.
Implementation: With conversion tracking enabled, different conversions can have different values. You can also choose to assign the same value to all conversions if your business model demands it. Three ways to assign values include:
Ecommerce Transaction Value: For online stores with shopping carts, your conversion values can vary based on the item. One conversion could be worth $25, while another could be worth many multiples.
Profit Margin: If your average order value (AOV) is $3,000 with a 45% profit margin, and your CRM shows that 20% of leads become customers, your conversion value would be (3,000 x .45 x .20) $270.
Lifetime Value: For the same AOV but using LTV modeling, you find that customers spend an additional $5,000 on average over their lifetime. At the same profit margin, your profit per customer is $3,600 ($3,000 + $5,000)*(.45). With a 20% conversion rate, your conversion value is $720.
Frequency: Pass value data back to Google as quickly and consistently as possible, ideally daily. This allows your account to get as close as possible to real-time optimization – especially necessary for ecommerce and verticals where inventory is limited.
Remember not to get caught up with exact figures – it’s fine to use estimates. Ensuring the values closely represent your business objectives is the most important part of this strategy.
Conversion Value Rules is a Google Ads feature that lets you tell their system more about how you value traffic based on three conditions:
Location
Audience (including first-party and Google Audience lists)
Device
Value Rules are applied at the account or cross-account level on top of your base conversion value. This makes it critical that you work with your clients or other teams to understand the hierarchy of audiences, locations, and devices for your business.
Software businesses that generate leads can use Value Rules to share business insights with Google such as:
Users in the United States are 3x more valuable (LTV or transaction value) than the average conversion (location)
Users who signed up for their newsletter are 20% more valuable (audience)
Users who browse on a desktop are 50% less valuable (device)
You should only create Conversion Value Rules that can’t be observed by or shared with Google through other means. For example, the profit margin isn’t known to Google; customer LTV per lead can only be inferred from your CRM database.
If you already share ecommerce transaction value through Google Shopping, for example, then Google already knows the differential in transaction value for consumers in geos and will take this into account within the Smart Bidding algorithm. So no Conversion Value Rules are needed in this case.
Outside of Value Rules, you can also use these other techniques to adjust conversion values:
Conversion adjustments to retract and restate previously reported conversions reported online or through Offline Conversion Import.
Data exclusions tell Smart Bidding to ignore all data from a particular date range when conversion tracking data was inactive or broken. This tool does not adjust for fluctuations in conversions.
Pre-import adjustments allow you to modify the value based on a variety of factors that you control. This will help guide Smart Bidding to achieve your value objectives.
Maximize Conversion Value (with or without a target ROAS) is the definitive Smart Bidding strategy for businesses with varied products or customers with different values.
Maximize Conversions isn’t recommended unless you only sell a single product variant, or have no information to differentiate the value of one type of lead vs. another. When using this bid strategy, Google will optimize for conversion number and will not consider differences in conversion values.
The addition of a target ROAS simply tells Smart Bidding to maximize your conversion value within a certain spend threshold. But remember that too high a target can limit conversions, and too low a target can eat into profits. Be sure to experiment with your ROAS target to find the sweet spot.
The Impact Of Value-Based Bidding On PPC Performance
The numbers speak for themselves – Google’s internal data from 2021 shows clear gains from bidding to value using Maximize Conversion Value with a target ROAS. Search campaigns enjoy a 14% lift in conversion value at a similar ROAS, while Standard Shopping campaigns with tROAS can see a lift upwards of 30%.
Aside from the tangibles, value-based bidding offers operational and strategic advantages for any agency or brand.
Closer Alignment With Google
Bidding to value – and setting up the systems that make it possible – allows Google to focus on the quality and total conversion value of people who see your ads. This allows you to optimize campaigns to match your true business goals, better reflect your business’ observable data, and optimize to what matters – like revenue, profit, or customer lifetime value.
Better Post-Conversion Optimization
With better traffic comes a more manageable post-conversion process. If your business engages with customers extensively between online conversion and sale, you can optimize for customer LTVs rather than lead volume. What’s most important is that you report conversions (with values) back to Google to better align bidding with business outcomes and marketing objectives.
Showcase Strategic Value
It’s easier to make a case for how your agency or team adds value to the marketing landscape with value-based bidding. This will become increasingly important as Google automates more of its platform and uses Smart Bidding to help advertising capture the most business value with your Google campaigns.
Simply optimizing keywords and optimizing manual campaigns is no longer a viable role. With real-time optimization, you can account for nuances in value when using target ROAS and Maximize Conversion Value.
You can help to translate the performance of Google Marketing campaigns to be directly aligned with ultimate business goals for your client and bring first-party data in to assert your competitive advantage.
Implementing Your Value-Based Bid Strategy: A Checklist
Watch Taylor Mathauer and Will Gray from WebMechanix share how they used Value-Based Bidding to generate higher-quality leads for their client.
You will learn: - Why they decided to use value-based bidding - Success with value-based bidding - The state of smart bidding and limitations with value-based bidding - Where they’ve seen value-based bidding not work - Requirements for using value-based bidding - When is value-based bidding appropriate - How to track success with value-based bidding
Most advertisers have now made the transition from manual to automated bidding, but that’s not where the road to PPC optimization should end. There are many forms of automated bidding, some more powerful than others.
Value-based bidding is the current state-of-the-art in bid management for Google Ads, but it relies on advertisers assigning a value to conversions so Google’s algorithms can prioritize more lucrative conversions.
Bidding to value works for a wide variety of advertising goals, but because it uses a target ROAS, it’s sometimes incorrectly assumed that it’s only for ecommerce.
Even lead-gen advertisers can use value-based bidding because they also get different values from different types of leads. The trick is simply in how to communicate these different values to the automated bidding systems.
This next part is the guide that will help you be successful as you transition your campaigns to a value-based optimization methodology. Like the rest of this article, it was put together in collaboration with Google, the company that created many of the systems advertisers use to implement value-based bidding.
Optmyzr took the theory behind these tools, analyzed what real advertisers did, and distilled it down into this guide. Read on to get the best advice from both the creators of the tools and the advertisers who use those tools to deliver winning outcomes.
We’ve split this up into the four key parts of doing value-based bidding the right way. They’re all equally important, but we’ve listed them here in the order that most closely follows the implementation timeline. So start from the top and work your way down as you deploy a value-based bidding strategy for your account.
Value-Based Bidding Best Practices You Should Follow
Conversion Tracking and Assigning Value
For any optimization strategy to work well (manual or automated), advertisers must collect the right data to help make smart decisions.
Google takes care of reporting accurate data about impressions, clicks, costs, etc. But it’s up to advertisers to ensure they get accurate data about results-driven by these clicks. This means setting up conversion tracking correctly.
Most accounts already have conversion tracking set up. In lead gen, a conversion might be when someone fills out the lead-gen form on a landing page. In ecommerce, it might be when the consumer checks out and pays for their cart.
Here are some considerations related to conversion tracking:
Create multiple conversion actions to reflect the multiple stages of a conversion. This can include micro-conversions (good things that happen before the conversion) or additional macro-conversions (good things that happen after the initial conversion) e.g. when a lead becomes a sales qualified lead, and when a lead turns into a customer. In ecommerce, additional conversions could happen when a new customer exhibits signals they will become a high-LTV customer.
Create reasonable values for the different conversion actions. Not every action should carry the same weight. For example, a sales-qualified lead is probably worth more than a lead, and a sale is worth more than a sales-qualified lead. In ecommerce, a user who returns half their purchase should be valued lower than if they’d kept all their items.
When using relative rather than exact values for different conversions, ensure these values are at a similar scale as the cost of clicks. For example, if an average click costs $10, don’t report that a lead is worth ‘1’ and a sale is worth ‘2’, because then every click will look like it was a money-loser and automated bidding will scale back your ads. Instead, scale up the relative values, for example, value a lead at 100 and a sale at 200. That way, when 8 clicks lead to 1 lead, the ROAS will look much healthier and your ads won’t be throttled.
Consider which conversion actions should be used for bidding optimization and whether you may be stacking the values too high. For example, if you have 3 conversion actions related to leads – a lead ($10), a sales qualified lead ($20), and a sale ($50) – and each is a primary action, then their values will get added. So a sale, which presumably started as a lead and then became a sales-qualified lead before turning into a sale will get a value of $10 + $20 + $50 = $80.
Make sure this makes sense as you consider the next section of guidelines about targets. If you haven’t heard of primary and secondary conversion actions, these are Google’s new way of asking advertisers what to count towards bidding optimization. It used to be a checkbox “include in conversions”, but now they call it primary conversion actions (which are used by automation) and secondary conversion actions which are merely used for observation and reporting, but won’t influence the behavior of automated bidding.
As an ecommerce advertiser, consider setting a conversion value based on a sale’s profitability rather than its revenue, to account for varying margins for different products. Aligning the values you report with the KPIs your business cares about can simplify a lot of things – for example, choosing the right target ROAS.
If some of your conversion value increases or decreases based on things that happen offline, use one of the offline conversion tracking tools described earlier in this article.
If you report conversions to Google after they happened, or you restate values later on, try to do this at least daily so the machine learning gets fresh data all the time.
When using Conversion Value Rules, only communicate to Google things that may not be observable through Smart Bidding e.g. profit margin, customer lifetime value, upsell opportunities, etc.
Use one of these key product features from Google to adjust values:
Structure and Targets
Account structure and targets go hand-in-hand because which targets you can set depends on how your account is structured. If you need to have different targets for different parts of your business, you should maintain at least one campaign for each.
While many advertisers may have heard Google’s call for a simpler account structure, bear in mind they’re asking advertisers to remove unnecessary complexity. So don’t maintain multiple campaigns for the sake of having the same keywords in different match types. But do maintain separate campaigns if you sell seasonal products that will have different targets as the seasons change.
Decide at what level your conversion actions make sense. You can set them cross-account, at the account level, or by campaign or groups of campaigns. When Google’s algorithm predicts conversion rates, it uses all data associated with a conversion action’s scope. This means you can have a single conversion action at the MCC level that guides all bid decisions across multiple accounts for the same company. Or if you have a campaign with a unique one-off goal where you don’t want other campaigns to impact its predictions, set it up with a campaign-level conversion action.
Maintaining a minimum conversion volume is becoming less important as Google’s machine learning improves and is able to draw inferences from system-wide data. That said, most advertisers we talk to find automation performs better with campaigns that have more conversions. Target at least 30-50 conversions per month before enabling automated bids. Before then, use Enhanced CPC bidding or Maximize Conversion Value (with no tROAS) to build up data. And consider adding micro-conversions if you find yourself struggling to meet the conversion threshold when relying solely on your primary conversion action.
When testing value-based bidding with Google’s Experiments framework, you need double the number of conversions. So building on the previous point, aim for 30-50 conversions per month for both the control and experiment groups. Otherwise, you may need to expand your testing period beyond 1-2 months to reach conclusive results.
If you followed the advice from the previous section and are reporting profits rather than revenue, you can now set targets based on true goals. Before reporting profits in conversion tracking, some advertisers use the tROAS to emulate profits. For example, in a campaign where the typical product has a 50% margin (the cost of the goods sold is half the price charged for the item), an advertiser can set a 200% tROAS knowing that if they hit that ROAS exactly, they will break even. Instead, when they report profits, they can now set a tROAS of 100% to achieve the same thing and avoid confusion about why they have a 200% tROAS when they would have been happy with 100%.
Set the initial target ROAS based on historical performance. The simple math is conversion value (such as revenue) divided by ad cost, for at least the past 30 days. Setting it too aggressively may severely limit volume.
Use profitability as a guide for setting the right budgets & ROAS targets with Performance Planner.
When you expect a sudden fluctuation in user behavior that will impact conversions, consider setting a seasonality adjustment or modifying the tROAS. The benefit of a seasonality adjustment is that you can set an end date and machine learning will ignore data from the seasonality event for its future predictions.
Testing and Hygiene
With conversion tracking reporting the right thing and targets set to achieve actual business goals, advertisers are ready to start experimenting with value-based bidding. But just like with any test, here are a few considerations to keep in mind:
Build up enough conversion history before starting a test. At least 3 conversion cycles or 4 weeks is recommended, whichever is longer. That means that if your typical conversion takes 15 days, you should wait 45 days before turning on your target ROAS. Use the Path Metrics report in the Attribution section in Google Ads to learn what your typical conversion delay is.
If you have a tROAS, uncap your budgets so that the system can find incremental conversions within your target. If you do not have a tROAS, use Maximum Conversion Value as the bid strategy and keep your budget cap in line with your expected daily spend goals.
Google recommends not changing targets more than 20% or more frequently than every 2 weeks. These are guidelines and it’s okay if you don’t follow them. Your business objectives should take priority. Keep in mind that a big change in your target can bump Smart Bidding into its learning phase, but that does not mean Google’s machine learning forgot everything from the past. It simply means that a large swing in your target is making your ads eligible for a significantly different set of queries for which Google may not know much about your expected performance. For the same queries you’ve had before, it’ll be business as usual. For the new queries, performance may fluctuate and that may make your averages look a little strange for a while, but you didn’t break machine learning.
A best practice of gathering conversion value at observation mode first (without setting bids) for Offline Conversion Imports is 2-4 weeks.
If something goes wrong and conversion data is broken – for example, if your website goes down – use a data exclusion to let machine learning know that it should ignore data from that period for making future predictions.
As with any test, minimize big changes. For example, changing the landing page or your offer could dramatically impact conversion rates and Google’s algorithms won’t necessarily know if the change was due to this or something within its own control like bids or broad matches. If you have to make changes to your campaigns during the test period, make the same change to both the control and experimental groups.
Keep in mind when switching to value-based bidding:
Evaluating Performance
Finally, with tests underway, it’s important to understand how to evaluate performance the right way so you avoid making incorrect decisions.
Machine learning needs a bit of time to learn; it’s called machine learning after all! So give it 1-2 weeks to get through the ramp-up period and then ONLY consider data from that point forward when deciding what’s the winner and what’s the loser. Optmyzr’s [Campaign Experiments](Campaign Experiments by Optmyzr: Google Ads Experiments Made Easy) tool will help you see all experiments in one place and accounts for the ramp-up period.
Experiments shouldn’t be terminated too soon; 4-8 weeks is generally the right amount of time to let an experiment accrue enough data that isn’t biased by time factors. Of course, the exact amount of time depends on the volume of the campaigns so be sure to look for statistically significant results.
When automating value-based bids, your metrics for deciding winners and losers should focus on revenue maximization or conversion value maximization, so don’t pick a winner based on an unrelated metric like CTR for example.
Keep in mind that most campaigns have conversion lag. So when analyzing performance, ignore the most recent days where conversion reporting is likely still incomplete. You can use Google’s attribution reports to find the typical conversion lag for each of your campaigns.
Google’s Bid Strategy Report already does a lot of the performance analysis for you. Use tools like Optmyzr to delve deeper into the numbers and produce additional reports your clients or boss might be asking for.
Common Pitfalls (As Identified by Technical Specialists)
Besides using the above best practices for starting with value-based bidding in your account, beware of some of the most common pitfalls we’ve seen.
1. Your ROAS goal should not be too aggressive
It would be nice if automation was a magic bullet that could instantly quadruple your performance, but chances are this won’t work. It’s better to start with the recommended tROAS based on historical performance so that the system gets a good baseline. From there, you can slowly change the tROAS and periodically review if these small tweaks are getting you closer to where you’d like to be. The Optmyzr Rule Engine is a great tool that can automate these periodic small tweaks to your targets.
2. Don’t analyze performance during the learning period
We said it in the guidelines but we’ll say it again because too many advertisers can’t wait to see results so they jump the gun and make decisions too quickly. The system takes time to calibrate and settle in, so give it the required 1-2 weeks to do this before you start analyzing results.
3. Don’t forget about conversion delays
We said this one before too but it’s another all-too-common mistake to judge a campaign by the most recent performance we have access to. And while Google Ads will report clicks/cost/etc. in a matter of minutes for most campaigns, conversions take time because people take time to make up their minds. If you judge a campaign on this partial data, you’re bound to make bad decisions. Said another way, remember that Google Ads data is click-centric. If a click today leads to a conversion in 5 days, that conversion will show up in the report for today’s data after 5 days. The data you look at may not tell you the complete and final picture. So be sure to exclude performance during the conversion delay period.
4. Don’t look at the wrong metrics
For better or for worse, Google has really trained advertisers to care about click-through rate, conversion rate, and yes, even ROAS. But don’t lose sight of how those metrics relate to your business goals. We once talked to an advertiser who told their agency they had to get a 400% ROAS to keep the business. They dutifully met that target until one day they asked the client why they insisted on a ROAS that was actually decreasing profits. The client sheepishly admitted they got 300% ROAS from the last agency and thought 400% would be better.
5. Not assigning value to conversions that matter
The whole premise of value-based bidding is to help machine learning understand the true value of conversions to your business. So don’t skip assigning values to all your conversion actions. But also don’t get stuck on setting the exact right amount. It’s fine to estimate, measure and iterate.
6. Poor campaign structure
Old campaign structures can really hamper results. For example, you should not separate campaigns by keyword match type, or by device type. The former is almost always unnecessary, the latter likely is less necessary than it once was. Your account structure should be as simple as possible while still enabling you to set different goals based on your business needs.
What A Successful Value-Based Bid Strategy Looks Like
The transition from a conversion-based mindset to value-based bidding can be rewarding, but only when done right. That starts with understanding how Smart Bidding makes decisions in order to meet it halfway.
Advertisers around the world have made mistakes like jumping into Smart Bidding without taking prerequisite measures, evaluating performance too early when testing a new bid strategy, and not realizing that Smart Bidding already takes into account observable conversion data from all your campaigns.
Value-based bidding is the next level of account optimization after you’ve run the course with a conversion-based methodology. The guidelines we’ve covered in this article will help you see better results more quickly by avoiding some of the most common pitfalls we’ve seen advertisers fall for when deploying the tools from Google.
Be the advertiser who succeeds by having a plan, sets things up to succeed from the outset, understands the limitations of Google’s decision-making algorithms, and feeds updated and relevant data to align the algorithm with your business goals.
In March of 2024, Google fixed a glitch that blocked Search terms from showing in the PMax scripts that would pull search categories. This means that you can see the categories PMax matched your budget with, as well as the specific Search terms.
Just like in traditional search campaigns, understanding what your users are searching for helps you bid more effectively, and know which negatives to add to eliminate waste. However, this still requires a script—meaning that you need to have knowledge of applying scripts, or your own API tokens, or use a tool like Optmyzr.
Optmyzr customers have access to our PMax search terms report and a number of other tools. But, in this article, we’re going to focus primarily on solutions for advertisers who don’t have access to Optmyzr’s solutions for PMax because it’s important to us that everyone has access to budget-saving resources.
Before we dive into analysis and optimization we need to know what we’re working with. So, let’s quickly define a few important terms.
What Are Search Categories, Search Terms, Search Keywords, & Search Themes?
A search category is specific to PMax. It groups similar search terms giving you an eagle-eye insight into what is going on in your account. It’ll also give you a sense of the main themes for searches.
It’s important to note that the categories do not spill over into placements, so you shouldn’t take the categories you get for search as an indication of your placements. Understanding the places you’re serving for requires different tools.
A search term is the actual thing—a word or a group of words—a user searches for. Typically, you will see something related to the keyword (which we’ll go over in a bit in the search term) but sometimes due to the nature of close variants, the words in the search term will actually be completely different. This can happen due to broad match or the way that PMax matches.
Part of the reason that search terms are so important to audit is that you can sometimes get cheaper ways of searching off of those search terms. You also can get insights into potential ideas for negatives.
A search keyword is the thing that you bid on in traditional search campaigns. It has different match types and uses different signals to match user queries. In PMax you don’t actually bid on keywords. Instead, you use something called search themes.
Search themes, behave sort of like broad keywords. However, they have interesting ranking rules. If you have a keyword in your traditional search campaigns that is an exact match, there’s a very high likelihood that that keyword will win for other match types.
It’s much more likely that the search theme will win out, especially if the user semantically searches exactly the way that the PMax search theme is written. Understanding the difference between keywords and themes will help create the best strategies for your account going forward.
What Can You Do With The Data From The PMax Reports?
Now that we have a basic understanding of all the pieces in play, we can dive into what to do with the data available through our PMax search term and search category reports.
You start with an audit of your PMax search themes, confirming that you’ve got the right ones in place. If you see a lot of search terms that are the same as your search themes and keywords in your traditional search campaigns, you may want to switch out your search themes. This is because you are setting yourself up to cannibalize your search budget with your PMax campaign.
A better way to go about it is to pick exact match keyword concepts that you want for your traditional search and test new potential candidates in PMax. In this way, you can get that incremental traffic by testing new ideas without having the repercussions of limiting your search campaigns that may need more data to ramp up.
The other really important point is around negative keywords. PMax doesn’t behave like a traditional campaign. It requires you to send a list of “normal” negatives through a form to Google support reps, and brand terms that you want as negatives.
This can apply to both your brand and your competitors.
While you can only eliminate waste, you can’t necessarily direct traffic. This is an important mechanic because many will treat asset groups like ad groups and the lack of ability to have asset group level negatives means you can’t do this without hurting your account.
You will likely have asset groups that don’t perform and may have parts of your business that don’t get access to budgets.
Finally, having a sense of how much of your budget is going to search in general is useful. If you see that the auction prices in your PMax campaign are drastically cheaper than your traditional search, especially for search categories that are important to you, that could be a sign that your PMax campaign isn’t budgeting enough for what you’re going after, and the lion’s share of your budget is being soaked up by visual content.
Visual content isn’t inherently bad, but it can create false positives in terms of how much keyword concepts cost.
How to Audit Your PMax Search Terms?
We talked quite a bit about the analysis. Here are the main action items that you’ll want to do in relation to PMax and auditing your search themes, categories, and terms.
Make sure that there is minimal overlap between the search themes and your traditional search keywords. If you have a lot of overlap, consider swapping out your search themes.
Don’t forget negatives! Also, remember asset groups do not allow for negatives. You have to make the choice at the campaign level through the form or at the account level and just eliminate waste.
Remember that different channels have different auction prices. If you’re seeing a high level of spend that’s cheaper than your traditional search, consider reworking your structure so that PMax either can get a little bit more budget, or be mindful that you probably don’t have the budget for PMax to hit the minimum 60 conversions in a 30-day period and Google is doing the best it can with the limited resources.
As a reminder, Optmyzr customers have access to the PMax Search term script and can use our other suite of tools including Rule Engine, Campaign Automator, and many other resources to build out account structures that serve them best.
If you’re not an Optmyzr customer, our co-founder Fred Valleays released a free version of the script which you can test out in your own accounts. And if you’d like to explore becoming a customer, you can click this link for a free full-functionality 14-day trial.
Thousands of advertisers — from small agencies to big brands — worldwide use Optmyzr to manage over $5 billion in ad spend every year.
You will also get the resources you need to get started and more. Our team will also be on hand to answer questions and provide any support we can.
You know an idea has jumped the shark when you walk into a coffee shop, and the first thing you hear is a customer leaning over the espresso machine, asking the barista if he’s ever used ChatGPT.
That is exactly what happened this week—even the wildest LLM couldn’t make this stuff up—right as I stepped into this shop to pen an article on AI and agencies for Optmyzr.
For a long time, what Google liked to call AI was actually just fairly crude machine learning. Nobody was impressed with ML, to be honest, and even a few years ago the concept of this technology replacing agencies was too far-fetched for any rational marketer to even consider.
Then we hit an inflection point, the future became the present cluttered with Groks and Midjourneys and Claudes, and this possibility doesn’t seem too crazy anymore. Because it’s already happening.
AI Is Replacing Tasks
First AI came for the entry-level beginning marketers. Next, it’s coming for the agency owners.
It’s easy to ignore what has happened over the past year or two, since most experienced freelancers, consultants, and agency owners don’t do the sort of daily grunt work that entry-level marketers do.
I’m so far distanced from the sort of work I did right out of college that it’s incredibly easy to forget how mind-numbingly grueling that work can be.
For better or worse, a lot of that work has already been replaced. For the paid search and paid social world, I’m talking about cleaning up data dumps, editing banner images in Photoshop, writing headlines and descriptions for responsive search ads, keyword research, topic brainstorming, and even some fairly complex data analysis.
As it turns out, a single-click generative fill in Photoshop replaces 15 minutes of tedious clicking. Using Code Interpreter to analyze a CSV does things I didn’t even know were possible in Excel. And using Grok in “Fun Mode” gives ideas for ad copy that even the most experienced copywriter might miss.
All that to say, it’s tasks like these that are being delegated away to the machines. We can feel sorry for the budding digital marketers out there, but the reality is that those jobs are being decimated.
A Business Model Dependent Upon Service Delivery Is Fragile
Many agencies revolve around delivering tasks.
They set up Google Ads campaigns.
They send a performance report at the end of the month.
They fulfill their contract to post social updates five times a week.
They click around in Merchant Center and make sure the feed is optimized.
While this model works for a while, at some point Google Ads introduces Merchant Center Next and years of best practices go out the window, tools use LLMs to write better ad copy than most humans, ad platforms develop native integrations with even more tools, reporting is automated, and these agencies are left out to dry.
So what is going to differentiate a thriving agency from a floundering agency?
Everyone always says “ideas and strategy” but that’s sort of a cop-out. Here’s the real answer:
Economics and Finance: Agencies with a strong understanding of the client’s P&L, margins, business goals, and market position will be able to allocate budget and direct the campaigns more efficiently than any AI can yet do.
Branding and Awareness: Digital marketers are often allergic to the idea of spending resources on branding, since we’ve been so spoiled with attribution over the years. But a brand voice won’t ever be able to be truly captured by AI: a human with taste still has to shepherd this.
Deep Anecdotal Experience: Digital marketers are even more allergic to the idea of gut feelings, because we tend to view things in terms of data dumps. But for those of us who’ve run thousands of campaigns spending millions of dollars over the years, eventually we just have gut feelings about strategies or tactics that will almost certainly save the client both time and money.
Sales: The reality is that as you go upmarket, it’s less about tactics and more about relationships. Good luck hopping on a plane and grabbing drinks with Gemini.
Strategy and Data Analysis Must Be Folded In
There are some agencies out there which split out strategy, or data analysis, or conversion tracking, or creative production as separate line items.
My personal belief is that this is short-sighted. It’s sacrificing long-term value for a quick buck now.
Because as AI develops—more rapidly than many of us want to admit—we’re quickly realizing that the emperor has no clothes, and many agencies aren’t really offering that much value in comparison to the prices they charge.
At our agency, we fold in everything.
There isn’t a single thing we charge extra for, because we consider that our expertise comes as a package, whether that’s market research, product pricing analysis, competitor research, reporting, data visualization, strategy, meetings, or just the standard old campaign management.
It’s all part of the same deal. After all, we only win when the client wins, so isn’t it in our best interest to do everything within our power to increase their ROI?
Good agencies will embrace their role as close-to-the-money sales advisors. They’ll embrace their role as ad brokers and sales guys. They’ll embrace their role as a consultant, strategist, tastemaker, and research analyst, offering as much as humanly possible to improve campaign performance.
Bad agencies will continue in a rut of service delivery, nickel-and-diming clients, upselling more deliverables, thinking in terms of hourly billables and gatekeeping information, reporting only in numbers and not in holistic long-term results.
xGood agencies will use AI to streamline their delivery process, increase the quality and creativity of their ad campaigns, discover new ways of analyzing data, and decrease turnaround time — but retain the very human element of taste and experience.
Bad agencies will use AI as a crutch, and churning out deliverables on autopilot.
In every industry, there comes a tabula rasa, a pivotal point in which the slate is wiped clean, the board is reset, and the players start again. I’d say we’re very close to that point—even the barista knows it—and the resulting chaos may very well filter through every agency in existence.
If you use Google Ads primarily as a growth tool, it stands to reason that you would dedicate your budget in part or in whole to acquiring new customers.
While there are certainly strong use cases to drive repeat business through search advertising, you have other arguably better (and certainly less expensive) ways to engage existing customers once you’ve met their initial demand – like email and SMS marketing.
Whether you’re running lead generation campaigns or ecommerce in Google Ads, the cost of advertising is high enough that it makes sense to focus on those users who haven’t bought from you before.
New Customer Acquisition is a functionality in Performance Max and Search that allows you to exclude users who have done business with you using a customer list. Accurate data is essential if you want to use this setting to ensure good results.
Why New Customer Acquisition Is Important
If you have New Customer Acquisition activated without having a good handle on your data, there’s a good chance that your ROAS is lower than it appears to be.
If you do not properly define existing customers or the value of new customers, this can result in your account overpaying for existing customers, thus distorting ROAS.
Each of the columns in the image above adds context to how your New Customer Acquisition is performing:
Conversions: The total number of conversions, as defined by the primary conversion action of the campaign
New customers: How many of the conversions stem from customers who are not present on your customer list
Conv. value: The total value of all conversions, including any extra conversion value attributed to new customers
New customer lifetime value: How much of the conversion value is attributed as incremental value from new customers
Two Strategies for New Customer Acquisition Explained
Google Ads does a good job of allowing advertisers who know how to set up ad accounts to do so in a way that makes financial sense of their investment.
One of the ways this shows up is in how New Customer Acquisition offers two approaches to optimize bids for new customers. Both of these approaches are viable with the right data, so choose the one that makes sense for your account’s campaign and business goals.
1. Bidding Exclusively On New Customers
If your sole focus is to reach people who have never done business with you, you can tell Google to only serve your ads to new customers and ignore those who have converted in the past.
In this approach, you only need to define existing customers when you set up audience segments in the campaign. This way, Google knows which customers are existing ones and can therefore focus on others who are searching for what you offer.
2. Bidding Higher On New Customers Than Existing Customers
At other times, you may still wish to show your ad to people who have done business with you in the past – but they may be less valuable and therefore take a lower priority.
For this second approach, in addition to defining existing customers, you must also define a value attributed to the conversion of new customers. This provides a signal to Smart Bidding that this customer type is more valuable, so that it can begin to bid higher on similar signals.
How to Succeed with New Customer Acquisition in Google Ads
If you do not properly define your existing customers and the value of new customers, it can result in overpaying for existing customers and thus distorting ROAS.
Take these steps to prepare your campaign ahead of prospecting for new business:
Ensure that you can create a detailed audience segment with existing customers. You will need at least 1,000 active customers on the list. Not every business and account will be able to do this, and they should refrain from using Customer Acquisition to avoid overpaying for existing customers and distorting ROAS.
Assess whether you can assign an additional value to new customers. You can use considerations like buying patterns, fee structures, and other financial details to arrive at a value. Keep in mind, this value is attributed the same regardless of the conversion’s original value, so even a small extra value can significantly enhance your ROAS and Smart Bidding.
If testing New Customer Acquisition, include the “New customers” and “New customer lifetime value” columns in your campaign overview. This allows you to monitor conversions from new customers and the total additional value attributed to them, letting you better assess the impact on your overall ROAS.
2023 was a lot. There were big cultural events that shook economic stability, as well as major innovations in ad tech.
One can never be sure how these changes will influence ad accounts. Sometimes they’re negligible, other times they have a big impact (for good or for ill).
We decided to look at the following mechanics and how advertisers can take the lessons from 2023 to future-proof their campaigns moving forward:
Match types: Did Broad Match enhancements in May of 2023 move the needle on its performance?
Auction price volatility: How have auction prices changed and what impact does that have on other key metrics for major verticals?
Performance Max: Are best practices actually best practices and just how much ROI is there in investing extra effort in creative?
We combined all three studies into one massive report because we see these questions as relating to each other. When match types behave the way you think they will (or don’t) that directly influences whether your account structure is going to deliver strong ROI. Volatility in auction prices might make you likely to trust PMax even though there are strong gains and paths to profit.
If you’re just interested in one of these questions, you can skip to that section in the navigation, but without any further ado, let’s dive in!
Match Types: Has Broad Match Evolved Enough & Is Exact Still the Best Path to Efficient Profit?
Before we dive into the data - here’s the TLDR:
While Exact did have more accounts (4000) performing better than Broad (all metrics), the difference closed a lot since our last investigation. This shows big improvements for Broad Match!
Average CPCs being as close as they are feels tied to general market fluctuation than one match type being “better” than the other.
Phrase Match remains statistically insignificant as advertisers own that Exact performs the same job, and Broad Match has a place in today’s PPC landscape.
Criteria for the Study
Must be running for at least 90 days prior to Q4 2023
Minimum spend of $1000 and maximum spend of $10 million per month
No branded campaigns included
Must have both Broad Match and Exact Match in the account
Metrics
ROAS
25.90% of accounts performed better with Broad, median percentage difference is 52.78%
74.10% of accounts performed better with Exact, median percentage difference is 100.59%
CPA
26.16% of accounts performed better with Broad, median percentage difference is 41.11%
73.84% of accounts performed better with Exact, median percentage difference is 97.11%
CTR
18.43% of accounts performed better with Broad, median percentage difference is 24.83%
81.57% of accounts performed better with Exact, median percentage difference is 51.11%
Conversion Rate
37.88% of accounts performed better with Broad, median percentage difference is 35.29%
62.12% of accounts performed better with Exact, median percentage difference is 41.05%
CPC
51.50% of accounts performed better with Broad, median percentage difference is 24.91%
48.50% of accounts performed better with Exact, median percentage difference is 30.22%
Findings and Analysis
Broad may not perform at the same level as Exact, but the performance gap closed quite a bit since we last ran this study. We have a few thoughts on why this may have happened:
Google made major improvements to Broad Match and it shows. Between the multilingual understanding and focus on intent, Broad Match is a much more reasonable data source than it was before.
Auction prices trickle down to ROAS and CPA. While there is no denying Exact had demonstrably better ROAS and CPA, the median performance improvements were better. This might be due to rising CPCs across the board.
PMax Search Themes are a factor here - they will always take a back seat to Exact Match while having the potential to win over Broad and Phrase if the syntax better matches the search theme. Given the wide adoption of PMax and statistically relevant adoption of search themes, broad might have performed even better if budget wasn’t diverted to PMax.
Action Plan
At this point there is no denying the match types have evolved to render syntax-driven structures moot. Whether you lean into Broad Match, DSA, or PMax as your data driver, you’re going to need to account for rules of engagement.
The Case for Keeping Broad in Your Account
Broad Match will show you exactly how various queries matched. While this might feel like an overrated feature, seeing what percentage of your Broad Match traffic would have come to you via phrase/exact can help you prioritize which keywords to keep/change out in your core ad groups.
If you use Broad Match, be sure that you add your other keywords as ad group level Exact Match negatives. This will ensure that your Broad Match keyword is able to do the job you intend for it to do without cannibalizing your proven keyword concepts.
To do this, you can run any of the following strategies:
A Broad Match ad group with one to two Broad Match keywords you’re using to gather data. The other ad groups in the campaigns should exclusively be Phrase or Exact (I’d suggest Exact).
A campaign with one ad group using Broad Match and all the other campaigns exclusively using Exact/Phrase.
Between the two, I’d suggest using the first method as that way Broad and Exact ad groups can help each other average out the deltas in the match types’ metrics. Without the conversions from Exact and the volume from Broad Match, campaigns might struggle to ramp up.
Choosing the right Broad Match keyword champion is the most critical choice. A few considerations:
Does the keyword represent the best “deal” on traffic?
Cheaper keywords won’t win every exploratory auction, but they might help you get discounts on high-value keywords when available.
Don’t ignore quality on the path to the best deal. The keyword still needs to represent your customers.
Keywords have different auction prices in different locations. Be mindful that your champion might need to change depending on geos.
Is the keyword representative of your Exact Match keywords or is it testing completely new ideas?
The benefit to being completely new is that you’re able to test your assumptions on established keyword concepts (i.e. they’re Exact).
Locking in the same root words in a Broad keyword lets you test for variant drift (what percentage of your queries come back as close variants with different root words).
Do your best customers search this way?
Lead gen and ecommerce campaigns need to factor in ROAS. Depriving Google and yourself of revenue data (even if it’s a projection) is asking the algorithm to focus on volume over value.
Honoring how your best customers search (high margin, easy to take care of, etc.) ensures that you’re not only matching keywords, you’re aligning creative.
The core ad metrics to focus on are CPC, conversions, CPA, and CTR-to-conversion rate.
The Case For Using PMax/DSA
PMax represents “black box” marketing to many, but as we’ll go over in the next section, there are a lot of areas for optimization and profit. Choosing to put your Broad Match budget into PMax may serve you better as it inherently comes with channels beyond search.
As younger generations come into their buying power, they are “searching it up” vs Googling it. That means having a presence on YouTube or other meaningful sites can be the difference between having a profitable conversation and losing to your competitor.
The other big checkbox for PMax (or DSA if you truly need just search) is that you won’t be subject to human bias. The keywords you think you’ll need might only cover part of your core customer base. Additionally, human-created keywords (even Broad Match) are subject to low search volume.
Be sure that you’re checking the search term insights to understand what keyword concepts are coming out and which might make sense to include as an Exact search term.
We’ll be going into the data on Search Themes in the PMax section, but it’s worth noting that exactly replicating your search keywords as search themes is likely a mistake. This is because your Exact Match keywords will always win, but phrase and Broad Match can lose to search themes.
Performance Max: What Are Most Advertisers Doing and Are They Right?
Here’s the TLDR on PMax data, which is framed more as questions than organizing by metric gains:
This is not an “easy campaign” type. While only a small percentage of advertisers had campaigns in the red (3.92% of campaigns), advertisers who put in average effort got average results.
There is no right answer on whether to segment your PMax campaigns through asset groups or a separate campaign. Use budget and priority of the product/service as your guiding lights.
We as an industry have a bias for text assets but successful marketers have just as many images and are leveraging video they create.
There is a bias around feed-only campaigns doing better than any other. While they do have a higher median ROAS, they also have the built-in bias of ecommerce having wider adoption of ROAS bidding.
Criteria for the Study
The account needs to be active for at least 90 days prior to the investigation period
Monthly spend needs to be at least $1000 per month and could not exceed $10 million per month
The account needs to have conversion events firing successfully
7100 ad accounts and over 18K campaigns worldwide qualified for the study
Metrics/Questions
Question #1: What Does the Average Advertiser Do with PMax?
57.72% of advertisers run a single PMax campaign in their account
42.28% of advertisers run multiple PMax campaigns.
While 41.35% of advertisers ran one campaign with one asset group, the median number of asset groups per campaign across all advertisers is 31.
Advertisers load up on text assets (16 median per campaign), and image assets (13 median per campaign), but fall short with video (4 median per campaign).
99.2% of advertisers use audience signals.
33.3% of advertisers use search themes.
55.65% of advertisers use account exclusions in combination with PMax. These include negative keywords, placement exclusions, and topics.
72.5% of advertisers run feed-only campaigns.
Analysis/Thoughts
There are some biases in the data given that Optmyzr’s toolset proactively lets advertisers know if they’re missing audience signals. Additionally, there are tools for building out new shopping-oriented campaigns based on performance. This means our customer base is predisposed to harness feed-based PMax campaigns.
Despite those biases, there is no denying that feed-based PMax campaigns are the most popular. This is also due to ecommerce having a wider adoption of PMax than lead gen. There are a few reasons for this:
Smart Shopping got rolled into PMax and so many ecommerce marketers felt compelled to leverage PMax.
PMax thrives on ROAS bidding but can also function with CPA bidding. Lead-gen brands historically struggle to adopt ROAS bidding because they’re nervous about feeding bad data into the system.
Google-first advertisers tend to be more analytical than creative. This is absolutely shown in the bias towards text creative vs. visual. What’s interesting is that despite most PMax channels being visual, advertisers still cling to text (and expect amazing results).
Whether this is because they believe text is synonymous with bottom of the funnel, or because they are not confident or skilled to provide visual content; the fact remains that auto-generated content has a viable place in the marketplace until advertisers own it.
I was truly surprised that it’s essentially 50/50 on whether advertisers use exclusions with PMax. Given how vocal we are as an industry, I was expecting near-universal adoption. It’s unclear whether those who don’t use exclusions are doing so because they trust Google or if they don’t know how to apply exclusions.
Question #2: What Impact Does Applying Effort to PMax Have?
Before we dive into the numbers, it’s important to acknowledge the impact spend has on results. Larger spend accounts will have smaller gains because percentages are going to be smaller. We are sharing median values to mitigate this as much as possible.
Impact of Exclusions (negative keywords, placements, topics)
Campaigns using exclusions (3963) have a median CPA of $21.45 and ROAS of 425.28%
Campaigns not using exclusions (3158) have a median CPA of $18.55 and a ROAS of 423.44%
There is only a .24% difference in conversion rate between campaigns using exclusions (favors not using exclusions)
Impact of Using Feed-Only vs All Creative Asset Campaigns
Feed only campaigns have a median CPA of $21.58 and a ROAS of 502.21%
All asset campaigns have a median CPA of $16.35 and a ROAS of 101.71%
Feed only asset campaigns have a median conversion rate of 2.32% vs all asset campaigns with a conversion rate of 4.72%
Impact Of Using Audience Signals
Note: There is such a delta between accounts that use audience signals vs. those that don’t that we will only be highlighting the metrics of accounts that do. This is because we could only find 121 qualifying campaigns that didn’t use audience signals (compared with the over 14K that do). We’ll be sharing the performance gains vs the actual metrics.
35% better CPA
89% better ROAS
8% better conversion rate
Impact Of Using Search Themes
Campaigns using search themes saw a median CPA of 22.46 and ROAS of 377.33%
Abstaining from search themes resulted in median CPA of 20.30 and ROAS of 453.95%
Conversion rate is flat between using Search Themes and not using them
Impact Of Segmenting PMax Campaigns By Asset Group
Median ROAS of One Asset Group 424.57%
Median ROAS of Multiple Asset Groups 461.64%
Median ROAS of All Campaigns 426.66%
Analysis/Thoughts
There are some real surprises here on what impacts performance. I was not expecting Audience Signals to be such a big factor given that Google shared they’re designed to help teach the algorithm in the early days of the campaign. That near-universal adoption contributed to such big gains points to more utility than an early campaign boost.
Given that audience signals are so important, it’s critical that you’re setting yourself up to leverage them in the privacy-first world. Google now requires consent confirmation attached to your customer match lists and if you don’t include them, the list might fail.
Another big surprise was how tepid the results for search themes are. Given that search themes are designed to represent keywords in PMax, one would think adoption would serve better.
However, there was a sizable population of marketers using their keywords as search themes. This is a bad idea (unless the search themes/keywords are in transition) because Exact Match will always win over search themes.
However, Broad Match and Phrase can lose to search themes if the search theme syntax is closer.
The ideal workflow for search themes is to use them to test potential new Exact Match keywords. If you see your PMax campaign picking up more valuable traffic than your search campaigns, you know you need to consider adding those search themes as Exact Match keywords. Then you can test new search themes.
The control freak in me was disappointed that leveraging exclusions essentially represented a wash. That conversion rates were flat and the gains were very small on accounts that used exclusions makes one question if they are being used correctly.
I believe there is a strong human error component influencing the numbers (people not correctly applying account level negatives or not being aware of the form for campaign level).
That said, numbers don’t lie and it might be worth testing some campaigns without the human bias (provided brand standards are still accounted for).
Before we dive into the state of accounts in general, we wanted to address the biggest PMax question of all: is it worth it to do segmentation work?
Short answer: yes.
Long answer: your budget is going to influence whether you make this an asset-level or campaign-level segmentation.
If part of your business needs a specific budget, then asking one campaign to do all the work might be tough (especially if you’re serving multiple time zones/cost-of-living geos).
Conversely, if margins and value are essentially the same, you likely can save budget by consolidating with a multi-asset group PMax campaign (you can have up to 100 asset groups).
Industry View on CPCs, CPAs, ROAS, Spend & What You Can Do About It
Last year at the Global Search Awards, I had a great conversation with Amanda Farley about her suspicion that CPCs were being jacked up by human error and panic. We both agreed that the volatility in the economy and the fluctuations on the SEO side were causing erratic spending. Yet without data, we couldn’t quite put our finger on it.
Here’s a look at 2023 main metrics for the major verticals in the Optmyzr customer base. A few notes about the data:
This data is based on 6758 accounts globally.
We are including the Median change as opposed to the hard numbers. This is because accounts have a number of different factors and getting caught up in a specific number isn’t as useful as finding the profitable number for you.
Metrics
Vertical Breakdown
We looked at 6,758 accounts worldwide and compared their average and median performance difference between 2022 and 2023.
Core Findings for Cost
Spending being up across the board could have been a bad thing. However, as the ROAS and CPA graphs show, many industries have seen greater success in 2023 than in 2022.
There were a number of big SEO updates in 2023, so there is a certain degree of mitigation spend vs success spend.
The big spike in the Pet vertical is in large part due to budgets being smaller.
Core Findings for CPC
PMax plays a large role in the reduced CPCs. Given that visual placements have cheaper auctions and are a big factor in PMax campaigns, it makes sense that CPCs would trend down.
Verticals that saw spikes in CPCs (home services, law, pet, real estate, and travel) represent ties to other ad types (Local Service Ads and Hotel Ads). While those spends aren’t factored in the study, it’s worth noting that those ad types have gained much stronger adoption as CPCs rise.
We found that accounts using portfolio bidding with bid caps (either through the ad platform or using Optmyzr budget pacing tools) can help set protections in place while still leveraging smart bidding.
Core Findings for CPA
Legal is the big loser here and there are a few reasons for this: inability to leverage automation/AI due to brand restrictions, choosing ego bidding over cost-effective cost per case, and greater adoption of offline conversions factoring in the volatility of legal leads.
The fairly flat or decrease in CPA in other verticals speaks to consumer confidence, as well as a rise in micro-conversions. Accounts by in large do not use the conversion exclusion tool, which means the influx of Google-created conversions from GA4 might be a factor here.
Auto and real estate having such strong performance are tied to each other as more and more folks push for home ownership but might be forced to move outside their working cities.
Core Findings for ROAS
ROAS up or flat across the board could be taken as a stamp of approval for PMax or could be a sign that more folks are adopting ROAS bidding.
It’s worth noting that CPA decreases for the most part did not result in ROAS losses.
The general “frustration” in the market is likely from ecommerce. With CPAs up 10% and ROAS essentially flat, it speaks to consumer restraint as well as the emergence of TikTok Shops, Temu, Advantage+, and increased Amazon adoption.
Value Of Branded Campaigns
No. of accounts
CPC
CTR
Conv Rate
ROAS
CPA
Accounts that do not contain any branded campaign
9118
0.48
2.10%
7.24%
449.37%
6.65
Accounts that contain at least 1 branded campaign
10201
0.73
1.85%
7.97%
559.80%
9.15
Analysis/Thoughts
Here’s why we included the branded analysis with the vertical one: the impact on CPC and subsequent CPA/ROAS.
Branded campaigns have historically been heralded as an easy way to ramp up campaign performance. However, with the rise of PMax and the general flux in spend, the clear benefits and “best practice” level adoption are up in the air.
The ROAS and conversion rate gains aren’t that significant and all other metrics favor accounts that don’t run branded campaigns.
Based on the PMax adoption and the spend data I have two potential reasons for this:
Advertisers are jaded and have rolled branded spend into PMax and are treating PMax campaigns as branded/quasi remarketing campaigns. While I don’t think this is wise (especially given how search themes work and the ability to exclude branded), there’s no denying the level of cynicism that’s crept into the space.
Google has gotten smarter/better and no longer needs branded campaigns to understand an account has valuable campaigns.
Ultimately I still believe there is utility in a small-budget branded campaign because that way you can add it as a negative everywhere else.
Regarding the Vertical Spend Data
It is genuinely surprising to see every vertical spending more (regardless of performance gains or losses). This speaks to scares from the SEO side of the house and folks feeling like they need to make up the volume through paid. While we did hear some sentiment around fears in rising CPAs and CPCs, it’s worth noting Optmyzr customers for the most part saw cheaper CPAs and greater ROAS (with legal being a major exception).
We investigated how many ads per ad group each vertical had and were not terribly surprised all but Auto had a median of 1 (Auto has 2). This speaks to the trust among most advertisers (53%) to follow Google’s advice on the number of assets.
Many advertisers focus on Google first, regardless of whether that channel will serve them well. If you’re going to advertise on Google you need to make sure you can fit enough clicks in your day to get enough conversions for the campaign to make sense.
One of the reasons Optmyzr builds beyond Google is we see the importance of harnessing social and other search channels. Don’t feel trapped by habit.
That said, despite upticks in spend, there are clearly winning verticals, and all verticals came in flat or up on ROAS.
The Time for Automation Is Now
There has never been a better time to embrace automation layering in PPC. Having the ability to put safety precautions on bids as well as the importance of honoring what tasks will yield the highest ROI on time is mission critical.
Whether you’re an Optmyzr customer or not, you should be empowered to own your data and your creative. PMax is a staple campaign type at this point and fighting it is just going to leave you behind. However, not every task needs to be done and ultimately budget should determine how much you segment.
Keywords may be dancing between relevance and history, but until the ad networks retire them, it is important to know that Exact Match is where performance is and Broad Match is where testing lies.
After the Display vs Discovery Ads challenge, we decided to run a new test in the last part of 2023 to compare Demand Gen campaigns’ performance to that of “regular” Display campaigns. As in the previous experiment, we set the same budget for about 30 days, using the same content & targeting options. Here’s what happened.
This time we promoted ADworld Experience video-recording sales. As some of you may already know, ADworld Experience is the EU’s largest all-PPC event. Its main target audience is seasoned PPC professionals, who work with Google Ads, Meta Ads, Linkedin, Microsoft, Amazon, TikTok, and other minor online advertising platforms.
During the previous test, we found that experienced PPC professionals could be effectively targeted using an expressed interest in any advanced PPC tool. So we selected the most renowned ones excluding those not directly related to the main platforms.
Here are the brands we targeted in alphabetical order: adalysis, adespresso, adroll, adstage, adthena, adzooma, channable, clickcease, clickguard, clixtell, datafeedwatch, feedoptimise, feedspark, fraudblocker, godatafeed, opteo, optmyzr, outbrain, ppcprotect, producthero, qwaya, revealbot, spyfu, squared and taboola.
Using this list we were able to set up 3 different audiences based on:
PPC professionals who searched for a PPC tool brand in the past on Google;
PPC professionals who are interested in a PPC tool;
Users who have shown interest in PPC tool website URLs in SERPs.
Then we created a Demand Gen campaign and a regular Display campaign, with 3 ad groups each, based on one of the above audiences. The key settings were:
In both campaigns we limited demographics to users aged 25 to 55 (the main age range of adwexp participants) + unknown (not to limit too much the audience) and in Display campaigns we excluded optimized targeting (to avoid unwanted overlapping).
The goals were: past edition video-recording sales and navigating 5 or more pages in one session (to grant Google’s smart bidding enough conversion data to work on).
Geotargeting was limited to the home countries of the majority of ADworld Experience past participants (a selection of EU countries + UK, Switzerland, Norway, and Finland). We targeted all languages used in these countries and scheduled ads to appear every day from 8:00CET to 20:00CET.
In Demand Gen we had to accept Google’s default filter for moderate and highly sensible content. In Display, we excluded all non-classified content, fit for families (= mainly videos for kids on YouTube), all sensible content, and parked domains.
The bidding strategy was set for both campaigns on Maximize Conversions, not setting (at least initially) any target CPA.
Text and images were almost exactly the same, even if placements were different (GDN for Display and YouTube, Gmail and Discover newsfeed for Demand Gen). We were forced to shorten some headings in display campaigns, but descriptions and images (mainly 2023 speakers’ photos) were exactly the same. In the Display campaign, we were able to select also some videos and left auto-optimized ad formats on.
Regular Display Ad Examples
Demand Gen Ad Examples
Once we started the experiment, in the Display campaign we were soon forced to set different target CPA to grant all different groups/audiences a more uniform distribution of traffic, lowering it where it spiked and increasing it where it languished. In Demand Gen, we had to pause 2 out of 3 groups to give all of them a minimum threshold of traffic to count on (“Searchers of PPC Tools” adgroup in Demand Gen did 0 impressions for almost 20 days, until that).
In the Display campaign, we excluded all unrelated app categories (all except business/productivity ones) and low-quality placements spotted in the previous test, starting with almost 500 exclusions.
The Results
Here are the numbers we had about 5 weeks and 1.200€ spent after.
Regular Display Campaigns
Demand Gen Ads
If we look at global conversion numbers Google seems to have worked very well with Demand Gen. These AI-powered campaigns clearly outperformed both a professionally set Display campaign with the same content/setting and the old Discovery Ads we used in the previous test to promote the 2023 event registration (if we do not consider last week results, that were comparable).
Audiences performed in a fairly homogeneously way in Display, while there was a clear winner in Demand Gen, with the audience built on PPC Tools’ URLs, which Google was very fast to spot just 1 week after the kickoff, while Discovery’s latency on our previous test has been 3 weeks long. The only negative aspect of DGen traffic is the lower percentage of engaged sessions in GA4 (session longer than 10 seconds or with a conversion event or at least 2 pageviews/screenviews). It seems that GDN can still bring to your website more in-target users.
Almost all Demand Gen placements were on YouTube (both the converting ones and the rest), making me say that probably would have been better to compare this campaign with a Video Campaign, more than to a GDN one. The Display campaigns were totally on the other side of the channel, with very few placements alongside videos (& with incredibly high CPCs in some rare, but remarkable cases) and the large majority of impressions & clicks made on regular AdSense network sites.
I was also surprised to see that this time audience performances were comparable in both campaigns, while in the Discovery vs Display test “PPC Tool past searchers” achieved the best Conversion Rates in GDN. To explain that I can only suppose that this was due to the difference in the set goals. Joining an advanced event live is probably more attractive for a PPC pro than looking at its videos afterward. The most laser-targeted audience of someone who has recently searched for a valuable keyword should probably still be the best option in Display, while it is too narrow for DGen.
Final Takeaways
My final takeaway is that if your goal is not only to convert but to drive low-cost (but still well-targeted) traffic to your site with a set-and-forget campaign, then Demand Gen Ads are your must-go.
While, if you have a low budget but want to get results at an acceptable cost and have time and know how to optimize settings, then old-style Display campaigns may still be a good option. In both cases, tests with different audiences & assets are vital if you do not want to throw your money in Google’s vacuum!
If you are curious about specific aspects of the test, reach out to me, and we’ll be happy to drill down the data for you. Now it’s your turn. Did you do any comparison between Demand Gen and regular GDN campaigns? What are your findings?
In the ever-evolving world of paid search advertising, understanding the intricacies of platforms like Google and Microsoft is critical for campaign success. While these platforms are similar in many aspects, there are a range of distinct features that can significantly impact your advertising outcomes.
This article tells you what those differences are and how you can take advantage of them for maximum account performance.
Campaign Level Settings
At the campaign level, both Google and Microsoft provide a suite of settings designed to tailor your advertising efforts to your specific needs. Both allow for the following campaign-level settings:
Budget
Location
Ad schedule
Bidding strategies
Placements outside the “core” channel (search partners, display expansion, etc.)
Google
Google allows advertisers to set a daily budget of $20 for a local bakery looking to target customers within a 30-mile radius. This bakery can also schedule ads to run only during business hours, ensuring the ads are seen by potential customers when the bakery is open. The Google advertiser could include image assets to enhance their search with display select campaigns and would need to make that choice at the campaign level.
Microsoft
Conversely, Microsoft takes it a step further by allowing ad scheduling and location targeting at the ad group level. This means our local bakery could create one ad group targeting morning commuters with breakfast offerings from 6-9 AM and another targeting the lunch crowd from 11 AM-2 PM, each within specific areas known for high commuter traffic. While Google advertisers could do this, they’d need a campaign per schedule. Additionally, they’d be able to pick and choose which ad groups get added to search partners including Duck Duck Go and Baidu.
Keywords and Negatives
The approach to keywords in Google and Microsoft can make or break a campaign. Targeting keywords helps advertisers reach prospective customers, while negative keywords block wasteful/irrelevant traffic.
Google
Three distinct targeting match types (broad, phrase, and exact), and three distinct negative match types exist. Targeting keywords allow for close variants, while negative keywords do not. As a reminder, broad match negative means the words as they are spelled can be anywhere in the query to block traffic.
Microsoft
Three distinct targeting keywords, but only phrase and exact match negatives exist. I personally tend to just include phrase match negatives for single words I want to exclude so I can use the same lists for both networks.
Bidding
The bidding strategies offered by Google and Microsoft are critical for managing how your budget is spent and how your ads are positioned.
Google
Smart bidding can be turned on at any conversion threshold (though it’s not recommended under 30-50 conversions in a 30-day period), devices can be completely excluded, and portfolio bidding with bid caps. Google allows for impression share and max clicks bidding to help advertisers ramp up while they wait for conversions.
Microsoft
For the most part, things are the same in Microsoft. However, the minimum bid is $0.05, Smart Bidding is still “Target ___”, and no turning on Smart Bidding till you have at least 15 conversions. Note that Microsoft still supports Smart Shopping (though portfolio bids are not compatible with it).
Audience Targeting
Effective audience targeting is essential for reaching potential customers who are most likely to convert.
Google
First-party lists must have at least 1000 people and at least one new person added every week. There should be a minimum spend of $50K and at least 90 days of data to use. Additionally, Google serves ads in the time zone of the account. And YouTube audiences (who interacted with your video/channel) can be leveraged for targeting or observation.
Microsoft
While Microsoft requires 1000 people in the first-party lists, it does not require the same spend. Audiences can include LinkedIn data (company/job title). Note that Microsoft serves ads in the time zone of the user.
Performance Max Campaigns
Performance Max campaigns offer a holistic approach to PPC, blending various ad formats and platforms.
Google
The originator of the campaign type. This campaign type covers text, image, and video ads across search, shopping, display, YouTube, discover, Gmail, and local ads (not to be confused with local service ads). They can have up to 100 asset groups and 25 search themes per asset group.
Microsoft
Almost every mechanic is the same save for requiring a video component. This is because the Audience Network (which includes Duck Duck Go and Baidu) is image and text-heavy. Additionally (as of this post’s publication date), Microsoft does not have search themes.
In sum, while Google and Microsoft share foundational similarities in their PPC offerings, the nuanced differences between them can greatly influence the effectiveness of your advertising efforts. By delving into specific settings and examples, as we’ve done here, you can gain a deeper understanding of how to navigate and take advantage of these nuances, crafting campaigns that are not only more targeted and relevant but also more cost-efficient and successful.
At Optmyzr, our goal is to empower advertisers to fully harness the capabilities of both platforms, ensuring that your PPC campaigns are primed for success in the dynamic digital advertising landscape. By embracing the unique features and opportunities presented by Google and Microsoft, you can achieve unparalleled results, driving growth and maximizing ROI in your digital marketing endeavors.
Not advertising on Microsoft yet? Take advantage of the auto-import functionality and account creation within Optmyzr.
Thousands of advertisers — from small agencies to big brands — worldwide use Optmyzr to manage over $5 billion in ad spend every year. Plus, if you want to know how Optmyzr’s various features help you in detail, talk to one of our experts today for a consultation call.
Increased automation and limited targeting will bring about a shift in the way we see our role as advertisers and how we plan our campaigns in 2024. Not only will we play a more strategic part rather than an executional one, but we will also have to rely less on targeting in the process.
Gone are the days when you spent hours refining your audience targeting to perfection. Now is the time to embrace broad targeting and face the cookieless future heads-on. How do you do that? Go back to basics and put the creative at the center of all that you do.
Get actionable PPC tips, strategies, and tactics from industry experts twice a month.
This change in mindset and priorities will influence your work on various levels, from PPC strategy and planning to data analysis and testing.
A creative-first approach means paying more attention to how an ad looks and performs and collecting data that will inform your future decisions. For example, the statistics may tell you which display ad design types are the most popular.
To illustrate different approaches to making your creative stand out, I would like to offer an example from my own professional experience and see what we can learn from it.
Context
Me and my colleagues at Creatopy organize webinars periodically, in which we invite industry experts to share their valuable insights on current and complex advertising topics. This is not only to help our participants deepen their understanding of said subjects but also to show them actionable tips that they can apply to their ad campaigns.
It is part of my job to promote the webinars and make sure they reach the right audience and bring as many registrations as possible. The campaign that I want to talk about is the one I ran for the webinar on How to create zero-click ads that convert with Jonathan Bland, its landing page is shown below.
**Source**: Creatopy
Ad creatives
For this particular campaign, I decided to take a more out-of-the-box approach based on recent trends and test designs that look decidedly different from the ads we usually run alongside some of our more tried-and-true types of creatives.
So I used seven ad creatives in total, three of which were more conventional, and the other four less conventional.
**Source**: Creatopy
As you can see in the image above, what I mean by ‘conventional’ is the fact that all three ads represent the classic way of promoting a webinar. They convey the ‘what’ and ‘who’, as in the topic of the webinar, and the name of the speaker, whose face is also featured in the visuals. The phrase ‘free webinar’ also appears on all three ad designs.
The second set of ads is unconventional in the sense that they don’t make it clear from the start that you are seeing an ad that promotes a webinar.
**Source**: Creatopy
First of all, none of them contains the word ‘webinar’. And secondly, the face of the speaker is shown only in one of the visuals, the first ad design seen in the image above. The ad looks like a Twitter thread, so the speaker’s face appears just as part of his Twitter profile and does not present him in direct correlation with the webinar as seen in the conventional ad designs set.
It’s clear that these four ad designs don’t make any reference to the main elements that the first three do—the words ‘free webinar’, the face and name of the speaker—which are key details to mention, you would think, if you want people to register for your webinar through an ad.
Campaign stats and results
All seven ads ran on Instagram, and the data presented here is for the first 19 days of running the webinar, from December 14, 2022, to January 2, 2023. We spent $1,032.52 during this period of time and managed to bring 42 registrations to the webinar, at a cost/registration of $24.58.
All the ad creatives targeted the same:
Nine locations: Australia, Canada, Germany, Denmark, Finland, the U.K., the Netherlands, Norway, New Zealand, Sweden, and the U.S.
Age group: 25-55 years
Audience: advertisers, based on a mix of interests, behaviors, and job titles
Language: English
Device: Mobile
Landing page
Description: “Find out in our webinar how to optimize your ad for the 99% of people who are not clicking on your ad.“
CTA button: “Learn more“
The only variable here was the creative.
This is the first webinar where we also tested ads that don’t necessarily look like ads, the aforementioned second set of creatives. We wanted to increase interest through the creative. To see the impact the creative has over the results, if any. And the results were interesting, to say the least.
The more conventional type of ads brought 30.9% out of the total registrations to the webinar, while the unconventional ones brought the rest of 69.1%. What’s more, the ad design with the highest percentage of registrations by far, namely 42.9%, is part of the unconventional set. It amassed double the percentage of registrations compared to the creative that came in second place, an ad from the conventional set (21.4%). Close on their heels is another unconventional ad, with 19% of registrations.
In the table below you can see more in-depth data about each ad creative, such as CTRs, reach, number of users who landed on the page, cost/landing page view, number of registrations to the webinar, cost/registration, registration rate (registrations divided by users, multiplied by 100), and cost.
**Source**: Creatopy
This data can provide us with a better understanding of the true winners of this experiment.
The ads that the algorithm pushed in front of the users and which spent more budget in total are indeed in our top three in terms of webinar registrations, while also having the lowest costs/registration.
CTR-wise, the top three are entirely made up of unconventional ads, the sixth creative occupying the first place with a CTR of 0.64%, followed very closely by the fifth and fourth ads, with CTRs of 0.61% and 0.60%, respectively. Coming in fourth is Ad Creative 1, part of team Conventional, with a CTR of 0.44%. We notice a higher click-through rate on the more out-of-the-box ads, showing us that they are more appealing to the users and more powerful in arousing their interest and curiosity.
Also, interestingly enough, if we look beyond the number of users brought to the webinar, things look a little bit different. By registration rate standards, which are obtained by dividing the number of registrations by the number of users who landed on the page, the winner is the first ad, which is more conventional. This ad also takes the prize when it comes to cost/registration, which is the lowest out of all seven ads.
Why did this happen? Simply put, the first ad creative is the most similar to the landing page from a visual standpoint. All ad creatives are designed with the landing page in mind, but it would have been difficult to test these seven different ad designs and have them all incorporated into the same landing page.
So what are the learnings?
The results show us that the tried-and-tested way of doing things can still bring good results. But to win in advertising, we must venture on the experimental path as well.
1. A continuous testing mentality
I wouldn’t advise giving up your usual way of doing things altogether, since we saw that the more conventional type of ads still moves the needle. But in order to bring the best results for your clients, you have to take both methods into account. You must be willing to test more often and test different approaches, even those that you initially thought wouldn’t stand a chance.
You will be surprised to find that, oftentimes, what we think will fail is what the audience ends up connecting with, which is more important when all is said and done. And it is this habit of continuously testing—even when things are going well—that will bring you the most rewards in the long run.
2. A personalized approach to ad creatives
I highly believe that in 2024 the ad creative will be the “new targeting”. For a campaign to achieve success this year, ad creatives will have to be more relevant to the audience than ever. In our case, the audience for the webinar is made up of advertisers, as I previously stated. This audience is primarily interested in how to create ads that convert since this is the way advertisers measure and present the success of their work to their clients.
On this note, we can see that all the top three ad creatives (1, 4, and 5) in terms of users brought to the webinar and cost/registration talk about ads that convert. Only these three ads contain the word ‘convert’, which I think is no coincidence at all. The message is both catchy and tailored to the needs of the target audience.
3. Beyond the creative is the landing page
Another learning we must take with us in 2024 is that landing pages and ad creatives must match as much as possible. The ad creative does the first part of the job, that of attracting the target audience, but the landing page is the one that can either make or break the deal. Without the ad creative, a perfect landing page wouldn’t amount to much by itself, but together they are a very powerful duo.
They must go hand in hand so the users can experience a steady flow from the ad creative to the landing page since they unconsciously expect to find the same elements on both of them. Otherwise, the chances are high that the flow is disrupted, and the user gets confused, and is driven away from our page.
To prove my point, the first phrase on our landing page mentions creating ads that convert, which happens to be present in all three of our best-performing ads as well.
Whether conventional or not, the ads that took the top three places used a message that was of high relevance and interest to the target audience, and at the same time strongly connected with the message found on the landing page. Moreover, the ad creative with the lowest cost/registration is the one that reflects the landing page the most, offering a seamless experience for the users clicking on it.
Over to you
To wrap things up, I hope I have provided some food for thought on how to better incorporate and prioritize the ad creative in your PPC strategy this year. Now all that’s left to do is to put them to the test and see what works best for your particular campaign needs. And don’t forget to keep on experimenting.
Get actionable PPC tips, strategies, and tactics from industry experts to your inbox once a month.
In this article, we’ll explore the many areas to consider and explore when evaluating Google Ads Performance Max (i.e. PMax) campaigns.
Given the current limitations of insights we can pull from these campaigns, it can be difficult to understand the causes of performance fluctuations. This guide is here to make accomplishing that task easier than ever.
First Principles: Getting Familiar With The Context Of Our Data
Does it usually take 7 days before all conversion metrics are reported? Does it usually take 11 days until a customer completes a purchase after their first interaction with your ads?
In either case, if it’s only been a few days since your last major change to the campaign, it might be best to wait several more days before rushing to any major conclusions about performance.
Try to have as much of a complete picture of conversion metrics and the typical buying journey of your customers as you can before judging the outcome of your recent changes too harshly.
One quick way to check your recent average conversion reporting delay is by navigating to the Campaigns section of your account and changing the date range to Today, then hovering your mouse over the Conversions metric in the Account row.
This helps you understand, on a high-level, how long it takes customers who see and click your ad to complete a particular conversion action. Conversions can be reported up to 90 days after the click, depending on the conversion window you’ve chosen for that particular conversion action.
Pro Tip: If you’d ever like to see the conversions that actually occurred on a given date, use the “Conversions (by conv. time)” metrics. Do note, however, that conversion by time data is only available after March 6, 2019.
Now take an account-level look at the average days to conversion for the conversion action you’re analyzing by navigating to the Attribution > Path metrics section of your account. You’ll find this section under “Tools and settings” (top-right of page) > Measurement > Attribution.
Then click “Path metrics” on the left-side of the page. Once there, change the “Conversion action” filter as needed, choose an appropriate attribution Lookback window, choose a conversion window to analyze by changing the date range, then change the “Measure from last interaction” to “Measure from first interaction.”
Note the difference between Lookback window and Conversion window, per Google:
To see this in more detail and view the average days to conversion for the PMax campaign you’re investigating, add the Conversions > Days to Conversion segment to your Campaigns data table.
Usual Suspects (Non-PMax Specific): Most Common Indirect Causes Of Performance Fluctuation
Okay, so we’ve identified that we are indeed justified in our freakout. What now?
Let’s first investigate the “usual suspects” of major changes to PMax performance.
Conversion Tracking
Have there been any changes that may have affected conversion tracking?
For example, has there been any changes to the source code of your site or Google Tag Manager, or are there any error messages showing in the Conversions section of Google Ads, the Diagnostics section of any of your Primary conversion actions in Google Ads, the Overview section of your Google Ads account, or the Google Ads Tag or Google Analytics sections of your Google Ads account within the Your Data Sources area of Audience Manager?
Budget, Bidding, Asset Group, & Listing Group Changes
Have there been any changes to the campaigns budget, bidding, or Asset Groups since performance improved or worsened?
Changes to any of these three can have major impacts on performance - especially relatively large budget increases or decreases, bid strategy type changes, enabling or disabling of Asset Groups, or Listing Group product additions or exclusions.
Google Merchant Center Issues or Major Product Feed Changes
Check the Diagnostics section of your Google Merchant Center account for any recent disapprovals or warnings. Also, check the bell icon on the top-right of your Google Merchant Center account to see if there are any other notifications of issues that may be impacting the performance of your Shopping ads.
If you’re utilizing a Content API setup within your Google Merchant Center, don’t forget to check the Diagnostics report within the Content API section of your Google Merchant Center account as well. Are there major or consistent failed API calls occurring that may be impacting your Shopping ads?
Have there been any changes to your product feed that may have affected performance? If Supplemental Feeds are in use, are they still in sync and up-to-date with your primary product feed?
Site Changes
Have there been any changes to your site such as site navigation, checkout flows, CMS plugins, web hosting, or product pages?
Even seemingly minor changes to the site can cause major, unexpected negative consequences to the performance of your PMax campaigns.
Make sure you remain “in the loop” of any changes that occur to the site so you can closely monitor their potential impacts on performance - especially any changes that might impact conversion tracking or the product pages of best sellers.
Any recent changes to products going in or out of stock on your site, especially for any best sellers? Any recent changes to product pricing or promotions, customer shipping costs or free shipping offer thresholds?
Any extremely negative reviews showing on the site, or elsewhere for your products (e.g. on Amazon, on high-traffic volume review sites)?
Google Search Console
If you use Google Search Console, are all pages on your site that you want Google to crawl indexed with Google Search Console? Are there any important URLs that are now showing as “Failing” in the Core Web Vitals section of your Google Search Console account?
Market
Evaluate changes in the search behavior for your products by reviewing, if available, the Search Terms and Search Trend Insight data in the Insights section of your Performance Max campaign and your Google Ads account as a whole.
Pay particular attention to high search volume Search Categories and search terms that have incurred large positive or negative shifts in metrics like impressions and conversions.
Outside of high search volume terms, are you seeing major shifts in the performance of other terms you’ve deemed are important, such as branded, competitor, top-of-funnel, or commercial-intent-oriented searches?
Note that Search Trend Insight data is not available for all advertisers, or these insights may not be very relevant to the products you’re offering, but do check-in periodically to see if new insights emerge.
Google will, at times, provide a notification to new insights such as these in the “Notifications” feature of your account - found by clicking the bell icon in the top-right corner of your Google Ads account.
Similarly, check Google’s built-in Keyword Planner tool and Google Trends for any outliers in interest over time for high search volume or high conversion volume search terms.
When using Google Trends, try different search terms, topics, categories (e.g. Web search, Shopping, YouTube), and date ranges to uncover potential insights into changes in search behavior.
Have people recently changed or started to change the way they’re searching for the products you offer? Are there new major competitors who’ve recently entered the market?
Is there seasonality at play or global dynamics that may be affecting the buying behavior of your products or consumer spending in general that is apparent through this analysis?
Other areas to check, depending on if these features are available to you, are the Site Search > Search Terms section of your Google Analytics account and the Best Sellers section of your Google Merchant Center account.
Are there any outliers in how people use the search feature on your site? If applicable, are you seeing similar changes in search behavior in your Microsoft Ads account? Have any of your top selling products changed in popularity rank recently?
Note that the popularity rank is the popularity of the item on Shopping ads and free listings, in the selected category and country, based on the estimated number of units sold.
Have your competitors started getting more or less aggressive in their bidding? Check the Auction Insights section of your PMax campaign to investigate. Don’t forget to check both the Search and Shopping filter of this section.
Other Marketing
Google Ads doesn’t work in a vacuum. Have you recently pulled spend away or dramatically increased spend or marketing efforts towards another marketing channel that may have caused a ripple effect to Google Ads performance?
Common examples include changes to social media marketing, email or SMS marketing, affiliate and referral marketing, or third-party remarketing channels.
Check for metric fluctuation outliers in your Google Analytics Source/Medium report or your third-party attribution software, if you have one, for more detailed performance insights.
Don’t forget to analyze the Shopping Behavior and Product Performance section of your Google Analytics account as well to locate any performance fluctuation outliers.
Non-PMax Campaigns
Have you added, paused, or made any major changes to any other non-PMax campaigns in the account?
Performance Max campaigns tend to be sensitive to and affected by relatively major changes to other active Google Ads campaigns, such as, but not limited to, Display, YouTube, Discovery, and Search campaigns using Dynamic Search Ads.
Diving Deeper (PMax Specific): Performance Fluctuations Directly Correlated To Performance Max Campaigns
Now that we’ve investigated the usual suspects found outside of PMax, let’s dive deeper into the PMax campaign in question to see if there are more causation insights we can uncover.
Google Bidding & Targeting Algorithm Shifts
Has Google started showing your ads more or less on the Shopping ads network? Build a custom report to find out using the “MC ID” dimension. This is the ID of the Google Merchant Center account associated with the products being advertised.
Note: Expect impression metrics in campaign data tables in the Campaigns section of your account to be lower than the number of impressions shown for an associated MC-ID.
Per Google: “When an ad shows many products in an individual ad slot, each product collects an impression. However, the campaign, Asset Group, and ad recognize that only a single ad was showing and will count it as one impression.”
Get a glimpse of recent optimizations made by Google’s automated bidding strategy by reviewing the Top Bidding Signals report in the Overview tab of your campaign.
Investigate the landing pages Google has been sending Performance Max ad clicks to by building a custom report using the Landing Page dimension:
Note: This report is especially important to check if Final URL Expansion is enabled for a given PMax campaign.
Additionally, in many cases, you’ll want to download this data so you can, at a minimum, run the data through pivot tables to find categorical patterns, such as the performance of blog pages vs product pages, different product categories, best sellers vs other products, home page vs product pages, etc.
Performance Metric Outliers
First, if the Performance Max campaign has reliable historical data, familiarize yourself with what “normal” performance fluctuation looks like for it. This will help stifle recency bias.
Look for metric outliers when comparing pre and post major increases or decreases in performance.
Pay special attention to diagnostic and micro-volume metrics like Avg. CPC, CTR, Impr., Conv. rate, Value / conv., Views, Avg. CPM, as well as other major performance indicators like sales-based Conversions and Conv. Value / cost or Cost / Conv.
Open the Products section of the campaign and look for any outliers in Product-specific performance outliers pre and post major drops in performance.
Look at product-specific metrics as a whole for the campaign as well as by Asset Group by adding the Asset Group table filter.
Pay particular attention to differences in high vs low Value/conv. and high vs low priced products, products with a relatively high number of impressions and relatively high CTRs vs relatively high Conv. rate products with statistically significant click data historically, and best seller impressions vs others product impressions.
Is Google now predominantly pushing lower or higher Value/conv. products? Is Google now predominantly pushing products with high CTRs but not products with high conversion rates?
Is Google now favoring to show products that aren’t your bestsellers or products you need to push?
It’s important to note that the Conversion metrics found in this Products section represent products in your product catalog that were clicked and led to the sale of some product of yours, they do not necessarily represent the number of sales of that product after an ad click.
Make sure you compare the product sale metrics you see here with what you find in the Product Performance section of your Google Analytics account with an audience filter that just shows traffic from Performance Max.
To investigate performance change outliers for Listing Groups (performance of product attributes as assigned in Merchant Center and as segmented within an Asset Group), perform the same analysis to the Listing Groups section of your PMax campaign as you did in the Products section.
Note that you will be limited in your ability to analyze comparison metrics in this section because, at the time of this writing (November 2022), comparison values are not available in the Listing Groups section of Performance Max campaigns.
Lastly, check whether there has been a change in approval status to any assets within your Asset Groups or Ad Extensions, such as Eligible (Limited) or Disapproved.
Situation-Dependent Causes Of Performance Fluctuation
It’s important to mention that there will be special case scenarios to consider when evaluating why Performance Max improved or worsened in performance that will only be relevant for some accounts.
I’ve listed many of the most common of those below.
Major promotions occurred on the site, but Seasonality Adjustments were not added to campaigns promoting those applicable products in the account.
Data Exclusions were not applied or were applied incorrectly for times when conversion tracking was down.
Other users made changes to the account unbeknownst to the primary person managing the account. It’s not uncommon to see a well-intentioned developer, for example, make a change to some conversion action settings in the Conversions section of the account without first informing the primary account manager.
Google’s Auto-Apply Recommendations feature made changes to the account unbeknownst to the primary person managing the account.
Customer Match lists were added, edited, or removed from the account.
Previously “Best” rated assets within a high-volume or high-performing Asset Group are now rated “Low.”
High-volume or high performing Search Categories or terms shifted from serving predominantly from a high-volume or high-performing Asset Group to a low-volume or low-performing Asset Group.
Major shifts in the performance of high-volume or high-performing search terms in non-PMax campaigns.
Edits were made to a Business Feed in the account that affected the non-PMax campaigns that were using them.
Errors or edits to a CRM integration with Google Ads, like Salesforce, occurred.
Negative keywords were added to the PMax campaign per the request of a user other than, and without the knowledge of, the primary account manager.
Negative keywords were improperly added to a negative keyword list that has been applied to a Performance Max campaign by a Google rep.
YouTube ad placements were opted out of by Google per the request of a user other than, and without the knowledge of, the primary account manager.
Mobile app placements not owned and operated by Google incurred sharp increases or decreases in impressions per the “Performance Max campaign placements” report.
Mobile app category exclusions were applied at the account level.
Location or Ad Schedule exclusions were added or removed in a PMax campaign.
Auto-generated YouTube videos were added to the campaign by Google due to no video assets being present within an enabled Asset Group.
What’s Next?
Warning: Don’t Make Too Many Corrective Changes At Once
Once you’ve identified areas of opportunity for corrective action or scale, don’t make too many potentially high-impact changes at once, such as changing the bid strategy type AND excluding some high-volume products from your PMax campaign.
With the limited insights we can already gather from this campaign type, the last thing you’ll want to have is a situation where you don’t know which major change you made was the cause of greatly improved or greatly worsened performance.
Where to go from here depends highly on what you found in your analysis and on many other factors that will vary dramatically from business to business, such as, but not limited to, aversion to experimental risk, available ad spend budget, profitability thresholds, goals of the business, and internal resources for account management.
This is where Google Ads is most tricky and often where businesses will turn to PPC professionals for assistance in correcting ad spend inefficiencies or scaling success in a way that is uniquely tailored to the needs and available data of the business.
Performance Max is an ever-changing new-ish product offering from Google Ads, so expect some technical areas of this guide to possibly become quickly outdated.
However, there are also many high-level data analysis principles baked in that I don’t see changing much anytime soon.
While this guide doesn’t cover every possible situation or reason for performance changes in your Performance Max campaigns, my hope is that it will be a solid starting point for most.
I’m also sharing a checklist below to help you get started quickly.
You don’t have to go through every single one of these points. Just go over the ones that are relevant to your business.
I also discussed some of these points on PPC Town Hall with Frederick Vallaeys and Mike Rhodes. You can watch the full video here:
Get actionable PPC tips, strategies, and tactics from industry experts twice a month.
Performance Max 44-point evaluation checklist for ecommerce businesses
Investigate…
Estimated conversion reporting delay.
Average days to conversion from first ad interaction (account-wide and campaign-specific).
Conversion tracking and recent changes to conversion actions.
What “normal” PMax performance fluctuation looks like for the account (if appl.)
Recent changes to budget, bid strategy type, Asset Groups, and Listing Groups
Google Merchant Center product disapprovals and warnings, account issues, and feed issues.
Changes to the site (e.g. navigation/checkout, plugins, hosting, page designs)
Changes to in-stock products, especially best sellers.
Changes to pricing, customer shipping costs, and promotions listed or previously listed on the site.
Extremely negative reviews on and off the site
Google Search Console for “Failing” URLs
Changes in relevant search and buying behavior via the Insights section of your PMax campaign and your account as a whole, Google’s Keyword Planner, Google Trends, your site’s search feature (if appl.), Best Sellers section of Google Merchant Center (if appl.), and Microsoft Ads (if appl.).
New competitors in the market or competitors who are changing their level of competitiveness within ad auctions you compete in.
Major changes in other marketing and site traffic channels outside of Google and Microsoft Ads (e.g. Facebook Ads, email automation, affiliates, third-party remarketing channels)
Major changes in on-site shopping behavior (e.g. cart abandonment, check-out abandonment, sessions with transactions)
Shifts in Shopping network-specific performance for PMax.
Top Bidding Signals report for optimization changes recently made by automated bidding.
Performance shifts of landing pages PMax ad clicks are being sent to.
Major changes made to non-PMax campaigns that may have impacted the performance of PMax.
Major shifts in the performance of high-volume or high-performing search terms, geographies, devices, days, days of the week, hours, audiences, match types, or campaign types in non-PMax campaigns.
Performance metric outliers for the campaign pre and post-major increases or decreases in performance.
Performance metric outliers for the products advertised in the campaign - at the campaign-level and Asset Group-level.
Performance metric outliers for the Listing Groups in the campaign.
Asset Group assets or Ad Extensions with Eligible (Limited) or Disapproved status.
Seasonality Adjustments not being added for major promotions, or for other major expected spikes or dips in conversion rates.
Improperly added Data Exclusions, or for instances where Data Exclusions should have been added but were not.
Scripts or Automated Rules that made changes to the account that may have had an impact on Performance Max.
Account changes by other users who are not the primary account manager.
Auto-applied recommendation changes made by Google.
Customer match list additions, removals, or edits.
Custom Experiments recently ended in the account.
Value rules or conversion value adjustments were added, edited, or removed.
“Best” rated assets inside top performing Asset Groups had a recent change in rating.
High-performing or high-volume search categories or terms shifted away from a high-performing or high-volume Asset Group.
Edits made to a Business Feed or Custom Variable that affected any non-PMax campaigns.
CRM integration issues.
Negative Keyword List was added to the PMax campaign being evaluated per the request of another user.
Negative keywords were improperly added to a Negative Keyword List that is applied to the PMax campaign being evaluated.
YouTube ads were opted out of by another user.
Mobile app placements not owned and operated by Google had major increases or decreases in impressions.
Mobile app category exclusions were applied at the account or campaign level.
Location or Ad Schedule exclusions were added or removed for the PMax campaign being evaluated.
Improperly setup Performance Max URL Exclusions.
Auto-generated YouTube videos were added by Google to the PMax campaign being evaluated.
Want to safeguard your Performance Max campaigns? Click here to learn how.
Get actionable PPC tips, strategies, and tactics from industry experts to your inbox once a month.
Performance Max is one of the biggest automated campaigns from Google in the last few years. It replaced Smart Shopping and Local campaigns in September 2022 making it very clear to us that Google has it as the top focus in its ad strategy and that more automation is on the way.
Whether we like it or not, this is the world we live in. So we have to start to work together with the machines because Google is making us and also it generally tends to provide better results.
Of course, you should never give up control of your Performance Max campaign and let automation take over. And this brings us to the concept of automation layering, which in simpler terms means adding a layer of your own automation over that of Google’s to safeguard your campaigns.
In this article, you’re going to learn how you can safeguard your Performance Max campaigns in the five following areas.
1. Account structure
2. Alerts
3. Budgets
4. Experiments
5. Placements
Let’s go into detail and learn how you can do that using Optmyzr’s tools.
1. Create the account structure that supports your business goals
When Google says “build a Performance Max campaign”, they don’t mean that you have to build just one. You can create multiple Performance Max campaigns and we recommend you do that.
For instance, you can create multiple campaigns based on margins, because margins also determine what your bidding target should be.
For high-margin products, you can afford to bid much higher and more aggressively and still make a profit. For low-margin products, on the other hand, you might want to have a different ROAS target.
Now, you could’ve also created a structure based on seasonality because you’d want to prioritize budgets at different times of the year.
By creating and maintaining multiple campaigns, you can change settings in response to promotions, seasonality, and other business factors.
And how can you do this in Optmyzr? You can build a dynamic Performance Max campaign (for retail) structure or a shopping campaign structure with Optmyzr’s Shopping Campaign Builder 2.0.
You can set up how your listing group structure has to look like. For example, say you want to use a custom attribute as your first level of division and one campaign for each different custom label.
This custom label could include your margin data—high margin, low margin, or mid margin. You can also add as much granularity to it as you want. And then as the second level of division, you can create separate asset groups by ‘brand’ which enables you to put in different messaging and creative for each brand that you sell.
And what comes out of it is a split with many campaigns and listing groups that allow you to quickly check what’s new in your product feed and automatically put new products into the correct structure on a daily basis.
P.S. We spoke to two of the best ecommerce experts, Andrew Lolk and Menachem Ani, on PPC Town Hall 71 to learn how to better structure your Performance Max campaigns.
Get actionable PPC tips, strategies, and tactics from industry experts twice a month.
2. Set guardrails with alerts
You can get alerts whenever your Performance Max campaign deviates from the expected performance.
In this example, you can see that we’re saying we’d like to get alerted if the CPC (cost per conversion) is going off target. And here we can see it has gone 135% off target and is currently trending down.
You can also build custom alerts using the Rule Engine.
Setting up alerts like the one above helps us clearly understand what is automation doing to our campaigns.
3. Optimize budget allocation
You can allocate and optimize budgets effectively and achieve the right level of spend for your campaign(s).
If you have multiple accounts associated with a client (say, five accounts on Google Ads, plus one Facebook and one Microsoft account), you can bring all of those together under one client.
And underneath that, you can create budget groups. For instance, you can create a budget group for all of your branded campaigns and non-branded campaigns, and assign different budgets to each of them. Then you can make sure that you don’t exceed the total allocated budget for any of these budget groups.
One of the things we’ve added is budget optimization capability in the Rule Engine. So if you want to build something really custom based on past performance and on your own business data, you can set up a Rule Engine strategy and optimize it automatically.
4. Experiment effectively to find winners faster
Here’s the truth: nobody in PPC knows exactly what the best strategy to win is. But the person who experiments the most effectively is going to win. The way you get to the right strategy is by iterating and experimenting faster and more effectively.
But the problem that we found with experiments is Google makes it really tedious to see how your experiments are doing, which stage they’re in, and so on. And you have to go to multiple accounts and pages within each account to check your experiments.
But Optmyzr can simplify that for you. We bring all of your experiments onto a single dashboard to quickly show you what experiments are working, which ones you can promote, and which ones you should terminate or maybe replace with a new experiment.
We’re going to add more capabilities in the future, but if you haven’t tested it out yet, go and take a look at it today.
5. Stop ads from showing on low-quality placements
You can use our Rule Engine to exclude placements at the account level.
And we also have a brand new tool for that called Smart Exclusion automation. This is an add-on tool. If you want to know more about it, just talk to your Optmyzr account rep.
This tool uses Optmyzr-wide data to prevent you from wasting money on say, some new, random mobile app that’s click-baiting people into clicking on your ads that are wasting a lot of ad spend but are not converting enough.
We can proactively place it in your account based on the Optmyzr-wide data that we see and prevent you from ever wasting money on that sort of clicks. And we’ll even give you a prediction of how much money you can save and then you can decide if you want to turn this feature on or not.
Take back control of your Performance Max campaigns
Performance Max is not 100% automated. You need to provide it with good data and value-focused optimization so that Google clearly understands what it is that your business really wants and what a ’conversion’ means to you.
Nobody understands your business better than you. So why let Google make decisions for you?
I spoke to 4 all-star PPCers to discuss different career journeys including the decision to head out on our own (for those who have started an agency or consultancy). After the call, Harry Makins on Twitter asked a follow-up question that got me thinking more about the difference between starting an agency in 2010 and now.
I think it’s easier and more difficult. If you’ll allow me to ponder on this, I’ll share my musings below and then perhaps we can continue the conversation on Twitter and LinkedIn.
Oh, and one other important thing. Because these are my musings, I might be wrong. So listen to what I have to say, weigh it to determine whether the logic makes sense, then let me know if you see something in the industry that suggests otherwise. I’d love to keep learning too, with your help.
Deal? Let’s get started.
3 Reasons Why Starting a Digital Marketing Agency in 2024 is HARDER Than Ever
Reason #1: The Digital Marketing Space is More Crowded Than Ever.
In 2011, the year I started ZATO, there were 4400 digital ad agencies in the US.
In 2022, there will be 19,800 digital ad agencies in the US. (source)
That doesn’t even include international agency growth that can service the US!
There are so. Many. Agencies out there right now.
Even in my small network, every time I turn around, another friend is announcing their intent to “go it alone” and try this freelancing thing.
So immediately, we recognize that it is harder out there simply because there are literally more agencies than there used to be.
Reason #2: Companies Are Aggressively In-housing Digital Marketing Services.
Another trend I’m seeing lately is the desire to eliminate vendor relationships and move paid media in-house. There are a number of reasons not to be discussed now for going in-house, or going agency with your media.
However, for the sake of this article, there are MORE agencies than ever, and yet MORE businesses are moving their ad buying in-house.
Seriously, while writing this post I ran across yet another DTC person (Patrick Coddou of Get Supply) announcing his move away from using agencies!
Reason #3: The Market Is More Mature & Also More Picky.
One thing I’m seeing personally is that people are savvier than they were a decade ago, and this works its way into many things.
Sales, for instance.
It used to be easier a decade ago to get into a Google Ads account, identify some immediate opportunities, and tell them to a befuddled marketing manager who said some variation of “okay, okay, what do you charge, you’re hired.”
I’ve found it’s not enough just to “know Google Ads better than the next guy” in order to land clients these days (and remember, there are just more agency options out there competing).
I’ve also found accounts we take over tend to be (on average) managed better than they were 5 years ago which makes improving them more challenging than the “glory days” when we could take over a new account in shambles and expect to see immediate results by adding in a few exact match keywords plus ads that actually land the user on the correct landing page (this is a general observation, rather than a prescribed rule, of course. There are still REALLY bad managers out there making bad accounts).
4 Reasons Why Starting a Digital Marketing Agency in 2024 is EASIER Than Ever
Okay, so we ran over some reasons why it’s harder than ever to start a new agency. Is there any good news? Actually, I think there is a lot of good news here!
Read on.
Reason #1: Online Businesses Are Booming.
It’s no secret (normal tech growth followed by a pandemic forcing ecommerce growth) that the newfangled-internet-thing continues to grow as an important part of any business.
Ecommerce sales made up only 5% of retail sales in 2011 (remember, back when the number of agencies was smaller), and in 2021 it has climbed to around 13%. So, while there are more agencies, there is more to manage for those agencies.
What is really mind-boggling to me, is the potential for continued growth here. In 2018 (admittedly, almost 5 years ago, but still) a whopping 46% of small businesses DID NOT EVEN HAVE A WEBSITE. Do you realize how much opportunity there still is in some of these niche markets?!
Reason #2: People Are More Willing to Hire True Experts.
I remember from conversations with prospects 5 years ago, that people wanted “an agency who does it all! We want one point of contact.”
Whereas, lately, our contacts have communicated to us: “we want to hire the best people in each marketing channel to build a super team, like the Traveling Wilburys of marketing.”
I think that shift is really fascinating (and it’s one of the reasons we’ve never had an issue being a Paid Search only agency), as it shows people are now seeing more value in having a truly skilled practitioner rather than in having fewer points of contact.
What this tells me, is that the savvy freelancer will identify an area in which she can become THE true expert, work hard to become that expert, and then attract clients who need that skill set. It’s time to ditch the small agency “we do it all” mentality!
I think the key to survival as a freelancer in 2024 and beyond is being satisfied with niching out (somehow: product, vertical, whatever). This may prevent you from growing into a mega-agency but I am convinced it can help you establish a profitable and stable business built on your network.
Reason #3: People Are Less Likely to Hire Based on “Agency Brand Strength” Alone.
I have to be careful here since I have a lot of respect for smart people I know in large agencies. However, what I have learned lately, is that businesses are less attracted to the “brand strength” that a larger, international agency used to carry simply by walking into the room.
I think this goes hand in hand with clients getting savvier. They want to make sure their account isn’t going to be managed by the interns when they were sold by the professionals.
In this way, I think it’s easier for a skilled freelancer who can sell well AND deliver on that promise, to win bids against larger agencies who used to have a substantial advantage simply because of their name.
Reason #4: Businesses Who Can’t Afford In-House Still Need Help.
Finally, I’m finding that there are certain businesses that simply can’t afford in-housing, even with all of the moves to in-housing that larger brands are making. In other words, there will ALWAYS be businesses that need assistance in various stages.
Rather than try to battle against in-house, I think the savvy freelancer of the future will instead look to those businesses who can’t afford to do in-house, and build a pricing package and work scope that works for both the smaller business and the freelancer.
Oh, and these may tend to be local, and I think the smaller freelancers also have a distinct advantage in that way, by rubbing shoulders with their neighbors.
So there you have it, I think there are concerns about starting a freelance or agency in 2024, but I also think there is a great opportunity. What do you think? Let’s continue the conversation on Social Media!
Optimizing paid search campaigns is essential for any account. When optimizing, the objective is to ensure that the ads reach the right audience at the right moment. Optimization also involves making updates and changes to meet business goals.
I typically follow these steps in sequence, but it’s not always necessary to execute every step during optimization. Often, merely analyzing the data and deciding to refrain from making changes is the best course of action.
Here’s a step-by-step guide on how I optimize paid search campaigns for brands of all sizes:
1. Define clear objectives.
Before diving into optimization, clearly define your goals. Whether it’s boosting website traffic, generating leads, or increasing sales, having distinct objectives will steer your optimization efforts.
In 2024, brands must understand that not all traffic is of the same quality. While traffic campaigns might seem enticing, they can attract visitors who don’t align with a specific goal. Such campaigns can result in minimal conversions and a low return on investment. Instead of merely aiming for higher traffic, brands should focus on campaigns that bring in qualified traffic, ensuring tangible outcomes.
After setting clear objectives, also align with stakeholders on key metrics, such as a CPA goal for lead generation or a ROAS goal for sales accounts or those using value-based bidding.
In one of the larger accounts that I manage the goal is to drive website sales and store visits. For this account, I worked with the team to have brand campaigns optimized towards sales with a ROAS goal. Then the non-brand or category terms are optimized for a store visit.
The reason for the shift in goals is because this product sells better when the customer can have a hands-on sales experience. The account can still result in sales, but the overall account goal and objective shifted based on where the customer was at in their journey.
This is an example of a time when having a clearly defined goal to increase sales translated down to a key optimization in the paid search account.
Have a clearly defined goal
2. Monitor and adjust budget.
Allocate a larger budget to top-performing campaigns and consider cutting or reallocating funds from underperforming ones.
I suggest evaluating campaigns based on spend, performance, and intent when adjusting the budget. Segmenting campaigns by these three categories is vital because intent varies with the keyword. If you overlook the broader objective, you might allocate the entire budget to campaigns that excel in conversions but don’t necessarily foster account growth.
This is especially relevant for brands not fully utilizing their brand traffic. By not exploring non-brand traffic campaigns, brands lose the chance to attract new customers and expand their market share. Hence, over-relying on brand traffic can hinder growth.
This underscores why all optimizations should align with clear objectives.
Adjusting budgets in the accounts I manage is generally something that can be changed 1 time a month, however when I am managing an ecommerce client I will make budget shifts a few times a month to align with promotions and sales.
3. Adjust campaign targets.
High-performing campaigns: Lower CPA/ROAS for campaigns meeting goals or based on business insights, such as significant sales or events like Black Friday/Cyber Monday.
Low-performing campaigns: Consider raising CPA/ROAS targets for these campaigns to bid less aggressively.
With Black Friday/Cyber Monday coming up, I will make changes to ROAS targets throughout the day and weekend as the sales data and conversion data align. If traffic volume is high and the account is converting well lowering the ROAS target allows the account to scale to the demand during tent pole moments.
I often say that during these sale moments in ecommerce, paid search managers know more than the bidding algorithm.
4. Evaluate ad group performance.
Examine each ad group. This step ensures that every ad group aligns with its objectives and yields the best results. Here, I assess metrics to determine which keywords need further scrutiny. I also evaluate the ads since they are at the ad group level.
There are also times when ad groups need to be turned off or on. When I was managing paid search in the auto industry the campaigns were often segmented by new and used. The used car campaigns had to be changed daily as the account might be running keywords for 1 used car only.
When that car sold the ad group needed to be turned off quickly, so the account didn’t waste money on terms for a car make and model that was no longer available. This also could have potentially resulted in a poor customer experience.
5. Optimize ad copy.
In 2024, when refining ad copy, I ensure all headlines and descriptions are utilized. I also assess performance rankings in the platform and replace underperforming assets. Additionally, it’s crucial to ensure no extra assets were inadvertently created by the platform due to campaign settings.
6. Evaluate keyword performance.
The approach for keywords mirrors that of ad groups. If the primary aim is account growth and the CPA/ROAS metrics are within range, I’m less stringent about pausing keywords. However, if keywords are too broad and metrics are off-target, I adjust the match type down to a phrase or exact.
Adjust the match type
Adding negative keywords: Excluding irrelevant keywords that might activate your ads but don’t lead to conversions is vital. This strategy not only saves on advertising costs but also enhances the campaign’s overall performance.
One of the ways that I can find negative keywords in the accounts I manage is to review the search terms report regularly. Another helpful tip is to use the Google Keyword Planner or Google Suggest. This will show you common terms that are searched with your main keyword and you can remove the terms that aren’t relevant.
7. Evaluate ad extensions.
Ad extensions offer additional information and can boost click-through rates (CTR). However, they’re often overlooked. Regularly review extensions to ensure they’re up-to-date and relevant.
For ecommerce brands sales can be updated in the promo extension, or if there is a page with a portion of the inventory on sale, I will go into the account and create a site link and direct traffic to the promotion page.
One important note is that ad extensions can be scheduled to run for certain days. This is helpful for workflow, so you aren’t finding yourself in a situation where you must find and manually turn off all the additional pieces of ads where you have added a limited time frame ad copy.
8. Create relevant landing pages.
Ensure that the landing page you’re directing traffic to is relevant to your ad and provides a seamless user experience. A mismatch can increase bounce rates and decrease conversions.
This is something I will look at quarterly across all accounts I manage. Sometimes brands will make changes to the site and landing pages should be changed for a better experience. Other times campaigns can be going to PDP pages vs category pages and depending on the size of the category the category page has better conversions.
9. Test and refine.
Testing is integral to any optimization process. Regularly conduct A/B tests on headlines, descriptions, and landing pages to pinpoint areas for performance optimizations.
The easiest test to run is the ‘Optimize Text Ads’ experiment. Some ideas for tests are headline swaps as well as landing page tests. In one of the accounts, I was managing the client created a landing page all about the category that was more educational, and we tested that page against the product page (PDP) and learned that the customers needed more information before the purchase. Based on the data the educational product page converted better than the PDP.
Test and refine your ads
10. Segment your audience data.
Many accounts I manage feature hundreds of audiences in observation mode within each campaign. If a campaign underperforms, review its performance data, and consider switching the targeting settings from ‘observation’ to ’target’. While this narrows the campaign’s reach, it effectively refines and then you can gradually expand its scope based on performance.
11. Consider bid strategies.
Depending on the account goals look at the bidding strategy. By targeting a high impression share, you ensure that you’re not missing out on potential visibility opportunities. This is especially crucial for brand campaigns where the goal is often to be seen by as many relevant users as possible.
12. Stay updated.
While this isn’t necessarily an account optimization tip, this will help you optimize your tactics. Paid search platforms, especially Google Ads, frequently update their features and algorithms. Stay updated with the latest trends and best practices to ensure your campaigns remain effective. You can do this by reading blogs like the one you are reading now, watching YouTube videos, and listening to industry podcasts.
13. Seek expert advice.
If you’re unsure about certain aspects of your campaign, consider seeking advice from paid search experts or agencies. They can provide insights and recommendations based on their experience.
In conclusion, optimizing paid search campaigns is a continuous endeavor. Consistent monitoring, testing, and refining are crucial to ensure your campaigns remain effective and achieve the desired outcomes.
And if you need help, give Optmyzr a try.
Not an Optmyzr customer yet? Thousands of advertisers — from small agencies to big brands — around the world use Optmyzr to manage over $5 billion in ad spend every year.
Sign up for our 14-day free trial today to give Optmyzr a try. You will also get the resources you need to get started and more. Our team will also be on hand to answer questions and provide any support we can.
Last quarter, we ran a test with Discovery Ads and “regular” Display campaigns to promote ADworld Experience event registrations. We spent the same budget for about 30 days using the same copy & targeting options. Here’s what we found.
As some of you may already know, ADworld Experience is the largest all-PPC event in Europe. The event’s main target audience is seasoned PPC professionals, who have been operating for some years in Google Ads, Meta Ads, Linkedin, Microsoft, Amazon, TikTok, and other online advertising platforms.
The experiment
The first key question to start the test was: how to effectively target experienced PPC professionals via Google Display channels?
An expressed interest in any advanced PPC tool could be one way to target them.
Creating audiences
So we made a list of the most renowned tools (in alphabetical order): Adalysis, Adspresso, Adroll, Adstage, Adthena, Adzooma, Channable, Clickcease, Clickguard, Clixtell, Datafeedwatch, Feedoptimise, Feedspark, Fraudblocker, Godatafeed, Opteo, Optmyzr, Outbrain, PPCprotect, Producthero, Qwaya, Revealbot, Spyfu, Squared, and Taboola.
Using this list we were able to set up 3 different audiences based on:
1. The PPC tool name searches in Google
2. The PPC tool’s interested users and
3. The users who’ve shown interest in a PPC tool’s website URLs in SERPs.
Campaign setup
Then we created a Discovery campaign and a regular Display campaign, with 3 ad groups each, based on one of the above audiences.
In both campaigns, we excluded optimized targeting (to avoid unwanted overlapping) and limited demographics for users aged between 25 and 55 (the main age range of ADworld Experience participants) + unknown (not to limit too much of the audience).
Campaign goals
The goals were:
Getting registrations for the 2023 event that happened on October 5 & 6,
Sales of past edition video recordings, and
Navigating 5 or more pages in one session (to grant Google’s smart bidding enough conversion data)
Geotargeting was limited to the home countries of the majority of ADworld Experience’s past participants (a selection of EU countries + UK, Serbia, Bosnia, Svizzera, Montenegro, Norway, and Finland). We targeted all languages and scheduled ads to appear every day from 8:00 CET to 20:00 CET.
In Discovery, we accepted Google’s default filter for moderate and highly sensible content. In display campaigns, we excluded all non-classified content, fit for families (= mainly videos for kids on YouTube), all sensible content, and parked domains.
Bid strategy
The bidding strategy was set for both campaigns on Maximize Conversions, not setting (at least initially) any target CPA.
The text and images were almost exactly the same, even if placements were different (GDN for Display and YouTube, Gmail and Discover newsfeed on Android devices for Discovery). We were forced to shorten some headings in display campaigns, but descriptions and images (mainly 2023 speakers’ photos) were exactly the same. In the Display campaign, we were able to select some videos and let auto-optimized ad formats turn on.
The daily budget was 20€ for each campaign (in Discovery the suggested budget was 40€/day, but we launched it and then later lowered it to 20€/day).
In a previous test with Discovery Ads, we found that URL-based ad group/audience was definitely predominant in terms of traffic, so we decided to exclude in that campaign all the tools not directly related to campaign management in the most widespread platforms (Adroll, Adstage, Godatafeed, Outbrain, Qwaya, and Taboola).
Besides that, in both campaigns, we were soon forced to set different target CPAs to grant all different groups/audiences a more uniform distribution of ads, lowering it where traffic spiked and making it higher where it languished.
Both in Discovery and regular Display we had to closely monitor the geographical distribution of the ads to have a more uniform coverage, lowering Max Bids up to -90% in some areas and pushing up to +50% in some other ones (it looks like Romania, Serbia and Bulgaria have a lot of “spammy” placements, while central EU countries offer much more refined and expensive spots, with no relevant differences between the two campaigns).
In regular Display ads, we could exclude low-quality sites and apps, ending up with almost 500 exclusions. We decided not to apply a pre-existing list of spammy/off-topic placements we built from previous campaigns to avoid giving regular Display campaigns an advantage over Discovery since the beginning.
The results
Here are the numbers we had after about 5 weeks and 1,500€ of total expenditure:
Regular Display Campaigns
Discovery Ads
Exposed target CPA are the final ones (reached after several progressive adjustments)
If we look at global conversion numbers, it might seem that Google’s AI-powered placements still have a long way to go before competing with a professionally set Display Ad campaign.
Another interesting thing is the radically different performance of the same audiences in the two campaigns. The audience of past searchers of PPC tools and URL-based targeting have been respectively the best and the worst performers in GDN and… exactly the opposite in Discovery Ads!
You will find another interesting “surprise” when you isolate the same numbers for the last week of both campaigns.
Regular Display Campaigns Final Week
Discovery Ads Final Week
The first and most evident general conclusion is that Discovery AI-powered placements need more data (time/money) to really start auto-optimizing.
The second most obvious conclusion is that if you know exactly what you are doing and need your campaigns to perform soon and to be laser-targeted, old-school display campaigns are still very likely to be your best choice.
The third important consideration is that if your goal is not only to convert but to drive low-cost traffic to your properties, then you should have few doubts about pushing for Discovery Ads.
Drilling a little down into the data, I was really surprised to see how different we’re performing with the same audiences within the two campaigns. We can only suppose that topic searchers’ targeting fits better to lower automation-level campaigns (being the most focused targeting option you may use in Display Network), while probably URL matching gives the Google Machine Learning algorithm more space for auto-optimizing (when a good amount of data becomes available).
In light of recent antitrust lawsuits and scrutiny over its ad business practices, advertisers are becoming more concerned that Google may be wasting their ad budgets in subtle ways. While Google provides a powerful platform for targeting customers, savvy advertisers need to be vigilant to ensure they are getting true value from their ad spend.
With Google controlling the auction dynamics and having full access to advertisers’ account data, it has the means and potential incentive to make advertisers spend more than required.
Advertisers should be aware of areas where Google Ads may subtly lead to inflated spending and take steps to optimize their accounts accordingly. Here are seven causes of inflated ad spend and ways to address the issue.
How Google May Lead Advertisers to Overspend
There are several ways Google encourages advertisers to spend more than intended or extract higher revenues from accounts, such as:
1. Using Broad Match Without Negative Keywords
One of the most powerful targeting capabilities of Google Ads is the ability to use Broad Match keywords. This allows your ad to show up for a wide range of searches related to your keywords, even if the query doesn’t contain the exact keyword.
However, some of these searches could be for more competitive terms that result in much higher cost-per-click (CPC) than expected. Other search terms may be less relevant and while costing less per click, may return poor ROAS due to lower conversion rates.
The solution is to set up a robust list of negative keywords to exclude any searches that are not highly relevant or fail to convert at justified CPCs. Otherwise, a Broad Match keyword that normally costs $1 per click could trigger ads for $5 clicks, quickly inflating your costs.
Optmyzr’s Keyword Lasso, Negative Keyword Finder, and its many prebuilt strategies for Rule Engine can all help advertisers more effectively manage keyword targeting.
When employing a Broad Match approach, it’s best practice to enable Smart Bidding strategies like Target CPA or Target ROAS. With Broad Match, an ad can appear for a wide range of searches with different expected conversion rates. Smart Bidding leverages Google’s machine learning to determine the optimal bid for each variation based on your targets.
For example, it may bid $5 for a commercial query that’s more likely to convert, versus $0.50 for a low-intent query seeking only information. This automatically adjusts bids based on the search to help control CPCs to keep CPA and ROAS within your targets.
By pairing Broad Match and Smart Bidding, advertisers can capitalize on Google’s reach while controlling spending. The combination provides expanded exposure at optimized CPCs tailored to each search query.
3. Changing Budgets Too Frequently
Google will cap your total monthly ad spend based on the daily budgets you set multiplied by the average number of days in a month. If you frequently change your daily budgets, the system will add up all those temporary budget levels over the month.
Google may also overdeliver on any day because it expects traffic on other days to be lower.
There are good reasons why advertisers may change budgets frequently — for example, in response to short-term offers, or changes in inventory and the accompanying changes in spend prioritization.
This means your actual monthly spend could far exceed the level you intended. And knowing how much you may be on the hook for can get very confusing when you change budgets throughout the month.
It is recommended that advertisers use automated tools like Optmyzr’s budget management features to ensure that Google doesn’t exceed your true budget. For example, by optimizing budgets throughout the month, while resting assured that campaigns will be paused for the remainder of a budget period when your ad budget has been exhausted.
Tools like Optmyzr even allow you to deploy flighted budgets that are not bound to the first and last days of a calendar month.
4. Ignoring Quality Score
Your ad’s Quality Score is a major factor that Google uses in determining your cost-per-click in the auction. Quality Score is influenced by expected click-through rate, ad relevance, landing page experience, and other factors. The higher your Quality Score, the lower your CPC for the same ad position.
Optimizing factors like landing page speed, ad copy, keywords, and extensions can improve Quality Score. But if you ignore it, CPCs will be higher than necessary to maintain your position, needlessly inflating your costs.
Optmyzr’s Quality Score tool helps you monitor for changes and identify opportunities for improvement by breaking out low-Quality Score keywords into new ad groups, where you can add a more relevant ad and landing page.
5. Turning On Auto-Applied Recommendations
Google Ads offers optimizations called auto-apply recommendations that it can apply automatically to your account (with your consent). These are based on its analysis of potential “headroom” to increase conversions. However, Google’s algorithm may not have a full understanding of your true conversion value.
For example, if you run a B2B lead gen campaign but only track form submissions as conversions, the system does not know the downstream value of a lead. Google may ramp up spend while chasing unqualified leads.
Advertisers should connect Google to their CRM data and review recommendations from Google manually to focus on true conversion value.
Optmyzr’s Rule Engine can connect your PPC campaigns to your business data and a variety of different conversion goals, so that you’re always in charge of determining what should be automatically changed and when.
The majority of Optmyzr’s optimization suggestions are calculated using our own algorithms that prioritize advertiser results over Google profits. But we also use a handful of Google’s optimization suggestions as the basis for further analysis.
For example, where Google recommends raising a budget to capture more conversions, Optmyzr applies an additional layer of logic to predict the incremental cost of those new conversions. Only if that cost is reasonable do our tools recommend increasing the budget.
6. Not Tracking High-Value Conversions
Similarly, if you do not properly track high-value conversions beyond simple form submissions, Google will optimize purely for form submissions. The system bases spend on whichever conversion you specify, so you need to make sure it reflects your actual desired outcome.
For a B2B company, that may require tracking CRM data on closed sales attached to converted leads. For ecommerce, connect your back-end order data.
This focuses Google’s algorithms on your real goals versus whatever limited conversion you happened to initially set up tracking for in your account.
When you use an independent third-party PPC tool like Optmyzr, you can connect your business data without that data flowing to Google. Use Optmyzr to create rules and logic with your business data, and then send only the resulting Target ROAS and Target CPA to guide Google in how it treats your ads in its auctions.
7. Using the Display Network, Performance Max, and YouTube Without Excluding Placements
A major mistake advertisers make is not proactively excluding unwanted placements in the Google Display Network, which has long faced quality control concerns from more advanced practitioners.
By default, your Display ads can run across millions of websites, videos, and apps that Google partners with for its Display network. However, many of these sites may be irrelevant to your offer or have very poor conversion rates.
Savvy advertisers will use placement exclusions to restrict Display ads only to highly relevant sites that have been proven to generate conversions. Otherwise, your budget gets wasted as Google serves your ads across its vast Display network to meet your daily budget.
How to Optimize Spending With Google Ads
Given Google’s incentives and control, PPC advertisers must take smart steps to ensure their budgets drive true value and performance. Some of these solutions include:
1. Use Independent Optimization Tools
Google Ads and the Google Ads Editor let you do a lot to optimize your ads, but they still have a number of issues related to convenience, sharing of data, and managing large numbers of accounts in little time.
Consider PPC management software like Optmyzr that can connect to your Google Ads accounts, but also integrate broader business data. This allows you to optimize bid strategies based on profitability metrics and other data, without fully exposing it to Google.
Advertisers get the benefit of Google’s targeting power but use independent tools to set optimal bids and targets based on their confidential business data. Google sees the optimal bids and targets — not your proprietary data driving it.
Third-party tools (particularly Optmyzr) also provide a high degree of support that advertisers typically crave then they regularly deal with long waits for Google’s support tickets and pushy reps.
2. Refine Tracking for True Conversions
As discussed above, advertisers need to look beyond basic form submissions and make sure they’re tracking true conversion KPIs in their accounts. This may require linking CRM data on lead quality or closed deals back to clicks and conversions.
Ecommerce advertisers can adjust conversion values to exclude returns or account for bundles/subscriptions to offer Google a more complete picture of the value they get from ads.
3. Actively Manage Quality Score
Don’t just set it and forget it when it comes to Quality Score. Actively monitor scores for keywords, ads, and landing pages. Test changes to copy, headlines, ad extensions, site speed, etc. to maintain optimal scores that minimize CPCs.
Quality Scores can suffer without ongoing optimization, so you end up paying more for the same results. So think of Quality Score management as a constant optimization loop.
Conclusion
In today’s complex digital advertising ecosystem, maximizing return on ad spend ultimately comes down to the advertiser’s savvy. While Google provides incredibly powerful targeting capabilities, its incentives may not fully align with advertisers’ need to get the highest value from their budgets.
By understanding areas where Google may cause advertisers to overspend, focusing optimization on true conversion metrics, using independent tools like Optmyzr, and constantly honing quality, advertisers can fulfill the promise of pay-per-click advertising.
With the right optimization approach, Google Ads can deliver phenomenal ROI. But it requires an expert human touch to ensure subtle factors don’t lead to wasted spend.
Retargeting is an advertising technique for reaching out to your previous website visitors. Paid search, social media, and email marketing channels let brands and other advertisers create retargeting campaigns.
However, it also requires browser cookies enabled from the user’s side. Advertisers can identify user behavior with the help of a unique code courtesy of browser cookies. Tracking user behavior and seeing whether they complete the call to action determines whether to retarget that user.
For example, if somebody abandons a shopping cart, a retargeting ad functions as a reminder mechanism to complete the transaction.
Benefits of Retargeting
Retargeting campaigns would not be so prominent without the multiple benefits they bring. According to FinancesOnline, about 70% of marketers rely on retargeting to raise brand awareness. Other benefits include:
Increased conversion rates
Reduced shopping cart abandonment
Cross-selling and upselling opportunities
Better customer engagement and retention
According to a survey by the Interactive Advertising Bureau, 92% of marketers found retargeting to outperform search, email, and display advertising.
Overall, retargeting is a valuable technique to grow your revenue, but the question is how to make the most out of it.
Here are 7 retargeting strategies that should push you in the right direction.
7 Proven Retargeting Strategies
1. Focus on the Copy Rather Than the Image.
Let’s start with the copy. If you look through various ads on different channels, brands aim to prioritize assets users are familiar with, such as logos and slogans.
Taking this approach with retargeting ads doesn’t make a lot of sense. After all, your targeted audience is already familiar with the brand. These people visited your site but did not complete the transaction.
Instead of the visuals, focus on the copy. Determine the customer hesitations and build a tailor-made ad to address these hesitations.
It helps you find ads that meet your business goals or contribute to the success of your advertising campaign, pause underperforming ads, and create new ones to continue testing.
The tool also recommends high-performing headlines, description lines, and display URLs (from your best-performing ads) to create new ads in the ad groups where you are pausing ads with a lower performance.
Online shoppers have an easy time comparing product prices to get the best deal. Bouncing from one site to another is not even necessary, as you can simply install a price checker extension on your browser.
The odds are that prospective customers did not complete a purchase because they believed that they could find a better deal. Leaving a site once is enough to potentially lose a user. And not because they could find a more appealing offer but also because of various distractions, making them forget about visiting your website in the first place.
Why not sweeten the deal in your retargeting ad by proclaiming that you offer a special discount? That’s bound to get people’s attention, especially if they showed interest early on. A simple incentive can be the difference-maker you were looking for.
3. Add FOMO.
The fear of missing out urges consumers to take action. Even if somebody doesn’t really need goods or services, they might change their mind if a last-minute offer appears on their feed.
The tried and true FOMO tactic combined with buzz phrases like “the clock is ticking” or “book now and save 50% off before the offer expires” can get people’s attention.
Many brands also highlight bestsellers and show stock levels. “Only 3 left in stock” is one way to highlight scarcity. As is running a limited offer, as is shown in the example below:
For retargeting campaigns, FOMO is particularly effective. You are reaching out to a consumer who was interested before, and giving them that push is bound to improve your conversion rates.
4. Remind Buyers Why They Chose You.
Customer retention is a priority because happy shoppers are returning shoppers. If they trust the brand, persuading them to continue spending money on your business is easier than persuading new customers.
Remind the audience why they should return. For instance, if you sell MacBook accessories and help users with creating bootable USB on Mac or solving Bluetooth problems with earpods, focus on these benefits as your selling points.
Fashion brands are another example. Whenever a collection is out, notify the customers and encourage them to browse new goods.
Finally, for recurring service businesses, retargeting ads could revolve around reminders to book an appointment.
5. Polish Your Call to Action.
Your call to action entices potential customers to lose their hesitation and commit. A good CTA button is:
Action-oriented
Short
Legible
Creates urgency
Previously covered discount and FOMO tactics shape the CTA copy, but one should also understand the importance of designing and presenting the offer visually.
Bright and clear colors and enough white space are the basics of designing graphics for your retargeting ads. However, if the ad has multiple elements, it is crucial to establish a clear hierarchy and push the call to action in the front.
6. Test Different Times.
Retargeting ad engagement rate is similar to social media content engagement in the sense that the time of displaying the ad determines how much traction it gets.
It takes a while to test different time frames to gain enough data for conclusive results, but it is a necessary step to create a successful retargeting campaign.
Some marketers lose motivation when their early retargeting efforts lead nowhere. They fail to recognize that changing the ad display time is enough to boost engagement.
7. Track Your Ad Data.
Determining the best time to display your ads is just one part of the data you need to collect. Retargeting marketing is complex, and those in charge of the campaign have to go through trial and error to gain insightful details and improve the results.
Color psychology in the visuals, the copy, target demographics, locations, and everything else you can think of that goes into the retargeting market to maximize the effectiveness of the campaign.
Multiple tools exist to track different information, so you do not have to worry about keeping tabs on everything manually.
Also, expect to make adjustments to keep up with ever-changing digital landscape trends. Failing to do that means ineffective usage of available resources and falling behind competitors who are more efficient than you.
It’s easier to convert returning visitors than new visitors.
To sum it all up, retargeting ads have a fair few benefits, and they should be utilized more. At the end of the day, returning customers are easier to please than new potential leads.
That is not to say that businesses should abandon the idea of attracting fresh customers. It’s just that when done right, retargeting ads is less of a hassle.
And if you need help, Optmyzr makes it easier to showcase the value of your campaigns.
Not an Optmyzr customer yet? Thousands of advertisers — from small agencies to big brands — around the world use Optmyzr to manage over $5 billion in ad spend every year.
Sign up for our 14-day free trial today to give Optmyzr a try. You will also get the resources you need to get started and more. Our team will also be on hand to answer questions and provide any support we can.
It is hard to change a strategic perspective. We form our ideas on the world based on data and inferring causation and correlation. Acknowledging that an outcome is no longer viable means that either the circumstances changed or the logic wasn’t sound. Both are uncomfortable.
We’re going to dive into a lot of data in this post and I’m also going to outline my old perspective and how I got there.
An important disclaimer: Just because this post looks at a lot of data and there is a high probability that one path is correct, it does not mean that the other path is outright incorrect.
It simply means that there is a significantly lower probability that you will see the profit and victory your brand deserves going with the “loser” in the data.
Our conclusion, up front
This is a really long post. So, for the sake of time, here’s a TL;DR of the study we conducted.
We analyzed 2637 accounts, conducting a study to explore the effectiveness of Broad Match vs. Exact Match. Due to how closely tied Smart Bidding and Broad Match are, we also analyzed Maximize Conversions and Maximize Conversion Value (1334 accounts). Key findings include:
Broad vs. Exact Match
Exact Match outperformed Broad Match in terms of CPC, CTR, CPA, ROAS, and conversion rate for the majority of accounts.
Conversion-oriented metrics like CPA and ROAS favored Exact Match.
Both conversion volume and click volume were better with Exact Match. Conversion value was flat between both match types.
The data suggests not making drastic changes if Broad Match is already performing well but considering testing for potential benefits.
Maximize Conversions vs. Maximize Conversion Value
Maximize Conversion Value performed better in terms of CPC, CTR, CPA, and ROAS for most accounts.
Max Conversion Value had cheaper CPC, possibly due to bid caps and practical ROAS goals.
CPA was generally better with Max Conversion Value, challenging the belief that higher CPA can lead to higher-value customers.
The data also recommends using Max Conversion Value and determining conversion value based on customer value and channel conversion rates.
Takeaways:
Test your assumptions and don’t take conventional wisdom for granted.
Keep evaluating your accounts and bidding strategies to optimize costs and performance.
Only test Broad if you go in with protections in place and have budgeted for data acquisition.
My original point of view
I strongly supported Broad Match for a long time and would defend the match type in posts that attacked it. I did this for the following reasons:
The pragmatist in me could see that match types as a mechanic were not really as powerful as they had been (or so I thought). Rather than fighting the current, it made more sense to just make the best with Broad Match.
Broad Match would often provide Phrase and Exact Match “matched by” in the search terms report, so there was no reason to pay the perceived premium for Exact Match if we could get it with Broad Match.
Broad Match was enhanced to include audiences that otherwise would not be included unless Smart Bidding was selected.
I strongly favored Max Conversion Value because it leans in to how ad channel algorithms function. However, I would often recommend Max Conversions because setting ROAS goals and customer values represented a struggle for lead generation accounts.
I hate DKI (dynamic keyword insertion) because the syntax ends up being weird and was a strong believer in pinning creative.
DKI would force keywords into ads regardless of whether it would sound “correct”.
DKI often gets paired with formulaic ads that don’t speak to the prospect in a meaningful way.
The Details of The Study
We wanted to make sure the data would be as clean as possible so set some pretty strict criteria for accounts we would include in the study.
We went through four different versions of the data and questioned the outcomes to make sure we could confidently stand behind the data.
Here are the considerations we factored in:
Accounts had to have both things we were comparing (Broad and Exact, Max Conversions and Max Conversion Value).
Accounts had to have at least 90 days of spend data at the start point of the analysis (we looked at Q1 of 2023).
Accounts could be any vertical and any spend level. However, outliers (accounts spending more than $5 million per month and accounts that had periods of no spend) were excluded from the study.
Data looks at the following: which thing had more accounts that did better with the mechanic in question, as well as what was the improvement over the other mechanic.
In the Broad vs. Exact Match study, we had 2637 accounts that met the criteria. These accounts come from all over the globe and vary in vertical and spend; 1402 accounts exceeded $10K per month. Additionally, 1235 accounts had less than $10K per month in spend.
When examining Max Conversions vs. Max Conversion Value, we had 1334 accounts that met the criteria. They were a mix of including and not including goals for tCPA and tROAS.
We first wanted to look at overall performance and performance gains. It’s important to note that Optmyzr customers tend to be more advanced than the average advertiser, which means we are taking it as a given that the accounts on the whole will have healthy account structures.
We do not enforce a particular structure on our customers, so there will be a mix of all account structures in the data set. All comparisons are looking at how Broad compared to Exact within the same account.
Overall Data
For Cost Per Click (CPC):
56.55% of accounts performed better with EXACT, and the median percentage difference is 77.96%.
27.34% of accounts performed better with BROAD, and the median percentage difference is 36.96%.
For Click-Through Rate (CTR):
85.65% of accounts performed better with EXACT, and the median percentage difference is 84%.
13.88% of accounts performed better with BROAD, and the median percentage difference is 36%.
For Cost Per Action (CPA):
70.79% of accounts performed better with EXACT, and the median percentage difference is 100.71%.
27.48% of accounts performed better with BROAD, and the median percentage difference is 52.52%.
For Conversion Value/Cost:
64.12% of accounts performed better with EXACT, and the median percentage difference is 122.40%.
19.91% of accounts performed better with BROAD, and the median percentage difference is 79.87%.
For Return On Ad Spend (ROAS):
72.52% of accounts performed better with EXACT, and the median percentage difference is 113.47%.
26.47% of accounts performed better with BROAD, and the median percentage difference is 64.71%.
For Conversion Rate (CVR):
56.73% of accounts performed better with EXACT, and the median percentage difference is 68.63%.
22.72% of accounts performed better with BROAD, and the median percentage difference is 50.12%.
We can see that the majority of the accounts perform better with Exact Match, and the median percentage difference is also better for those users that performed better with Exact Match.
For accounts spending over $10,000:
There were a total of 1402 accounts.
76.03% of the accounts present had better ROAS with EXACT match. 22.54% had better ROAS with BROAD match. 1.43% had no difference.
74.61% of the accounts had better CPA with EXACT match. 24.54% had better CPA with BROAD match. 0.86% had no difference.
57.49% of the accounts had better CPC with EXACT match. 29.24% had better CPC with BROAD match. 13.27% had no difference.
88.23% of the accounts had better CTR with EXACT match. 11.34% had better CTR with BROAD match. 0.43% had no difference.
66.98% of the accounts had better Conversion Value/Cost with EXACT match. 16.98% had better Conversion Value/Cost with BROAD match. 16.05% had no difference.
57.20% of the accounts had better Conversion Rate with EXACT match. 17.76% had better ROAS with BROAD match. 25.04% had no difference.
For accounts spending less than $10,000:
There were a total of 1235 accounts.
69.07% of the accounts present had better ROAS with EXACT match. 30.36% had better ROAS with BROAD match. 0.57% had no difference.
67.21% of the accounts had better CPA with EXACT match. 30.04% had better CPA with BROAD match. 2.75% had no difference.
55.71% of the accounts had better CPC with EXACT match. 24.45% had better CPC with BROAD match. 19.84% had no difference.
83.00% of the accounts had better CTR with EXACT match. 16.44% had better CTR with BROAD match. 0.57% had no difference.
61.78% of the accounts had better Conversion Value/Cost with EXACT match. 23.00% had better Conversion Value/Cost with BROAD match. 15.22% had no difference.
56.36% of the accounts had better Conversion Rate with EXACT match. 27.53% had better ROAS with BROAD match. 16.11% had no difference.
The number of accounts using Exact Match wins irrespective of whether or not their spend is over $10,000. But we can see a slight drop in percentages of accounts that had better metrics with Exact Match for those who spend below $10,000.
Spend may not be the biggest factor at play here, but it does affect the numbers slightly.
Does the data translate over to the volume of conversions or other KPIs?
While we can’t show the average volume of the individual metrics (because of the amount of variables in each account), we can show which account had a higher percentage of the volume within the same account.
For Clicks:
51.28% of the accounts performed better with EXACT, and the median percentage difference is 113.36%.
48.56% of the accounts performed better with BROAD, and the median percentage difference is 115.06%.
For Conversions:
50.32% of the accounts performed better with EXACT, and the median percentage difference is 131.82%.
47.26% of the accounts performed better with BROAD, and the median percentage difference is 130.37%.
For Conversion Value:
52.09% of the accounts performed better with EXACT, and the median percentage difference is 158.10%.
47.29% of the accounts performed better with BROAD, and the median percentage difference is 161.27%.
For Cost:
49.30% of the accounts performed better with EXACT, and the median percentage difference is 99.37%.
50.36% of the accounts performed better with BROAD, and the median percentage difference is 104.31%.
For Interactions:
51.28% of the accounts performed better with EXACT, and the median percentage difference is 113.16%.
48.56% of the accounts performed better with BROAD, and the median percentage difference is 115.06%.
For Impressions:
47.11% of the accounts performed better with EXACT, and the median percentage difference is 111.38%.
52.89% of the accounts performed better with BROAD, and the median percentage difference is 103.46%.
Broad performs a hair better than exact in terms of cost and impressions. Exact performs in every other metric. However, the difference doesn’t seem to be too large. In terms of magnitude, Broad is better in every case except impressions and conversions.
Breaking down each metric and its respective findings
Average CPC
I was genuinely surprised that Broad Match lost to Exact in terms of auction price. There are a few reasons for this:
An assumption is that Google would give Broad Match preferential treatment in the auction and therefore discounted rates. While this ended up being incorrect, it is worth noting that this category was one of the closer ones between Broad and Exact. As such, I’m not surprised that some advertisers will still see better CPCs on Broad than on Exact.
Broad Match tends to have an assumption about it that it will be lower quality, so I thought the human element of bidding down would come into play.
What I didn’t think about until the data came in was how many accounts would be on manual bidding vs. Smart Bidding. Ironically, the enhancements to Broad (e.g. improved audiences) may have made the algorithm bid more than it should have on Broad, while Exact picked up the cheaper rates. This is pure speculation and I would have no way of proving it, but it is an interesting idea.
Average CPC tends to be higher for higher quality leads (or so we’ve been conditioned to believe).
The revelation that Google had been raising the CPC floor by 5%-10% is just enough to bridge the gap between what savings we would expect from Broad vs. Exact. It’s possible if we had run this study a few years ago, the difference in CPC would have been much wider.
The big takeaway from this data point (especially looking at how close low and high spending accounts are) is that you can’t use Broad Match for discounted clicks anymore.
If you use it, you’re using it to gather data on what you should be investing in (and potentially which terms to add as negatives to your account).
CTR (Click-Through Rate)
I don’t think anyone was surprised to see Broad Match had a worse CTR than Exact Match. Broad Match by its very nature is going to expose itself to more queries and therefore be predisposed to lower CTR.
CPA (Cost Per Action)
This is another “not that surprised” category. However, there’s a bit more to dig into here than CTR.
One of the assumptions I and the Optmyzr data team made when we were going through the data is that anything conversion-oriented would be flawed. This was a big reason we only looked at performance in relation to individual accounts and aggregated those results.
However what I was surprised by is how Exact Match did 100% better than Broad when it was the winner, yet Broad Match did 50% better than Exact.
I have a few thoughts on why this might be:
The sophistication of advertisers can mean they know to set more realistic CPA goals as well as budgets to help the campaigns achieve those goals. This likely contributes to why Broad Match advertisers who did well, saw the respectable average of 50% improvement over Exact.
CPA is tied to which conversion actions are considered primary and secondary. While this data set looks at Q1 2023 (before the summer 2023 glitch where advertisers saw new conversion actions being created in their accounts in the migration away from UA), it still is in the sphere of influence. As advertisers were migrating to GA4, it is 100% possible that extra conversion actions could have been factored in.
Because we looked at performance within the accounts, these potential errors/glitches would have been baked in and accounted for. This is more in reference to why the numbers aren’t completely one-sided.
ROAS (Return on Ad Spend)
Similarly to CPA, there is a certain degree of human error baked into anything conversion-related. However, unlike CPA, this metric is very one-sided favoring Exact (even in accounts with less than $10,000 in ad spend).
I was not expecting this to be true due to the perceived hesitation to adopt customer values and value-based bidding. I was expecting this to lead to reduced ROAS adoption.
If anything, this is a great testament to the value of ROAS and value-based bidding because Exact Match would be operating from a perceived point of weakness (lacking the enhancements of Broad Match).
CVR (Conversion Rate)
While this metric feels like CTR, it’s a little less obvious that Exact would win over Broad. There are a few reasons for that:
Given how much audiences factor into Broad match, there’s an assumption that the conversion rates would have been closer. Additionally, since Exact match got more clicks/interactions than Broad on average, it’s reasonable to expect the conversion rate would be lower because of more leads in the pool.
Conversion rates are very much dependent on the ad copy and the landing page. I would have expected both match types to struggle or be closer if ad copy/landing pages were a problem, however Exact clearly won.
Match-Type Action Plan
This is not the time to make drastic changes in accounts if things are working for you. If your account is currently running Broad Match and doing well, do not feel you need to pause those winning keywords.
However, if you’ve been considering “upgrading” to Broad, it’s worthwhile to take a pause and consider whether your account will benefit from the test.
If you do decide to test, make sure you pause your existing keywords and add the Broad Match variants manually. If you remove a keyword, you can’t get it back and you’ll likely want to have the ability to backtrack if you don’t like how broad behaved.
Optmyzr does not have a single “recommended” account structure as we see our customers succeed with different strategies. However, one fairly universal theme is that if you run match-type campaigns/ad groups you will likely get hit with impression share lost due to rank and budget.
Consider consolidating these so that you can have fewer but stronger ad groups and campaigns. Again, there is no conclusive “winning” structure. However, if you’re struggling with impression share, that’s a way to mitigate it.
Finally, there is no data to suggest (quite the opposite) that Performance Max is bad. I’d strongly recommend reallocating any paused Broad Match budget into Performance Max. Absolutely use the search themes in Performance Max to help focus those campaigns.
Which does better: Maximize Conversions or Maximize Conversion Value?
We did not include manual bidding in this analysis. However, it is worth noting that 12% of Optmyzr customers currently use manual bidding, while 66% use some form of Smart Bidding (Max Conversions or Max Conversion Value). We attribute this in large part to the heavy adoption of Performance Max, as well as the average size of Optmyzr customers (we tend to focus on $10,000 or higher monthly ad spend).
Overall Data
For CPC:
44.98% of accounts performed better with Maximize Conversion Value, and the median percentage difference is 64.30%.
36.73% of accounts performed better with Maximize Conversion, and the median percentage difference is 60.61%.
For CTR:
52.02% of accounts performed better with Maximize Conversion Value, and the median percentage difference is 62.43%.
46.48 accounts performed better with Maximize Conversion, and the median percentage difference is 51.15%.
For CPA:
52.55% of accounts performed better with Maximize Conversion Value, and the median percentage difference is 86.29%.
46.40% of accounts performed better with Maximize Conversion, and the median percentage difference is 81.04%.
For ROAS:
60.19% of accounts performed better with Maximize Conversion Value, and the median percentage difference is 107%.
39.58% of accounts performed better with Maximize Conversion Value, and the median percentage difference is 91.31%.
When we compared all the accounts the majority performed better with Maximize Conversion Value and the median percentage gains were better as well.
The 645 accounts with over $10,000 spend in Search
For CPC:
46.67% of accounts had better CPC with Maximize Conversion Value, 36.9% had better CPC with Maximize Conversion
For CTR:
52.09% of accounts had better CTR with Maximize Conversion Value, and 45.74% had better CTR with Maximize Conversion
For CPA:
53.18% of accounts had better CPA with Maximize Conversion Value, 46% had better CPA with Maximize Conversion
For ROAS:
63.26% of accounts had better ROAS with Maximize Conversion Value, 36.4% had better ROAS with Maximize Conversion
The 662 accounts with under $10,000 spend in Search campaigns
For CPC:
43.50% of accounts had better CPC with Maximize Conversion Value, 36.86% had better CPC with Maximize Conversion
For CTR:
52.57% of accounts had better CTR with Maximize Conversion Value, and 46.53% had better CTR with Maximize Conversion
For CPA:
51.81% of accounts had better CPA with Maximize Conversion Value, 46.83% had better CPA with Maximize Conversion
For ROAS:
57.4% of accounts had better ROAS with Maximize Conversion Value, 42.45% had better ROAS with Maximize Conversion
Spend did not impact Max Conversion Value winning and there was very little change in performance looking at accounts that had over $10,000 vs. less than $10,000 in monthly ad spend.
Breaking Down Each Metric
Average CPC
The biggest surprise for me was that Max Conversion Value had the better (cheaper) CPC because it runs counter to what we know of how the algorithm bids. Traditionally we’d expect the algorithm to bid more aggressively for a lead that would have a higher probability of meeting the objective (conversion value goal).
That Max Conversion Value had the cheaper CPC implies the following:
The ROAS goals were more practical than I tend to give folks credit for, so the algorithm didn’t spike bids as much as they might have otherwise. This speaks to the data source and the higher probability that Optmyzr customers will manage their accounts at a higher level.
Bid floors are leveling the playing field so those who are using value-based bidding are getting access to a “smarter” algorithm.
The main takeaway here is that advertisers should not default to thinking cheaper is inherently worse, however getting discounts on clicks is much more about giving data to the algorithm than having a perfect quality score.
CTR
I was not terribly surprised that CTR would be better with conversion value because if an advertiser takes the time to put in conversion values, they likely will put more effort into message mapping creative.
That said, both were close, which implies that it’s more on the human running the campaigns as opposed to the bidding strategy directly influencing the CTR.
CPA
To be honest, I was expecting Max Conversion Value to have a worse CPA because we’ve been trained to believe that CPA can be higher to get higher value customers. However that it had the cheaper CPA overall is more of a wake-up call than anything not to get complacent on CPAs.
It is worth noting higher spending accounts did slightly better with CPA than lower spending accounts (but ultimately it was negligible).
If you’re struggling with your CPA, consider whether you’re asking your budget to do too many things or if the campaign can get enough clicks in the day to lead to conversions. Both those mechanics can influence CPAs being artificially high.
ROAS
It should not come as a surprise that the majority of Max Conversion Value campaigns did better than Max Conversions on ROAS. What is interesting is that there were accounts that saw better ROAS using Max Conversions.
I have a few theories on this:
Some brands are not allowed to use conventional conversions and it’s possible that in those accounts max conversions can do better than ROAS simply because users will represent more than one conversion (and the advertiser intends this).
Max Conversions might have been in older campaigns which would be predisposed to do well.
It’s important to note that we did not include conversion rate in the data because it was essentially the same.
Bidding Strategy Action Plan
There is no good reason not to use Max Conversion Value. Hiding behind a lack of clear customer value is just giving your competitors the chance to overtake you.
When determining your conversion value the best way to do it is to consider your average customer value against the conversion rate of each channel. If you’re unsure what the average would be, you can start with a minimum SQL (sales-qualified lead) or minimum subscription price. While this won’t be perfectly accurate, it will give you a place to start.
My new outlook
The biggest takeaway from looking at the data is not taking anything for granted. Just because we’re told something is true, it’s important to test and prove whether it’s viable in our accounts before committing to it or discarding it.
Additionally, given that the conventional wisdom—that Exact Match and Max Conversion Values are more expensive because they provide more value—didn’t play out at scale, it’s worth doing a deep dive into your accounts if they are driving up your costs.
Consider being more aggressive with negatives and exclusions, as well as owning whether you have the budget to go after desired transactional traffic or if you’d be better served leveraging your budgets on cheaper networks (Microsoft) or top of the funnel (Performance Max, social, video).
We’re very grateful to our customers for allowing us to enable them on the path to profit and victory and it means a lot to get to continue to empower them through automation and freedom of structure.
And if you aren’t an Optmyzr customer, but need help with running more profitable campaigns, sign up for our 14-day free trial today to give our tools a try.
Thousands of advertisers — from small agencies to big brands — around the world use Optmyzr to manage over $5 billion in ad spend every year. You will also get the resources you need to get started and more. Our team will also be on hand to answer questions and provide any support we can.
Google is currently on trial for antitrust allegations from the US Justice Department, and Google employees have acknowledged what we’ve long known about how the ad auction works: Google controls the pricing — and sometimes raises auction minimums.
Here’s a rundown of just how Google controls auction pricing and what advertisers can do to protect their own interests.
Antitrust Trial: How Google Controls Advertising Costs
The trial has focused on Google allegedly using exclusionary tactics to maintain its dominance as the world’s leading search engine. But the US Justice Department is also making the case that Google has monopolistic power over search advertising as a specific industry.
Search ads make up the bulk of Google’s massive revenue, so how Google runs these auctions has become a point of scrutiny.
Ads May Be Promoted Out of Order to Boost Revenue
During the trial, a Google executive shared that the company frequently tweaks its ad auctions in ways that can raise prices for advertisers. One method is out-of-order ad promotion, where a lower-ranked ad gets promoted above a higher-ranked ad. This allows Google to generate more revenue by showing ads in locations with higher minimum prices.
In the ad auction, Google ranks all the eligible ads competing for each ad position on the search engine results page (SERP). The highest-ranked ad usually occupies the most prominent top position.
However, sometimes the top-ranked ad may be ineligible to show in that top spot due to certain rules Google has, even though it won the top rank. For example, Google may require ads in the top position to meet certain editorial or relevance standards that the top ad does not fulfill.
In this case, rather than leave the top spot empty, Google will do an out-of-order promotion. This means they will take the next highest-ranking eligible ad and promote it out of order above the ineligible top ad.
So if ad one ranks highest in the auction but cannot show in the top position, ad two (which ranked second) may get promoted to the top spot ahead of ad one. This allows Google to still show a relevant ad in the most visible placement, while adhering to their eligibility rules.
The key takeaway is that out-of-order promotion allows lower-ranked ads to jump ahead of higher-ranked ads when those top ads break rules about where they can appear on the SERP. It ensures Google can serve ads on premium real estate while enforcing editorial or relevance guidelines.
This helps Google make more money and is beneficial to advertisers because lower-ranked ads aren’t artificially held back by editorial or other issues with higher ranked ads.
Google Ads Auction Has Reserve Prices and Thresholds
The other technique Google deploys to improve its revenue is changing auction thresholds and reserve minimum pricing. Over time, this can increase the cost for advertisers to maintain an ad’s position.
The auction minimum CPM is the lowest amount an advertiser must pay to have their ad shown in a particular ad slot. The corresponding minimum CPC bid is determined by a combination of the auction reserve price and the Quality Score of each ad. Quality Score itself is based on factors like expected clickthrough rate and ad relevance.
Remember that Ad Rank is effectively the equivalent of CPM because in simple terms, Ad Rank is predicted CTR multiplied by CPC, which is predicted CPM.
When Google asks for a minimum CPM to show an ad in a particular location, and that ad’s predicted CTR is a static value determined by AI, the only lever the advertiser can control is their bid. So long as there is headroom with their maximum CPC, Google can raise the effective CPC to meet the new CPM threshold.
How Reserve Prices Raise Auction Prices
If Google increases an auction’s minimum bid, it raises the floor price to get into the auction. Advertisers who previously met the minimum bid at lower CPCs now have to bid higher just to participate and have a chance to show their ads.
So when the auction floor is raised, the only variable that can instantly change is the effective CPC. And so long as that effective CPC is below the maximum CPC, the automated auction can collect a higher cost for the click.
This not only increases costs for advertisers who were bidding near the floor price, but it can also raise costs across the board. Even advertisers who were bidding well above the minimum previously may see their costs go up.
Here’s why: In the auction, the top ad position goes to the highest bidder. When the minimum bid goes up, advertisers bidding near that level must increase their bids to participate. This then bumps up the amounts that slightly higher bidders need to pay to maintain their ad positions. Essentially it has a cascading effect across all bids.
So while the advertisers most impacted are those near the auction minimum, an increase to the minimum bid lifts the overall cost of entry and makes the auction more expensive for everyone. It raises the bar across the board in terms of the bids required to capture various ad positions on the page.
How to Safeguard Against Google’s Black Box of CPC Inflation
As we learned from testimony at the trial, these tactics are sometimes implemented to help Google meet financial targets. More importantly, Google does not notify advertisers when these pricing changes occur.
This may leave advertisers believing their optimizations were counterproductive and led to increased costs, when it was an external factor outside of advertisers’ control that caused the change in price.
Luckily, there are steps advertisers can take to manage this uncertainty.
Quality Score Remains an Important Cost Optimization Lever in PPC
The fundamentals of optimizing for quality score and predicted click-through rate remain essential. Focusing on these factors will help minimize what you pay in ad auctions, even as Google changes minimum price thresholds.
Google’s Quality Score algorithm is complex, but essentially it boils down to predicting clickthrough rate (CTR). The higher a keyword’s Quality Score, the more relevant Google thinks your ad will be for searches on that keyword.
This relevance translates into a better Ad Rank, and when your Ad Rank is higher, you pay less per click to maintain it.
Quality Score is calculated in part based on historical CTR data for your keywords and ads. But many other contextual factors are considered each time your ad enters the auction – like query intent, location, time of day, and more.
So Quality Score is very granular and constantly fluctuating.
The core factors that make up Quality Score are ad relevance to the search query, expected CTR, and landing page experience. When these elements are strong, your Quality Score improves, boosting Ad Rank and leading to lower average CPC.
So time invested in improving Quality Score by enhancing relevance has a clear payoff – maintained visibility at a lower cost.
Monitoring and Alerts Are Critical to Detect CPC Changes
PPC monitoring is critical to get alerts on price changes, and automated rules can pause campaigns if extreme anomalies are detected.
PPC management tools like Optmyzr provide (among other things) automated alerts when metrics deviate from goals. You can get notifications for changes in KPIs, budget pacing, or hitting targets. This allows you to address issues before they become larger problems.
Optmyzr also has customizable rules to tell campaigns what actions to take, like pausing or adding keywords to a report. And when a major performance shift occurs— both positive and negative—PPC Investigator can help analyze its root cause.
With Optmyzr’s robust PPC monitoring capabilities, you ensure the prices of your search ads don’t skyrocket out of control. It’s like insurance for your PPC account. This level of monitoring and automation is now table stakes, and imperative for any modern advertiser who wishes to stay on top of volatile auction dynamics.
Use Vertical Benchmarks to Know Whether CPC Increases Are Your Doing
PPC Vertical Benchmarks in Optmyzr helps advertisers understand the performance of their account relative to that of similar advertisers.
Comparing your metrics to vertical-specific benchmarks lets you assess whether a price increase is an industry-wide trend or unique to your account. This context helps determine the best optimization approach:
If your CPC went up but others’ CPCs increased by more, you’re probably on the right path.
If your CPC increased more than those of your industry peers, it may be time to enable additional optimizations – deploying more negative keywords, adjusting target CPA and target ROAS, and rewriting your responsive search ads to be more relevant.
Watch the Trial – And Your Google Ads Accounts
Google’s antitrust trial is still ongoing and may reveal more about the tech giant’s ad practices. If Google is found to be a monopoly, structural changes to auctions could follow.
As the situation evolves, advertisers need the flexibility and control to respond swiftly. The core principles of automation, vigilance, and relying on data hold true to navigate an ever-changing auction landscape.
Conversion tracking is one of the most important tools in a PPC marketer’s toolkit. By tracking post-click actions that indicate value - like lead submissions, purchases, or registrations - you can understand the true ROI of your keywords, ads, and targeting parameters. This enables you to optimize bids and budgets to drive more of the conversions that impact your bottom line.
However, implementing conversion tracking has never been easy. Traditionally, it requires adding code snippets on your site to track conversions and/or integrating your CRM data with your Google Ads account through their API. For many advertisers, this involves engineering resources or dependency on other teams to execute the technical integration. Even for experienced PPC experts, this process can be time-intensive and risky to implement.
That’s why Google’s new Enhanced Conversions for Leads is a potential game-changer. By streamlining the implementation entirely within Google Ads, this new tracking method can help more advertisers unlock the benefits of conversion data in their campaigns. In this post, we’ll cover what Enhanced Conversions offers, how you can benefit, and best practices for getting started.
What are Enhanced Conversions for leads?
Enhanced Conversions provides an alternative way to enable offline conversion tracking without modifications to your existing CRM or analytics systems. Here’s an overview of how it works:
When a potential customer fills out a lead form on your site, that data including their email address, name, and contact details is captured by your site’s form handler or CRM. With Enhanced Conversions, that first-party lead data can be hashed and sent directly to Google Ads to match it with any corresponding ad clicks.
Later, when that lead converts into a sale or other goal, you upload the hashed lead information to Google. They match that lead to the original ad click, closing the loop on the conversion process. This gives Google a more complete picture of the customer journey and lead quality when optimizing your bids and ad placements.
The key difference from traditional methods is that this integration happens entirely within your Google Ads account, instead of via an API or manual uploads. You don’t need engineering resources to modify your CRM and can leverage the lead data you already have on hand.
Why do existing conversion tracking methods fall short?
To understand why Enhanced Conversions is an exciting update, it helps to know why existing conversion tracking has not been widely adopted.
Advertisers are used to being able to control most elements of their campaigns through self-service tools. But those same marketers usually don’t control the CRM systems where this valuable offline conversion data lives inside their organization. This dependency on other teams and sometimes even engineering significantly reduces the adoption of conversion tracking.
Modifying underlying CRM or analytics systems requires technical expertise that is beyond the access of most marketing teams. Even for those with engineering resources, it can be time-consuming and risky to build out a conversion data pipeline securely and accurately. Testing and troubleshooting errors add further delays.
As a result, many PPC marketers have simply avoided the hassle of offline conversion tracking. But that means missing out on critically valuable data to optimize bids and drive ROI.
Benefits of the New Enhanced Conversions
By removing the dependency on engineering resources, Enhanced Conversions makes this kind of conversion tracking far more accessible. PPC experts can enable it directly within their Google Ads interface in a simpler process.
More importantly, activating this deeper conversion data can significantly improve campaign performance:
Gain a more complete view of the customer journey.
What first touchpoints drive the most valuable leads? Enhanced Conversions connects those initial ad clicks all the way through the conversion process.
Optimize bids for quality over quantity.
Focus ad spend on conversions that impact ROI rather than vanity metrics like clicks. Value-based bidding leverages enhanced conversion data.
Eliminate wasted spend.
Identify low-quality leads that don’t convert and avoid bidding on them. Enhanced Conversions provides that feedback loop.
Improve targeting.
Conversion data reveals your best-performing audience segments, placement types, ad formats, and other factors to refine targeting.
Calculate true ROAS.
Without conversions, ROI metrics are only guesses. Enhanced Conversions provides real data on your return from ad spend.
The bottom line is that this richer conversion data powers more efficient spending and better quality leads. For savvy PPC marketers, it’s essential insights for driving campaigns to the next level.
Best practices for implementing Enhanced Conversion Tracking
Here are some best practices to follow as you enable it in your accounts:
Choose the Right Conversion Action.
Your first step is deciding what conversion or goal you want to track. A few key pointers:
Don’t start by tracking final conversions only.
Look for meaningful mid-funnel steps first like lead submissions, demo sign-ups, or email registrations.
Consider volume.
If you track final conversions and they occur infrequently, the system won’t have enough data to optimize well.
Factor in time to conversion.
Longer time lags make optimizations slower. Shorter time-to-convert metrics are better.
Don’t merge all conversions together.
Isolate specific actions to avoid “junk” conversions skewing data.
Thoughtfully Estimate Conversion Value.
Next, think carefully about assigning monetary values to your conversion actions. Some tips:
Leverage data from your CRM on customer LTV or average order value to estimate downstream revenue.
If exact values aren’t known, use reasonable ranges or tiers for each conversion type. Just avoid only 2-3 wide buckets.
Values don’t have to be precise! Relative differences between your conversion types are what matters most.
Manage the Transition to New Conversion Tracking.
Once you’ve decided on conversion actions and values, you can enable Enhanced Conversions in your accounts. But take care with the transition:
Add the new conversion tracking but don’t change your bid strategy at the same time. Let the data accumulate first.
Allow for an adjustment period of at least 1-2 weeks before optimizing bids based on the data. Avoid major changes in short periods.
Watch performance metrics closely and pause aggressive changes if you see volatility or a decline in conversions.
Implement in smaller campaigns first before rolling out more widely. This minimizes risk.
While proper setup takes patience, taking the time to do it right will pay dividends through improved performance.
Looking Ahead with Enhanced Conversions
Now that Enhanced Conversions removes major barriers to implementation, PPC marketers have an opportunity to more fully realize the benefits of offline conversion tracking.
As this method gains adoption, we should see more granular data-driven bidding, spent aimed squarely at profitable outcomes, and continuously improving performance as the system learns. When conversion tracking is democratized beyond just the most sophisticated enterprises, it raises the bar for sophistication across the whole industry.
And that’s greatly accelerated by inventory-level bidding technologies like smart bidding. The combination of conversion data and automated optimization makes PPC campaigns smarter and more efficient than ever.
For savvy PPC experts, staying ahead of these curves by implementing Enhanced Conversions today means you can outperform competitors who fail to level up their conversion tracking capabilities. That advantage will only compound over time as conversion data accumulation enables greater optimizations.
The opportunity is now yours. Get started with Enhanced Conversions and watch your ad spend get smarter.
And if you need help, Optmyzr makes it easier to protect your account!
Not an Optmyzr customer yet? Thousands of advertisers — from small agencies to big brands — around the world use these tools to manage over $4 billion in ad spend every year.
Sign up for our 14-day free trial today to give Optmyzr a try. You will also get the resources you need to get started and more. Our team will also be on hand to answer questions and provide any support we can.
There’s nothing worse than coming back to a dirty house. The washing is piled high, laundry is draped all over the furniture and there’s a ‘stench’ that fills the air.
Nobody wants to invite people into that situation and it can also be massively embarrassing. Well, no more is this metaphor true than when describing a Google Ads account structure.
As with the analogy above, a messy house can often be a sign of something else going on behind the scenes.
In a bid to help you avoid domestic chaos (from an ads perspective of course), we’ve compiled a list of reasons why having a straightforward account structure is so important and ensures you keep your house in order.
3 reasons why a Google Ads account structure is so important
1. Easier navigation
Firstly, just for your own sanity, having an easy-to-understand structure can save you LOADS of time. On an almost daily occurrence, clients, account managers, or wider members of the team may have general questions about the account and its performance.
When this is the case, there’s nothing worse for both parties than having to sit through someone muddling through a straightforward process. By having a clear and easy-to-navigate structure, you reduce the likelihood of this happening and can help to instruct those asking the question in a much more streamlined way.
2. More precise reporting
Whether working in-house, at an agency, or even for yourself, there’s nothing worse than pulling report data that’s a mess. Building on that, it can create extremely difficult situations for account managers who have to go into great detail about poorly defined accounts that contain irrelevant keywords and queries.
An enhanced structure can improve reporting and make optimization a lot smoother!
This is only going to lose the trust of the client so always ensure that the structure aligns with wider reporting goals.
3. Better results
Arguably the most important reason for a clearly defined structure is performance!
Not only does it help to clearly signpost what is and isn’t working (with poor results standing out like a sore thumb!), but a clear account structure can help improve quality scores.
Ensuring that everything from the campaign through to keyword and content matches up ensures you’re putting your best foot forward from a quality score perspective, which in turn can help to improve overall results.
Depending on how complex an account is there is also the added element of ensuring that the structure aligns with individual campaign KPIs.
For example, if you’re running campaigns that utilize different automated bid strategies (be it brand campaigns with target impression share versus product campaigns driving conversion metrics), it would be recommended to cover this element in the naming structure to help remind management teams of the campaign aims.
The flip side
There is an important element to note with structure and that is being ‘over structured’ - if you’re working across a large-scale account, where you know the inner workings like the back of your hand, just consider how an outsider may see it.
Is your detailed naming structure packed full of abbreviations really working for the client?
Do you have campaigns broken out by match type when there really isn’t enough data to warrant this approach?
While the previous hypothetical questions may work, on the one hand, it can often be beneficial to take a step back and think - ‘how can I make this easier to digest?’
The 4 important elements of a Google Ads account structure
So all of these ideas sound great, but I’m sure you’re thinking ‘but what can I do about it?’ - well fear not! Listed below are some key action points on how to set your campaign up for structure success! :
1. Clearly defined naming structures
PPC 101 here but always ensure the campaign name actually has a link to its contents! It’s such a basic thing but numerous accounts have fallen foul of ensuring keywords align with campaign names, leading to a mish-mash of everything and keyword chaos.
2. Labels
Always the lifesaver of an account. I’d always advise leaning on these when accounts scale. As mentioned though, try to ensure that these make sense, we don’t want to make more trouble for ourselves by having to spend time translating our own work!
3. Shared budgets
Shared budgets can be another great way of keeping a budget in line within a nicely ordered account. Why spend time worrying about underutilized budgets when you can automatically share this allocation with those which may be more stretched budget-wise?
Alongside our additional structure must-haves, shared budgets can be a great time saver!
4. Negative keyword lists
Please, please, please take time before launching to consider whether a campaign by campaign, account-level, or hybrid negative keyword list will be best for your account.
Nobody needs to be rueing misspent clicks when the negative keyword should have been set at the campaign level rather than the account level. Get everything tip-top by taking time to consider your approach to negatives.
Keep your house in order
So next time you’re staring into a messy account - stop for a minute, think about all the tips you’ve learned here, and ensure you’ve followed our key steps to ensure that your house is in the best shape of its life!
When creating a PPC campaign, there are a lot of factors that you need to consider to be successful. While crafting compelling ad copy and setting up an effective bid strategy are a few critical parts of the process, converting paid site traffic into paying customers is what it’s all about.
Landing pages are one of the most essential elements of a successful PPC campaign, as they are the first thing potential customers see after clicking on your ad. A well-designed landing page can be the difference between a conversion and a bounce, so it’s important to consider yours.
In this article, I’ll discuss how you can use video on your landing pages to improve the conversion rate of your PPC campaigns significantly.
But first, let’s quickly go over what a video landing page is and why you should create one.
What is a video landing page?
A video landing page is a type of landing page that uses video to promote a product, service, or brand. Usually, the video is the page’s primary focus, with other elements such as text and images playing a supporting role.
**Source**: [Wistia](https://wistia.com/)
Video landing pages are very effective because they can communicate a lot of information in a short amount of time. They are also engaging and visually appealing, which helps capture visitors’ attention.
What are the benefits of a video on a landing page?
When constructing landing pages for your PPC campaigns, there are several factors to consider. However, adding a video should be at the top of your list, as it can provide many benefits. Here are some of them:
1. Improves Engagement
The first and most obvious benefit of using video on your landing pages is that it can improve engagement. Video is an incredibly engaging medium, and including one on your page can help to keep visitors interested.
A recent study by Myzowl polled over 582 marketing professionals to get their take on the benefit and impact of using videos to improve engagement. 87% of those polled said that video has helped them increase traffic to their sites and landing pages while over 60% said that number of views a video receives directly coincides with the success of the advertising campaign.
By using video, you can tell your story in a more engaging and interesting way than with text and images alone. You can also include calls to action within the video, prompting visitors to take the desired action.
2. Is Useful and Informative
Another benefit of video landing pages is that they can be useful and informative when marketed to the right audience. Unlike text, which can often be dense and hard to read, videos are easy to consume and hold people’s attention.
At the same time, a well-made video can communicate a lot of information in a short amount of time. This is perfect for dynamic landing pages where you need to get your message across quickly.
If you’re selling a complex product or service, a video can be an invaluable tool for simplifying complex concepts. By breaking down your offer into bite-sized pieces and explaining it in an easy-to-understand way, you can help to increase conversions.
When you can define the value of your products or services simply and concisely, people are more likely to take the next step.
4. Builds a Positive Brand Image
In addition to being informative and entertaining, videos can also be used to build a positive brand image. When done correctly, they can humanize your brand and make it more relatable. This is important, especially if you want to build long-term relationships with your customers.
By featuring real people in your videos and telling your brand’s story, you can connect with viewers on a more personal level. This will make them more likely to do business with you.
5. Creates an Emotional Connection
Finally, videos can also create an emotional connection with viewers. This is because they allow you to communicate more personally than text or images alone.
While the features of your product or service are indeed an essential component of your campaigns, it’s also important to focus on the emotional aspects.
10 Tips for High-Conversion Video Landing Pages for PPC Campaigns
Now let’s learn how to create high-converting pages. While there’s no one-size-fits-all approach, these tips can help you get started:
1. Use a Script
Making a script is one of the most critical steps in creating a video. Without one, staying on track and including all necessary information will be challenging.
When writing your script, think about what you want to say and how you want to say it. Don’t worry if it’s not perfect, as you can always make changes along the way. Just make sure that you have a clear idea of what you want to say before you start filming. Doing so will save you a lot of time and frustration.
2. Keep the Video Above the Fold
When creating a video landing page, it’s important to keep the video “above the fold.” This means that viewers should be able to see the video without scrolling down.
**Source**: Wistia
If your video is buried below other content, there’s a good chance that people will never even see it.
3. Showcase the Product in Action
Videos are an excellent opportunity to showcase your product in action. This is especially true if you offer a physical product that can be demonstrated.
**Source**: Wistia
If possible, include a demonstration of your product in the video. This will give viewers a better idea of what it is and how it works. Seeing the product in action will also help to increase confidence and encourage people to make a purchase.
4. Optimize for Search
Just like with any other type of content, optimizing your videos for search engines is important. This will help ensure as many people see them as possible. When optimizing your video, there are some core elements that you’ll need to focus on:
Ensure your videos adequately showcase the value
Make sure the video is easy to navigate
Add metadata to your videos, including SEO titles, descriptions, and tags
Incorporate interactive elements into your videos when able
Make your videos accessible by providing transcripts and captions
Leverage video-sharing sites like YouTube to redirect to your landing pages
5. Keep It Short and Simple
When it comes to videos, less is often more. People generally are not interested in watching long, drawn-out videos.
Instead of trying to include everything in one video, break it up into multiple shorter videos. This will make it easier for viewers to digest the information and keep them engaged.
6. Use Custom Thumbnails
People scrolling through their feeds are likely to stop and watch a video if it has an attractive thumbnail. This is why it’s important to take the time to create custom thumbnails for your videos.
Think about what will grab attention and make people want to watch the video. A well-designed thumbnail can distinguish between someone watching your video and moving on.
7. Avoid Autoplay
While autoplay can be a great way to ensure that people see your video, it’s not always the best option. Sometimes, it can be annoying and lead to people leaving your page.
If you do choose to use autoplay, make sure that it’s not set to too high of a volume. You don’t want to startle or annoy people as soon as they land on your page.
8. Make It Informative
Your video should be informative and provide value to the viewer. If it’s nothing more than a commercial, people are not going to want to watch it.
Think about what you can include in your video that will be helpful or interesting to people. The more value you can provide, the more likely people will watch it all through.
9. Capture Attention in the First Few Seconds
It’s important to capture people’s attention in the first few seconds of your video. If you don’t, there’s a good chance that they’ll move on before it’s even over. The first five seconds should be the most engaging part of your video.
Think about what you can do to hook viewers in and make them want to keep watching. This may mean starting with a question, shocking statistic, or attention-grabbing visual.
Regardless of your choice, make sure it will grab people’s attention and get the point across within 5-10 seconds.
10. Focus on the unique value proposition
Your video should be focused on your unique value proposition (UVP). This is what sets you apart from your competitors and is why people should do business with you.
Make sure that your UVP is clear and concise. It should be evident in the video so that viewers know exactly what you’re offering and why they should choose you over someone else.
Level up your landing pages today
Video is a critical element of a landing page. I’m positive that if you follow and execute these 10 tips, it can greatly help you increase your PPC campaign conversion rates and drive more sales.
It’s no secret that Performance Max campaigns present limitations in terms of data and insights we can pull from them. As a result, understanding the causes of their performance fluctuations can be difficult.
I’ve created an in-depth 44-point checklist for ecommerce businesses in this article to make accomplishing that task easier for you.
Of course, you don’t need to go through every single one of these points. Just go over the ones that are relevant to your business.
I also discussed some of these points on PPC Town Hall with Frederick Vallaeys and Mike Rhodes. You can watch the full video here:
Get actionable PPC tips, strategies, and tactics from industry experts twice a month.
Performance Max 44-point evaluation checklist for ecommerce businesses
Investigate…
Estimated conversion reporting delay.
Average days to conversion from first ad interaction (account-wide and campaign-specific).
Conversion tracking and recent changes to conversion actions.
What “normal” PMax performance fluctuation looks like for the account (if appl.)
Recent changes to budget, bid strategy type, Asset Groups, and Listing Groups
Google Merchant Center product disapprovals and warnings, account issues, and feed issues.
Changes to the site (e.g. navigation/checkout, plugins, hosting, page designs)
Changes to in-stock products, especially best sellers.
Changes to pricing, customer shipping costs, and promotions listed or previously listed on the site.
Extremely negative reviews on and off the site
Google Search Console for “Failing” URLs
Changes in relevant search and buying behavior via the Insights section of your PMax campaign and your account as a whole, Google’s Keyword Planner, Google Trends, your site’s search feature (if appl.), Best Sellers section of Google Merchant Center (if appl.), and Microsoft Ads (if appl.).
New competitors in the market or competitors who are changing their level of competitiveness within ad auctions you compete in.
Major changes in other marketing and site traffic channels outside of Google and Microsoft Ads (e.g. Facebook Ads, email automation, affiliates, third-party remarketing channels)
Major changes in on-site shopping behavior (e.g. cart abandonment, check-out abandonment, sessions with transactions)
Shifts in Shopping network-specific performance for PMax.
Top Bidding Signals report for optimization changes recently made by automated bidding.
Performance shifts of landing pages PMax ad clicks are being sent to.
Major changes made to non-PMax campaigns that may have impacted the performance of PMax.
Major shifts in the performance of high-volume or high-performing search terms, geographies, devices, days, days of the week, hours, audiences, match types, or campaign types in non-PMax campaigns.
Performance metric outliers for the campaign pre and post-major increases or decreases in performance.
Performance metric outliers for the products advertised in the campaign - at the campaign-level and Asset Group-level.
Performance metric outliers for the Listing Groups in the campaign.
Asset Group assets or Ad Extensions with Eligible (Limited) or Disapproved status.
Seasonality Adjustments not being added for major promotions, or for other major expected spikes or dips in conversion rates.
Improperly added Data Exclusions, or for instances where Data Exclusions should have been added but were not.
Scripts or Automated Rules that made changes to the account that may have had an impact on Performance Max.
Account changes by other users who are not the primary account manager.
Auto-applied recommendation changes made by Google.
Customer match list additions, removals, or edits.
Custom Experiments recently ended in the account.
Value rules or conversion value adjustments were added, edited, or removed.
“Best” rated assets inside top performing Asset Groups had a recent change in rating.
High-performing or high-volume search categories or terms shifted away from a high-performing or high-volume Asset Group.
Edits made to a Business Feed or Custom Variable that affected any non-PMax campaigns.
CRM integration issues.
Negative Keyword List was added to the PMax campaign being evaluated per the request of another user.
Negative keywords were improperly added to a Negative Keyword List that is applied to the PMax campaign being evaluated.
YouTube ads were opted out of by another user.
Mobile app placements not owned and operated by Google had major increases or decreases in impressions.
Mobile app category exclusions were applied at the account or campaign level.
Location or Ad Schedule exclusions were added or removed for the PMax campaign being evaluated.
Improperly setup Performance Max URL Exclusions.
Auto-generated YouTube videos were added by Google to the PMax campaign being evaluated.
Want to safeguard your Performance Max campaigns? Click here to learn how.
This is a guest post by Cory Lindholm, Founder of Ads By Cory.
About the author: Cory is a paid search expert in Google and Microsoft Ads. He has helped countless brands grow their businesses with advanced paid search strategies for nearly a decade.
Account management is a necessary task that all PPC managers have to perform on a regular basis.
While it can be time-consuming and tedious (like flossing your teeth), it’s unavoidable if you want to keep your account in good health.
In this article, I’ll share four of the most important “campaign hygiene” tasks our PPC managers at WebMechanix perform on an ongoing basis to keep their accounts humming.
1. Audit the search terms report
Auditing the search terms report at different levels is one of the most time-consuming PPC tasks, but also one of the most vital to keep your account’s performance trending up and to the right.
You need to monitor the search terms like a hawk for three key reasons:
1. Make sure the search terms you show for align with what you bid on
This is especially important with the changes Google has made to match types over the last two years. We now see more close variant search terms showing for Exact Match and Phrase Match keywords, some of which are not relevant.
You also need to make sure that the right ad groups are triggering the correct queries. This is a tactic known as “query funneling”. Query funneling by campaign or ad group ensures that the right keyword, ad, and landing page show for the correct query, thereby increasing the chances of a click and conversion.
2. Save money
By looking at the queries, you can start to compile a list of negative keywords. These are keywords that you do not want to show for.
Negative keywords typically fall into two categories:
Keywords that aren’t relevant to your business goals
High-click queries that have not led to a conversion.
By excluding these queries, you free up money to spend on relevant queries that do convert well.
3. Find new keywords to bid on
Typically, you can find a few high-converting queries that you may not have as an exact match keyword. By adding these high-converting queries as exact match keywords, you make sure that you show for that query more often.
Bottom line: The search terms report is a goldmine for negatives, new keywords, and ensuring search intent. Mine it frequently and extensively.
2. Monitor your quality scores
Quality score (QS) is often an overlooked metric when assessing account performance.
I find PPC managers often fall into two camps.
Camp 1 says, “Quality score is an important metric to assess and try to improve.”
Camp 2 says, “Quality score, shmality score… doesn’t have an iota of impact on account performance.”
At WebMechanix, we fall in the first camp. We’ve found that you can improve quality score while optimizing your accounts!
Besides, quality score is one of two metrics used to determine ad rank and how much you will ultimately pay if your ad is clicked on. So it’s worth paying attention to.
And since Smart Bidding is prevalent in most accounts these days, quality score can often be your only lever to lower your cost per click (CPC).
When assessing quality score, I look at keywords with high click volume to see which ones have low quality scores, and then the reason Google gives for the low quality score. Finding a high-click keyword with a low quality score due to ad relevance is like finding gold within your account.
With the exception of competitor keywords, you should never have a keyword that has an ad relevance below average. That’s because ad relevance is the easiest metric that a PPC manager can influence.
It can easily be improved by adding the keyword with a low quality score to your ad copy. By doing this simple task, you can end up saving literally hundreds of dollars a month (if not thousands).
Bottom line: Quality score is a powerful lever to lower your cost per click and crank up return on ad spend (ROAS). Make efforts to improve quality score a part of your weekly routine.
3. Prune out non-serving keywords
Easier-to-manage accounts are typically the ones that perform the best. So stop overbuilding accounts and adding an unnecessary amount of keywords to each ad group!
One easy way to make your accounts easier to manage is by removing non-serving keywords. Within almost every account, there will be several keywords that have not shown an impression for a large period of time (often 90+ days).
Ask yourself: Are these keywords really necessary, or are they getting in the way and making it harder to assess performance?
Don’t be afraid to go through and hit “pause” on clutter keywords like these. Your future self will thank you when you go to build reports and optimize your account.
Bottom line: Don’t make your job as a PPC manager harder than it has to be. Clean out dead weight keywords regularly and watch your effectiveness soar.
4. Cut ties with low-performing keywords
I know, you probably picked the keyword and really feel that it should be performing for you. But if a keyword isn’t delivering results within a reasonable period of time, you have to make that critical decision and pause.
When onboarding new accounts, this is one of the first tasks our account managers perform. We have seen accounts where only 2% of the keywords that had been clicked over the last 30 days were responsible for a conversion. That’s a lot of wasted spend!
By pausing the high-click non-converting keyword, you are able to spend more on your high-converting keywords — which means more bang for your PPC buck at the end of the day.
Bottom line: Stop wasting spend on low-performing keywords, especially if you have high-converting keywords that are losing search impression share due to budget constraints.
Block and tackle like the PPC pros to win on search
No one said everything about managing a paid search account would be sexy.
In fact, it’s often the unsexy things done consistently over time that drive growth, not the flashy or big sweeping account changes.
And you don’t have to go at it alone — Optymzr has some great PPC tools to help make that daily PPC grind a little bit more automated.
But by executing these four activities on a consistent basis, you’ll be doing the work that most advertisers are too lazy to perform. And you’ll get the results those other advertisers can’t.
Google calls it value-based bidding. We think of it as ROI optimization. Other teams simply consider it maximizing conversion value.
Whatever the name, there’s one outcome: more valuable, higher quality leads that improve overall profitability.
Here’s an example of this strategy in action of our client which is a drug rehabilitation and mental health services facility in Florida.
Watch Taylor Mathauer and Will Gray from WebMechanix share how they used Value-Based Bidding to generate higher-quality leads for their client.
You will learn: - Why they decided to use value-based bidding - Success with value-based bidding - The state of smart bidding and limitations with value-based bidding - Where they’ve seen value-based bidding not work - Requirements for using value-based bidding - When is value-based bidding appropriate - How to track success with value-based bidding
Designing the next step for our client
For our client, volume is the name of the game. Over the course of our campaigns, we’ve optimized for both form fills and phone calls, but calls have historically been our North Star.
While other conversion actions like form fills or insurance verifications are still valuable to their business (and check the box of volume for their admissions team), they wanted to increase the number of calls sourced via Google Ads spend due to their much higher MQL and SQL rate.
The challenge was finding a solution that could prioritize calls while not completely eliminating other conversion actions that are still valuable to their business.
Answering the call to maximize ad spend value
Our solution was to use a value-based bidding strategy to teach Google’s bid strategies which conversion actions are most valuable to our client’s business.
By setting conversion values for our conversion actions and using a value-based bid strategy, we were able to train Smart Bidding to prioritize the action that provides the most value without sacrificing overall lead volume.
Step 1: We did some funnel math to ensure we were setting the correct value for each conversion action. We started by assessing the average revenue each conversion action had driven over a certain time period.
Step 2: We looked at down-funnel metrics such as MQLs, SQLs, and Closed Deals to assign an appropriate value to each conversion action. Below is an example of the math we did to get the accurate conversion value for each action:
Step 3: After setting the correct conversion values for each action, we needed to decide what bid strategy to use. We landed on Target ROAS (tROAS) because we believed that this would increase the number of calls for our clients while improving efficiency.
Note: tROAS works by predicting the value of each query and bidding higher on queries that are more likely to drive a high-value conversion.
Monitoring the outcome for optimal success
We implemented our value-based bid strategy on October 29, 2021.
There are two lenses of performance here: the first looks at the first 4.5 months of implementation, while the second looks at performance since implementing this bid strategy vs. the previous period, to show overall account growth.
The purpose of the latter is to show that as the Smart Bidding algorithms adjust to these users, they’re able to have a rolling impact.
Looking at the last 4.5 months compared to the previous period, we saw a 161% increase in phone calls, 58% increase in form submissions, and a 31.5% drop in cost per lead.
Looking at October 30, 2021 to July 25, 2022 compared with February 3, 2021 to October 29, 2021, we observed a 96% increase in phone calls, 267% more form submissions, and a 54% reduction in account-wide cost per lead.
Conclusion
If the primary goal of your PPC account is to generate leads to be nurtured, there’s a strong case to be made that value-based bidding is your best bet at stretching your ad budget to its fullest capability.
Learn more about how to use this approach to optimize the ROI of your Google Ads campaigns with these resources:
Over the past 5 to 6 years we have all experienced the impact of change within the PPC community. While many of the changes have made tasks faster, advances in automation and machine learning have forced paid search professionals to navigate platform changes without control.
With even more feature confusion marketers can feel overwhelmed by their inability to keep up with Google’s propensity for change.
PPC Marketers are losing control. There is still a hyper-awareness of performance metrics while knowing the industry won’t go back in time. So, what does it all mean?
The two main categories of automation
Task automation
Task automation is pretty simple. Two small examples of automated tasks that have changed over the past few years in PPC include
the ability to find redundant keywords in an account, and
the ability to quickly report data
Both of these tasks used to involve downloading raw data into a spreadsheet and creating pivot tables. Today, both these tasks can be done in minutes using the ‘Recommendations’ Tab or the ‘Report Center’ in the Google Ads interface.
Automation is a positive evolution in the paid search industry for seasoned professionals, but it can be difficult for beginners.
The main drawback of task automation is that people who are new to the field often do not understand why the task is important; they just know to press the button. Finding duplicate keywords for example is a way to avoid competition with ads in the same account.
When there are multiple versions of keywords, ad relevance gets diluted which can impact quality score, reduce click-thru rates and increase CPCs.
When it comes to reporting tasks, prior to automation, segmented reports were cumbersome to create. Reporting can show trended data in the interface but once broken down into segments, the decision-making becomes stronger.
Segmenting data can help determine which campaign type or setting is delivering the most value for the account. Understanding how to segment data and why to segment is a skill that requires experience.
Taking the time to understand why data should be analyzed in different ways will foster better client communication.
Bidding automation
Automated bidding is a different category of automation. Historically, as Google Ads evolved we had only lost control of variants. Automated bidding has been a significant shift. This change means that campaigns need to be consolidated so Google has enough data to learn.
The automation of bidding also favors larger campaign budgets as small daily budgets limit impression share and the ability to get all the data possible.
Lastly, this type of bidding works best when match types are broad because the system can maximize the reach of the keyword and consider the context of the search. This is another area of automation where understanding the history and basics of PPC can shed insight as to why the campaign is behaving in a specific way.
1. Understanding how automation operates is key.
Understanding the types of automation is a key component of effective PPC account management. Showing the trend over time as well as the strategy that has been deployed adds context to client reporting.
Get actionable PPC tips, strategies, and tactics from industry experts twice a month.
You can’t have it all. It’s a sad, but true fact. You can’t scale an account while becoming more efficient. And the tactics and strategies for each goal are fundamentally different.
It’s like trying to make a peanut butter sandwich while getting your nails done: it just doesn’t work. Alignment and understanding here are critical because clients often ask why CPAs are increasing while pursuing a growth strategy.
As marketers navigating automation it is best to plot learning periods, campaign launch days, budget changes, bidding strategies, and campaign reorganization alongside performance data. This is a great way to explain to clients why the data shifted while explaining the impact of different campaigns and strategies.
2. Audience targeting has evolved over the years.
Another shift in PPC has been the evolution of audience targeting. PPC was designed around keywords. Still, in 2022 we create keyword lists and attempt to match keywords to intent.
However, Google has inch-by-inch added supplemental features to allow for more audience targeting. Advertisers can now target ads based on specific groups or demographics of people that share similar characteristics or interests and layer this data into campaigns with keywords.
The audiences provide more context to our paid search campaigns.
Why do audiences matter?
As much as we think we know, keywords aren’t perfect. The intent is difficult to pinpoint and paid search in the search network is based on matching intent.
“Keywords are not focused on the human, instead, they are focused on the word itself and what we think we know. In contrast, audience targeting is all about people. Instead of looking at keywords, audiences factor humans that have certain characteristics, demographics, and behaviors.”
As marketers, we are trying to influence behavior so the human component of audiences is relevant. Merging the keyword with audiences absolutely improves paid search campaigns.
3. The keyword has evolved too.
The paid search community has a hard time admitting that the keyword is not perfect. Bottom-of-the-funnel activities are easy to understand and show high returns.
Get actionable PPC tips, strategies, and tactics from industry experts twice a month.
Those of us who started in the early days lived through a radical budgeting shift. In traditional media such as TV and radio demand capture is harder to measure. Keyword paid search was not only easy to measure but could be directly tied back to sales and actions.
As time went on, advertisers struggled to grow demand. Their problem was that they had invested heavily in demand capture activities and underinvested in demand generation tactics. Large advertisers who had abandoned traditional media began to see the light and reinvested in traditional advertising.
It is no surprise that most advertisers did not put their money back into TV, radio, and newspapers. Instead, advertisers moved to Facebook, programmatic display, and CTV.
These newer platforms excel at demand generation more than the keyword. During this time keywords became saturated. Keyword bidding could feel like hitting a brick wall when it came to increasing lead volume.
Platforms such as Google have this data and realized at some point to grow their revenue they would need advertisers to grow beyond keyword bidding as well. The platforms offered top-of-funnel solutions.
But let’s face it - the community at large was reluctant.
This was the start of automation and platform changes. Today the age of automation is upon us.
At first, advertisers were not even sure how to react. Those who had the highest confidence in their abilities started telling stories of a past life where they had been on the other side of the fence, wearing the shoes of the man who crafted the campaigns himself.
They spoke of spending six hours a day meticulously concatenating millions of keywords, optimizing ad copy, and tinkering with settings, in an attempt to find that golden 1% boost in conversion rate.
Modern advertisers leaned into automation and saw success. They began to lean into a fuller funnel approach.
“Today the best advertisers lean into automation while taking the time to understand platform changes. The understanding comes from reading support documentation, understanding the history of how the tasks worked when being done manually, and having a healthy dose of skepticism when applying changes.”
4. Google support’s quality has degraded.
Another evolution in PPC has been platform support. In recent years, Google customer support has been less responsive than it was in the past.
“Click-to-chat has become the new norm. Calls involve long wait times. Google reps are focused on sales and tool adaption and less focused on teaching and supporting client goals.”
They come across as having their priorities backward, while conversations can be circular arguments with the rep referencing incorrect support documentation or proposing campaign changes that don’t align with the goal.
There have been times it seemed like customer support was handled by a computer instead of a human.
5. The PPC community has become more collaborative.
The PPC industry has become much more open as a result of this lack of support, which has led to an increase in collaboration among members of the community. In the past, as professionals, we were territorial over tactics and resisted openly sharing successes and failures.
Get actionable PPC tips, strategies, and tactics from industry experts twice a month.
Today, we work together to figure out what works and what does not perform as expected.
6. There’s more access to learning resources now.
Another change in the PPC industry is access to information. When I got started in paid search marketing, I had to read blogs to learn. I remember setting up Google Alerts in my inbox so I could read any article about paid search, PPC, or SEO.
Today there are free webinars, books, podcasts, virtual conferences, TikToks, and YouTube channels. There are ways to consume content on your own terms. I’ve been able to attain some of my professional success because of the flexibility afforded by my ability to listen to podcasts or YouTube videos.
“The sharing of information has helped our community thrive in that: it has spread ideas and enabled collaboration. Most of us have stopped trying to outwit the machine and accepted that we can not beat or control it.”
Understanding how machine automation operates is more impactful than deep dives into spreadsheets which was a requirement during the ‘3 million keyword’ days of paid search.
We need to work alongside the machines.
To sum up the changes in PPC - we’re in a battle against the bots. And while it’s up to the industry to fight them together, the onus is on each of us individually to adapt and make the most out of this automated landscape.
It’s important to remember why you got into PPC in the first place - for the opportunities for creativity, for developing your own style, for pushing yourself. If you only view automation as an evil force trying to steal your job, then automation will win.
And maybe that’s how some out there want it - but I don’t think many would be satisfied with a passive existence. Whether or not automation wins, we all need to start looking at new ways to become the best marketers and PPC strategists.
I encourage you to work with your clients to find ways to keep ad campaigns interesting and fresh regardless of what changes come our way.
This is a guest post by Sarah Stemen, Senior Paid Search manager for Marcus Thomas.
About the author: Sarah Stemen is a Senior Paid Search manager for Marcus Thomas based in Cleveland, Ohio. She is a regular participant in PPCChat and a board member of the Paid Search Association. Sarah has been working in paid search since 2007 and has spent time on both the client side and the agency side. When not doing paid search, Sarah is busy with 3 kids.
Get actionable PPC tips, strategies, and tactics from industry experts to your inbox once a month.
Has the world of PPC as we knew it come to an end?
The short answer, my friend, is not yet and, if you continue reading this article, you’ll understand what I mean :-)
I’ve avidly read all articles and reports by Frederick Vallaeys and several of the top most important Google Ads professionals in the world. I’ve also performed a lot of experiments myself and I am sure that there still is a wide scope for manual selective targeting to perform better than machine learning.
But then the real question becomes: how to do it (without losing the immense possibilities provided by AI)? And, under what circumstances is it worth it?
The answer as often is the case in the digital marketing industry, is not easy and has to be applied on a case-by-case basis, after an evaluation of running campaigns.
When is automation worth it?
My almost 20 years in PPC have taught me that there is not a right or wrong way of doing Google Ads, but several more or less effective ways to target your ideal prospects or customers.
I’ve literally seen things in Google Ads campaigns (that you wouldn’t believe) working well, and technically perfect structures failing to meet even the minimal goal they were built for.
This is why I’ve always tried to reach my ideal target audience in the most complete (& simplest) ways the platform allows me to do. This way of doing campaigns will never fail.
But it also means you cannot use a fixed model or structure to promote everything. You always have to try almost completely different approaches to meet your campaign’s goals.
Anyway, after having tested several different ad structures I come to elaborate on a general wireframe, which I hope can help you too.
What is ‘Agile Target Layering’ and how does it work?
I named it “agile” because it is not built on a fixed structure. You have to change it as soon as you see it does not achieve results or if you find better ways to effectively address your audience.
I used the words “target layering” because to get the most out of your campaigns you have to be sure that machine learning perfectly understands which are your ideal audiences and covers them completely.
If it doesn’t, you have to pair it with some manual target “layers” to be sure to cover what you know performs best at the lowest cost possible.
Presently the only way to achieve this goal is to add some “old school” campaigns to the PPC AI, which we are only slowly starting to taste these days.
**The Agile Target Layering framework by Gianpaolo Lorusso**
To explain it in a simple way, you should address the top of the iceberg’s best-converting search intent of your audiences with a phrase or exact match campaign (starting from branded keywords, for instance).
Then leave the conversion stars scouting to machine learning (ML), sculpting these campaigns out with negatives for irrelevant terms and what already is performing well in your “old school” campaigns.
Once ML finds something that converts, you can loop again into the process, and build a new manual target layer upon it, or simply enjoy all the benefits of ML and spend your saved time thinking of other approaches you could use to your target users (or even better spending time with your family 😊).
Agile Target Layering applied to a hyper-competitive industry
Imagine you have to sell luxury home rentals in Sorrento (one of the best seaside spots in Italy) on a global scale.
**Source**: Sorrento Home Rentals
Your Bottom of the Funnel (BOFU) keywords to build specific phrase or exact match search campaigns could then be: “Sorrento luxury villas”, “Sorrento luxury rentals”, “Sorrento villas with private pool”, “Sorrento luxury apartments” etc. That is “specific location + a luxury related term + home rental term”.
Nothing, except branded terms with the name of the villa or website, will ever attract more in-target users to your site.
If your budget allows it, you could then add some broad match MOFU campaigns with keywords like: “Sorrento villas”, “holiday rentals Sorrento”, “Sorrento home rentals,” etc., and see if machine learning can do the magic of finding juicy audiences for you.
Then again you could add a final layer with totally machine-learning-driven campaigns like Performance Max or Discovery/Display to address TOFU audiences to see if you can convince someone who isn’t even aware of the existence of so a beautiful place like Sorrento and only wants a place to literally “spend” their time (and money, of course).
After an initial training period (the lower the budget, the longer the period) you will be able to check what needs adjustments, what has to be stopped, and what deserves more push and optimization.
Final takeaways
I firmly believe that our mission as PPC professionals in this time of great change in our industry is to instruct machine learning on what it doesn’t or cannot know (marginality of sales, seasonality, competitor brands with our same exact positioning in the market, best audiences to start from, etc.) and to be sure that our budget is spent first on what has the maximum chance to convert and then, if profit margins allow it, on what might convert.
This is a guest post by Gianpaolo Lorusso, a PPC & CRO consultant.
About the author: Gianpaolo Lorusso is a PPC & CRO consultant for several medium & large companies. He also founded ADworld Experience, the largest Pay Per Click & Conversion Rate Optimization event in Europe and the largest in the World based on real PPC Cases.
You’ve done your keyword research, narrowed down your top keywords, written compelling ad copy, and created a great landing page for what you’re selling. But you find out your Quality Score is below average.
Improving your quality score increases your ad’s position and as a result, increases its landing page visibility. It’s also an indicator that your ad is relevant and doing well.
Quality Score was and continues to be the key way to understand what Google thinks of the quality and relevance of your ads.
Automation backed by machine learning delivers good results, but it can’t do much about relevance problems, so focusing on relevant ads will improve your performance further.
A better Quality Score always has and always will help you save money.
Time to move on to the meat and potatoes of this post. Don’t worry though, I’d never leave you hanging.
5 Ways to Improve Quality Score
1. Use Optmyzr’s Quality Score Tracker
That’s not to say that you can’t use what Google gives you, but our team uses Optmyzr to track our quality scores. Why? Because when you have as many accounts as we do (I work for a digital ad agency) with dozens of campaigns, ad groups, ads, and keywords in play at the same time, we need all the help we can get in order to quickly pinpoint the areas we need to focus on the most.
We’ve worked the Quality Score Tracker into our daily process and our clients are way better off because of it. We’ve also learned that this is a great tool to show clients. Granted, there is some debate out there about whether quality score is a good metric to show a client or not but with the way we do things, it’s great.
We like to teach our clients because we believe that a learned client is a lifelong client and, as long as they understand what kind of return on ad spend (ROAS) they are getting, one who understands the benefits of larger paid search budgets
Below is a real screen-shot of a dealership client of ours:
Right off the bat, we can see where the issue is. Overall, the account quality score is good at 7.7 but as we all know, there’s always room for improvement. That red circle on the top left stands out, doesn’t it?
Clicking into it we can see the offending ad group in addition to the offending keywords. We can even see the quality score over time. Below where it says Daily Trend (bottom of image) there is a line graph that tells you exactly when the quality score dipped.
Armed with that knowledge, I’m able to go into Google Ads and see that the ad was wrong. While the ad had been changed to include the year of the vehicle, the keywords for this particular ad group didn’t include that information.
Since the keywords being bid on didn’t match the ad and, of course, the landing page when the ad was clicked on didn’t match the ad, the quality score went down.
This took just a few minutes to find and then correct.
2. Use Long Tail Keywords – Expected CTR Quality & Ad relevance
Competitive keywords can be difficult to manage in both organic and paid search, especially in the more competitive industries, which is why you should always be picky about the keywords you use. With long-tail keywords, you can be more specific and specificity equals a higher conversion rate, less cost per click, and a higher expected click-through rate.
If you really want to take the whole superhuman CTR thing to the next level then think about using single keyword ad groups (SKAGs). True, these may take a bit more work to implement but your CTR will thank you.
There are more than a few reasons why you’d want to take a closer look at SKAGs and I encourage you to if you aren’t familiar with them or haven’t tried them yet. One of the main reasons why SKAGs work so well is because they are so very relevant. Using SKAGs you can ensure that every keyword used (don’t forget about long-tail here) is in the ad copy of the ad.
Yes, you can use dynamic keyword insertion for this, but for more flexibility, try SKAGs.
Negative keywords are your friends. For some reason, negative keywords are easy to overlook, but they should be paid close attention to. The search term report will show you the holes that need to be plugged. Plug them, but keep checking back to make sure another leak hasn’t sprung.
3. Use EVERY Ad Extension possible – Expected CTR Quality & Ad relevance
I see a lot of accounts once we take them over from another agency and it always confuses me as to why more ad extensions aren’t used. Not only do they give your ad more bling, but they also take up more space (this is really good on mobile), increase relevancy and drive up the click-through rate.
I understand that not all ad extensions will be relevant in every case, but use all that makes sense. Yes, some are more time-consuming than others but the more you use the better your ads will perform.
Take a look at the price extension. Can you use it? Then do it. It takes up a ton of space on mobile and can really drive your competitors down. Recently, Google announced that price extensions are now available on all devices.
Again, they take up a lot of space and, on desktop, look really cool. Need more of that bling I mentioned earlier? Well, here you go.
Also, make sure that you’re at least using location extensions (if you have a physical location), call extensions, structured snippets, site links, call-outs, and the message extension.
Sound like a lot? This is just the tip of the extension iceberg, make sure to use as many as you can. When it comes to extensions, remember that more specific is better. What I mean by that is that you can add account-level extensions but you’ll see better success if you narrow it down to the campaign level or, better yet, the ad group level.
Just remember to keep your eye on the prize, a better quality score.
4. Ongoing Ad Optimization – Expected CTR Quality & Ad relevance
One ad per ad group isn’t enough, neither are two. Google recommends at least 3 per ad group. The best way to get the best performing ads is by doing A/B split testing, even if you are using SKAGs. Also, think about copywriting and how you can turn a boring ad into a more compelling ad that invites a click.
The best way to ensure that your ads are highly targeted is to always write each one from scratch. Never stagnate, always try to beat your best performing ads by writing even more compelling copy for the next ad.
If you have long-tail keywords going to a highly converting ad then you are well on your way to increasing your click-through rate and your ad relevance.
5. Take a long hard look at your landing pages – Landing page experience
You wouldn’t send an ad about toothpaste to a page selling candy, would you? Rhetorical question, but sometimes it takes an absurd question to drive a point home. My point is that you should be as obsessed with making your landing page match the ad as you are about the ad matching the keyword.
That’s a great start but you need to go further than that.
First, make sure the landing page looks just as good on mobile as on desktop. Pay close attention to the speed of the page because Google has gone on record saying that 53% of smartphone users will abandon a web page if the site takes more than 3 seconds to load.
3 Seconds! Couple that with a recent study that shows we have an average attention span of just 8 seconds (1 second less than a goldfish) and you have a recipe for disaster if you aren’t careful.
While I won’t be going into depth about landing pages in this post I think it’s important to ensure that your landing page has a call to action. What’s a call to action? Anything that gets people to act on whatever it is that you want them to do. It can be a lead form submission, a download, a phone call or even watching a video.
Whatever it is it has to be very easy to do. Making people jump through hoops won’t lead to conversion. Having said that, if it’s not feasible to put the final call to action on the actual landing page, then you must make sure that your site is easy to navigate with a clear path to your desired conversion.
Take a long hard look at your landing page data and pay particular attention to what is happening in analytics. Are they converting? Are they following the path you’ve laid out for them? If not, why not? Take a look at the data from both the desktop and mobile perspective, is anything off? If so, fix it.
Don’t stop there
Keep optimizing. Don’t let your account, or your client’s account, slowly die. Stay active, make adjustments regularly, and become obsessed with raising the bar. Never stop until the bar is as high as it can possibly go. There has been a lot of talk over the years, even research done on the importance of account activity. So, stay active my friends.
This is a guest post. The views and opinions expressed by the author are solely their own and do not represent that of Optmyzr.