You’ve done your keyword research, narrowed down your top keywords, written compelling ad copy, and created a great landing page for what you’re selling. But you find out your Quality Score is below average.
Improving your quality score increases your ad’s position and as a result, increases its landing page visibility. It’s also an indicator that your ad is relevant and doing well.
Quality Score was and continues to be the key way to understand what Google thinks of the quality and relevance of your ads.
Automation backed by machine learning delivers good results, but it can’t do much about relevance problems, so focusing on relevant ads will improve your performance further.
A better Quality Score always has and always will help you save money.
Time to move on to the meat and potatoes of this post. Don’t worry though, I’d never leave you hanging.
5 Ways to Improve Quality Score
1. Use Optmyzr’s Quality Score Tracker
That’s not to say that you can’t use what Google gives you, but our team uses Optmyzr to track our quality scores. Why? Because when you have as many accounts as we do (I work for a digital ad agency) with dozens of campaigns, ad groups, ads, and keywords in play at the same time, we need all the help we can get in order to quickly pinpoint the areas we need to focus on the most.
We’ve worked the Quality Score Tracker into our daily process and our clients are way better off because of it. We’ve also learned that this is a great tool to show clients. Granted, there is some debate out there about whether quality score is a good metric to show a client or not but with the way we do things, it’s great.
We like to teach our clients because we believe that a learned client is a lifelong client and, as long as they understand what kind of return on ad spend (ROAS) they are getting, one who understands the benefits of larger paid search budgets
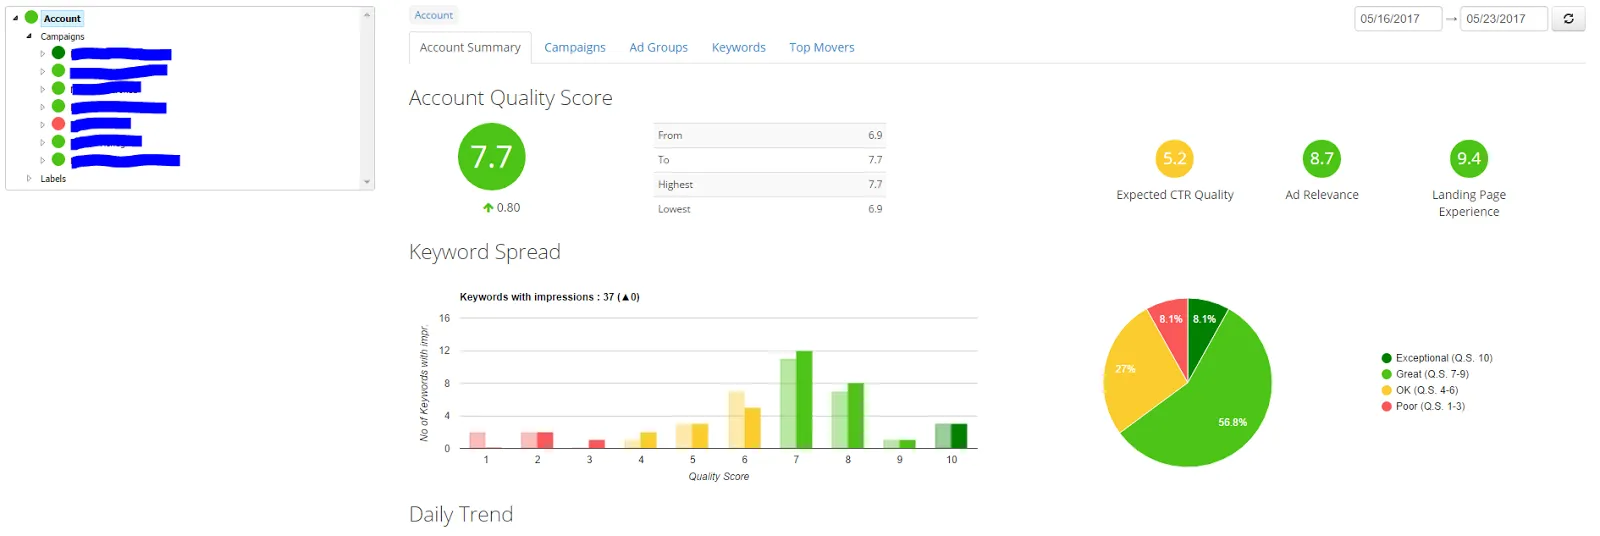
Below is a real screen-shot of a dealership client of ours:
Right off the bat, we can see where the issue is. Overall, the account quality score is good at 7.7 but as we all know, there’s always room for improvement. That red circle on the top left stands out, doesn’t it?
Clicking into it we can see the offending ad group in addition to the offending keywords. We can even see the quality score over time. Below where it says Daily Trend (bottom of image) there is a line graph that tells you exactly when the quality score dipped.
Armed with that knowledge, I’m able to go into Google Ads and see that the ad was wrong. While the ad had been changed to include the year of the vehicle, the keywords for this particular ad group didn’t include that information.
Since the keywords being bid on didn’t match the ad and, of course, the landing page when the ad was clicked on didn’t match the ad, the quality score went down.
This took just a few minutes to find and then correct.
2. Use Long Tail Keywords – Expected CTR Quality & Ad relevance
Competitive keywords can be difficult to manage in both organic and paid search, especially in the more competitive industries, which is why you should always be picky about the keywords you use. With long-tail keywords, you can be more specific and specificity equals a higher conversion rate, less cost per click, and a higher expected click-through rate.
If you really want to take the whole superhuman CTR thing to the next level then think about using single keyword ad groups (SKAGs). True, these may take a bit more work to implement but your CTR will thank you.
There are more than a few reasons why you’d want to take a closer look at SKAGs and I encourage you to if you aren’t familiar with them or haven’t tried them yet. One of the main reasons why SKAGs work so well is because they are so very relevant. Using SKAGs you can ensure that every keyword used (don’t forget about long-tail here) is in the ad copy of the ad.
Yes, you can use dynamic keyword insertion for this, but for more flexibility, try SKAGs.
Negative keywords are your friends. For some reason, negative keywords are easy to overlook, but they should be paid close attention to. The search term report will show you the holes that need to be plugged. Plug them, but keep checking back to make sure another leak hasn’t sprung.
3. Use EVERY Ad Extension possible – Expected CTR Quality & Ad relevance
I see a lot of accounts once we take them over from another agency and it always confuses me as to why more ad extensions aren’t used. Not only do they give your ad more bling, but they also take up more space (this is really good on mobile), increase relevancy and drive up the click-through rate.
I understand that not all ad extensions will be relevant in every case, but use all that makes sense. Yes, some are more time-consuming than others but the more you use the better your ads will perform.
Take a look at the price extension. Can you use it? Then do it. It takes up a ton of space on mobile and can really drive your competitors down. Recently, Google announced that price extensions are now available on all devices.
Again, they take up a lot of space and, on desktop, look really cool. Need more of that bling I mentioned earlier? Well, here you go.
Also, make sure that you’re at least using location extensions (if you have a physical location), call extensions, structured snippets, site links, call-outs, and the message extension.
Sound like a lot? This is just the tip of the extension iceberg, make sure to use as many as you can. When it comes to extensions, remember that more specific is better. What I mean by that is that you can add account-level extensions but you’ll see better success if you narrow it down to the campaign level or, better yet, the ad group level.
Just remember to keep your eye on the prize, a better quality score.
4. Ongoing Ad Optimization – Expected CTR Quality & Ad relevance
One ad per ad group isn’t enough, neither are two. Google recommends at least 3 per ad group. The best way to get the best performing ads is by doing A/B split testing, even if you are using SKAGs. Also, think about copywriting and how you can turn a boring ad into a more compelling ad that invites a click.
The best way to ensure that your ads are highly targeted is to always write each one from scratch. Never stagnate, always try to beat your best performing ads by writing even more compelling copy for the next ad.
If you have long-tail keywords going to a highly converting ad then you are well on your way to increasing your click-through rate and your ad relevance.
5. Take a long hard look at your landing pages – Landing page experience
You wouldn’t send an ad about toothpaste to a page selling candy, would you? Rhetorical question, but sometimes it takes an absurd question to drive a point home. My point is that you should be as obsessed with making your landing page match the ad as you are about the ad matching the keyword.
That’s a great start but you need to go further than that.
First, make sure the landing page looks just as good on mobile as on desktop. Pay close attention to the speed of the page because Google has gone on record saying that 53% of smartphone users will abandon a web page if the site takes more than 3 seconds to load.
3 Seconds! Couple that with a recent study that shows we have an average attention span of just 8 seconds (1 second less than a goldfish) and you have a recipe for disaster if you aren’t careful.
While I won’t be going into depth about landing pages in this post I think it’s important to ensure that your landing page has a call to action. What’s a call to action? Anything that gets people to act on whatever it is that you want them to do. It can be a lead form submission, a download, a phone call or even watching a video.
Whatever it is it has to be very easy to do. Making people jump through hoops won’t lead to conversion. Having said that, if it’s not feasible to put the final call to action on the actual landing page, then you must make sure that your site is easy to navigate with a clear path to your desired conversion.
Take a long hard look at your landing page data and pay particular attention to what is happening in analytics. Are they converting? Are they following the path you’ve laid out for them? If not, why not? Take a look at the data from both the desktop and mobile perspective, is anything off? If so, fix it.
Don’t stop there
Keep optimizing. Don’t let your account, or your client’s account, slowly die. Stay active, make adjustments regularly, and become obsessed with raising the bar. Never stop until the bar is as high as it can possibly go. There has been a lot of talk over the years, even research done on the importance of account activity. So, stay active my friends.
This is a guest post. The views and opinions expressed by the author are solely their own and do not represent that of Optmyzr.
Today Google announced the addition of seven new Quality Score (QS) fields in AdWords, including historical QS. It goes without saying that we’re big fans of giving advertisers access to this data. After all, Optmyzr’s first major tool was the historical QS tracker we launched in the summer of 2013. Ever since then we’ve tracked billions of points of data to help advertisers make more sense of their Quality Scores.
Is there a need to continue to use tools for QS tracking now that Google is providing the same functionality directly in AdWords?
Like Jacob from our friends at Hanapin says, it’s definitely nice that any advertiser can now get the data, without needing to resort to tools, or AdWords Scripts. But there are some significant benefits you get from using Optmyzr to track QS. Here are 5 things you can do with Quality Score in Optmyzr that you can’t in AdWords.
#1: Optmyzr helps you prioritize Quality Scores to fix
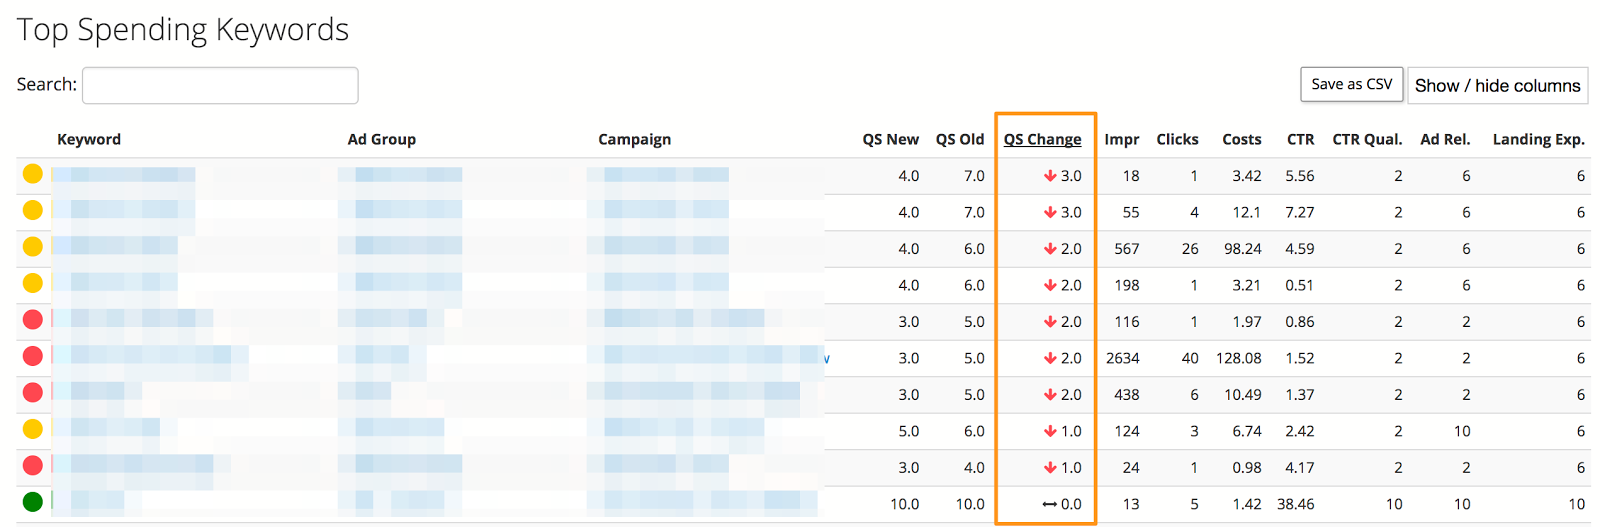
While AdWords now includes both the current and historical QS, it doesn’t have a column for letting you see the difference between these two numbers. That may seem trivial but when dealing with hundreds or thousands of keywords, it’s nice to have a simple way to find keywords with the biggest increase or decrease in QS.
Optmyzr’s Quality Score Tracker includes a column called QS Change. It shows the numerical difference between the QS on the start and end date of the selected range. By clicking on this column, it’s very easy to find keywords with the biggest drop in Quality Score. It’s a great tool to identify the keywords most in need of some attention.
The column “QS Change” makes it easy to see which items had the biggest change between 2 dates.
#2: Optmyzr shows aggregate QS and account QS
It’s easy to focus your attention in the wrong place if you’re not taking volume into consideration. For example, look at the screenshot in the last paragraph and notice that the keyword with the biggest decline in QS had 18 impressions. It might be possible to improve that keyword’s Quality Score, but how much will that really benefit the account?
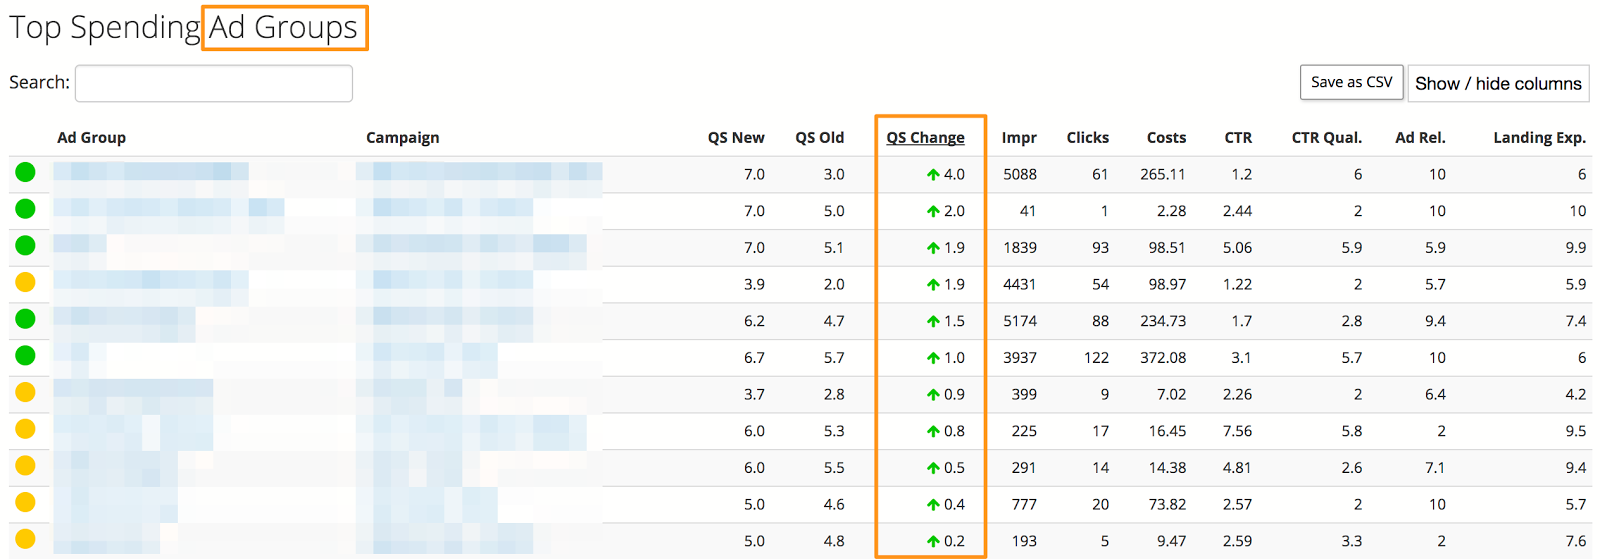
That’s why Optmyzr has always provided aggregate QS in the form of an impression-weighted account-level quality score, as well as campaign-QS and ad group-QS.
This helps advertisers focus on making changes in the places that can have the biggest payoff. For example, here’s where the biggest QS improvements are in this account. Because it’s aggregated at the ad group level, there is more data, making the insights more meaningful.
See which ad groups had the biggest gains in Quality Score.
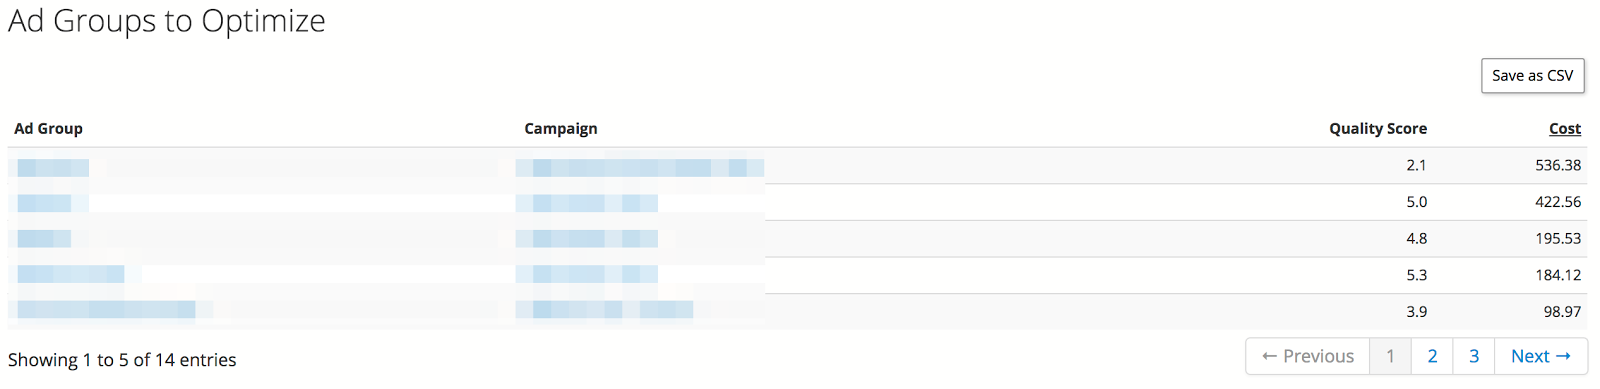
Optmyzr even recommends which ad groups would most benefit from optimization by doing a weighted sort on cost and low QS.
Optmyzr recommends ad groups to optimize for Quality Score based on the possible financial upside.
#3: Optmyzr visualizations make QS easier to understand
We’ve always believed that historical QS change is a useful metric to inform advertisers whether Google likes the optimizations they are doing or not. As a PPC optimization company, this is obviously an important criteria for us and our customers to think about.
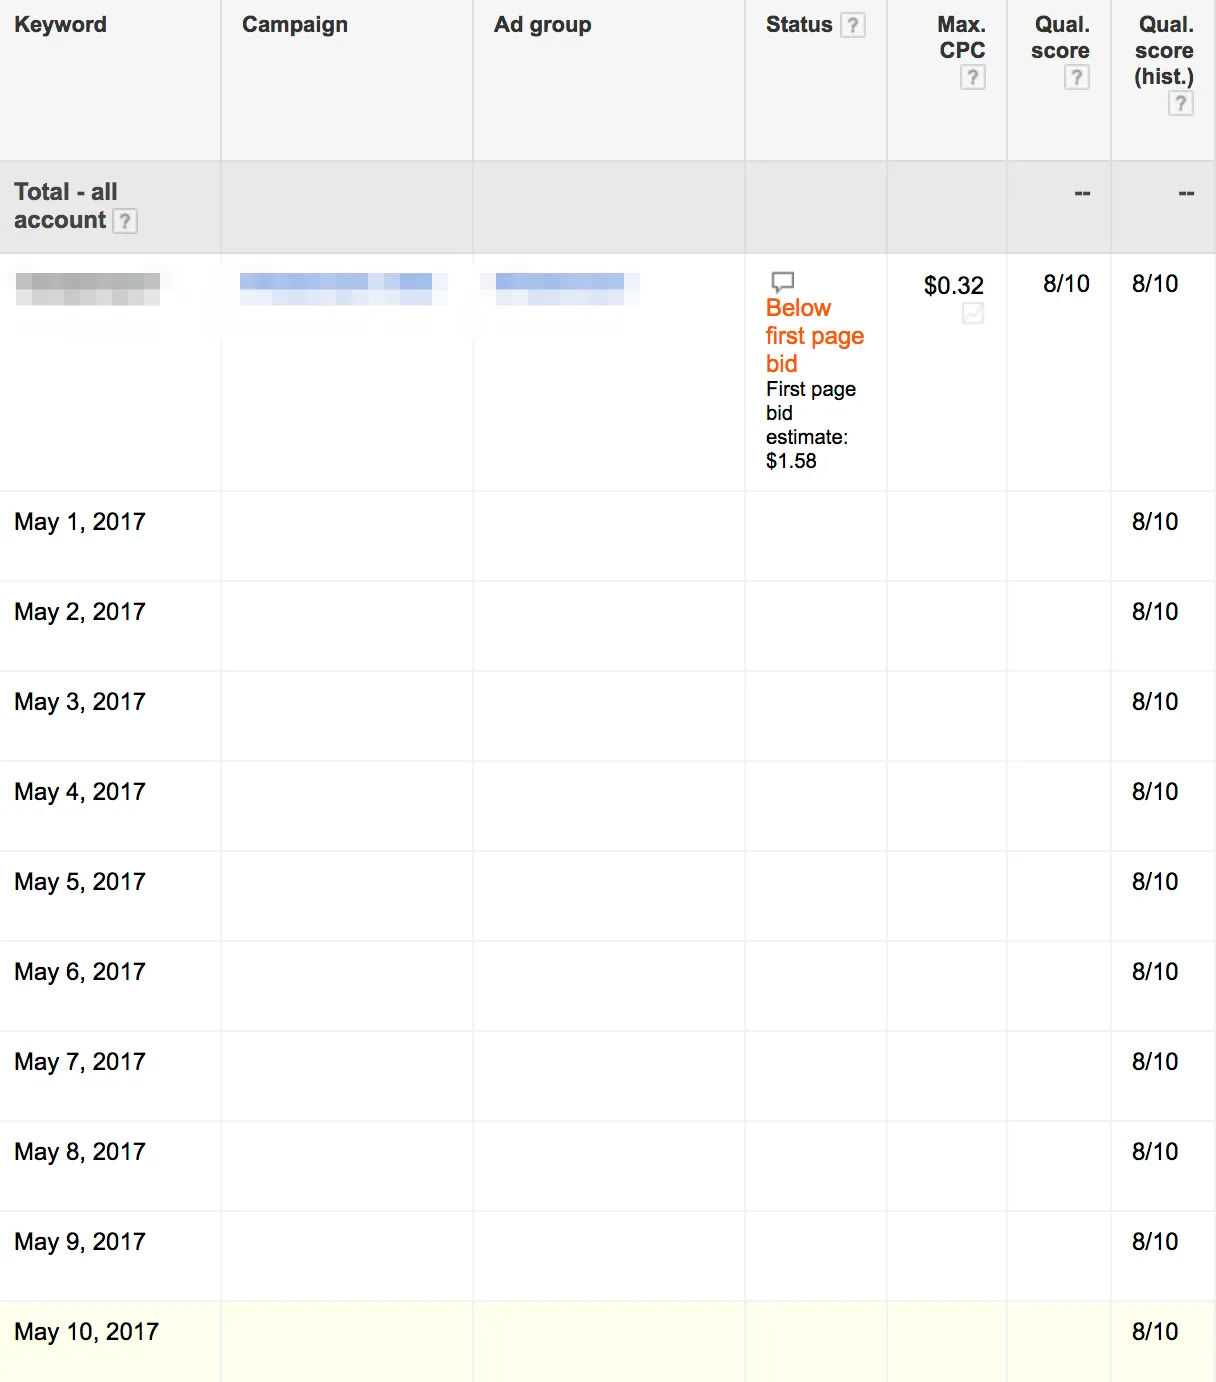
In AdWords, you can now see historical QS by day by applying a daily segment to the keyword data. But in the resulting table it’s pretty difficult to see a pattern of change.
Optmyzr makes understanding and analyzing Quality Score data easier in several ways.
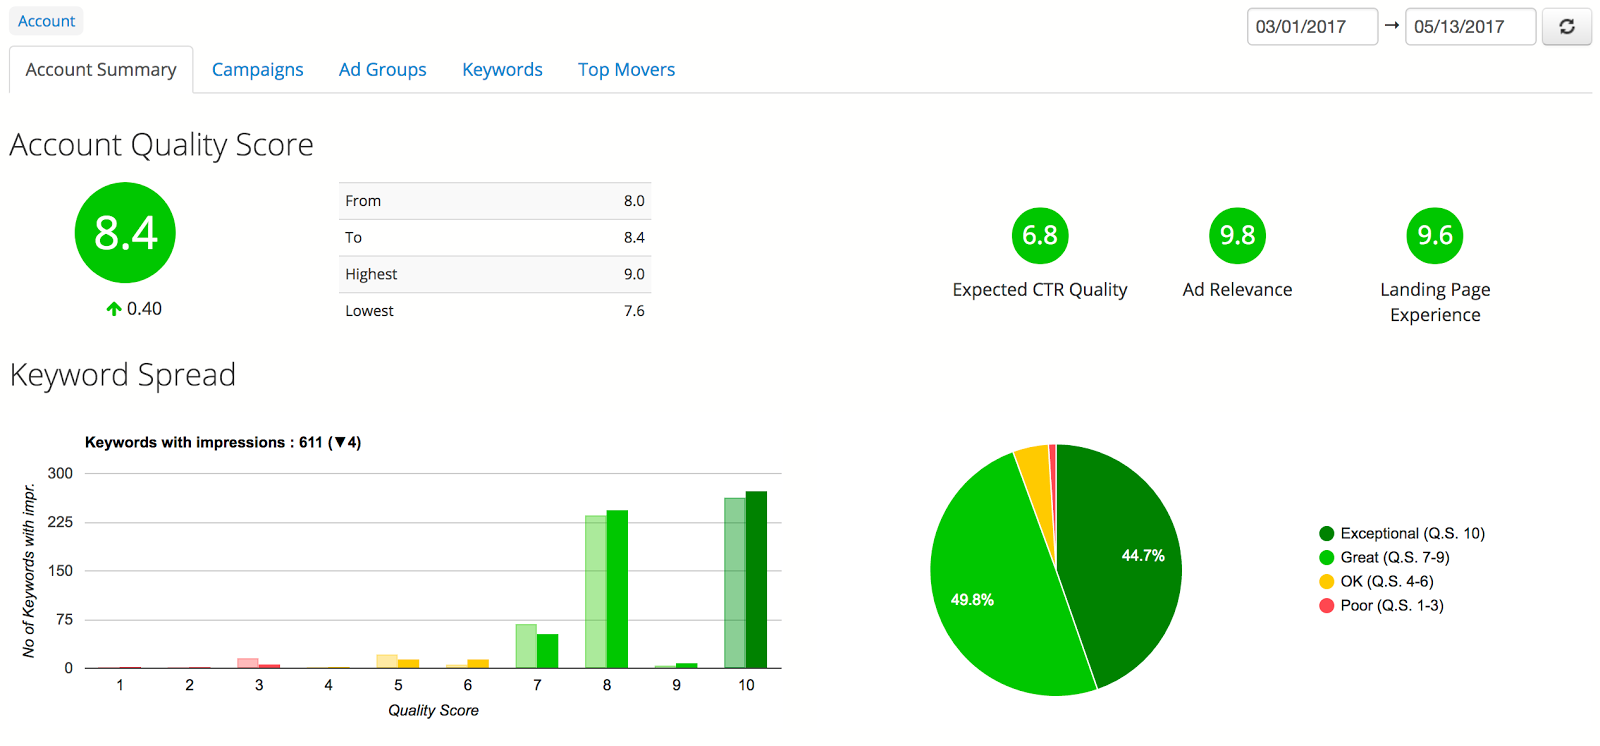
First, we provide a clean dashboard that shows the changes in QS between any 2 dates when the AdWords account was connected to Optmyzr. Here we have an example showing the account level Quality Score change between March 1, 2017 and May 13, 2017.
Quality Score dashboard gives quick insight into QS for an account or any of its campaigns or ad groups.
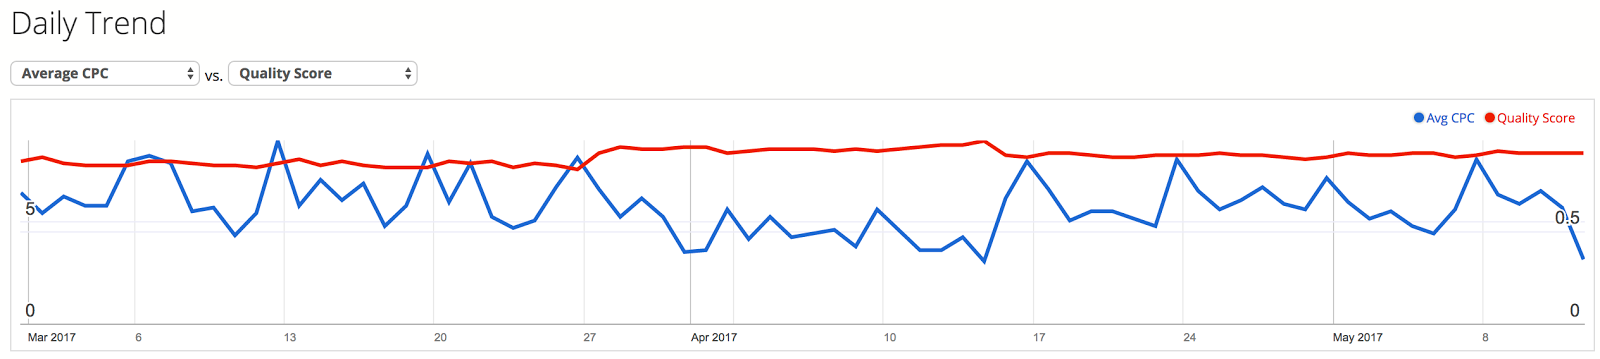
Next, unlike in AdWords where QS is not a value available for charts, Optmyzr does have time charts showing QS changes. This makes it really easy to see if QS changed during a particular date range.
See Quality Score changes visualized on a chart and instantly pick out important dates when changes happened.
#4: Optmyzr connects the dots on Quality Score impact
While the QS number 1 through 10 we see in accounts is based on position-normalized data, we can’t but wonder whether changes in bids, and the resulting changes in average position could have an impact on our QS. In Optmyzr, it’s very easy to investigate this question.
Optmyzr saves historical max CPC bids and lets you add this to a chart with Quality Score changes.
#5: Optmyzr includes Quality Score in automated reports
We could debate whether including AdWords jargon like QS in client reports is a good thing or not. However, we know that many advertisers like to include it in reports, and especially in reports used by consultants and agencies to audit prospective new clients.
Optmyzr lets you include Quality Score data in report templates. It can be shown either as a KPI value:
Or it can be shown as a time chart:
The time chart has several interesting settings. The curve can be smoothed by showing weekly or monthly data (in addition to the ability to show daily data).
Advertisers can even calculate the aggregate quality score for groups of campaigns by combining our campaign filters with campaign labels. For example, an advertiser can add a specific label to all their branded campaigns and then select this label in the report. There is no other way that we know of for advertisers to get quality score aggregation for portions of their accounts.
Change settings for how to include Quality Score in reports in Optmyzr’s report designer.
Conclusion
Optmyzr is excited that Quality Score is finally getting the treatment it deserves in the AdWords interface. With a renewed focus on QS, we hope advertisers will use Optmyzr’s unique capabilities related to QS to optimize their accounts.
The Quality Score Tracker is one of our most popular tools and we’ve just given it a makeover! We’ve added several new capabilities that we’re sure you’ll love.
See historical QS at a glance
We improved how we show historical QS by including the data for the first and last date of the selected date range on all views. We now also include the highest and lowest QS values from the selected period, giving you a better understanding of how your current QS compares with historical data.
Find areas of opportunity
Our new Top Movers table shows the campaigns, ad groups, and keywords that saw the most significant change in Quality Score for the selected date range. This makes it easier to find items whose QS has slowly declined and needs to be fixed. It also shows items whose QS has improved which may provide insights about the types of optimizations that are delivering results.
Find ad texts to fix
We added the Keyword Ad Relevance subcomponent of QS to keywords and also aggregated it at the account, campaign, and ad group levels. This makes it easy to find instances where you can improve QS by improving the ad text using tools like our AB Ad Testing tool or the Ad Template Report Enhanced Script.
See only the data you need
We added a text search box so that you can quickly hone in on just the keywords, ad groups, and campaigns that contain specific text.
A big change that we made to the Quality Score Tracker was that we now include impressions from all devices (mobile, desktops, tablets) on Google search to calculate the weighted impression share. Earlier, we were only using impression data from desktops on Google search. If you’re getting a lot of traffic from mobile, you’ll may notice a change in the account, campaign and ad group level Quality Scores.
We recently hosted a webinar about the recent changes in Quality Score with Convirza and they just posted the transcript of the Q&A we did at the end. Read it here…
If you’re interested in the topic of Quality Score and missed my 2 recent posts on this topic, here are the links:
If you looked at your AdWords account earlier this week, you may have noticed some very dramatic declines in Quality Score. I noticed it myself as I logged into my Optmyzr MCC dashboard where we show the account level Quality Scores for all the accounts. Normally I’d see changes in the range of +/- 0.2 but this time the changes were all down around 2 points!
See account-level Quality Score for all your accounts on a single page with Optmyzr’s MCC Dashboard.
Of course, this got me very worried because clearly, Google had made some changes to the algorithm to cause this. Luckily it turns out that it was just a bug, so my QS was fine, it was just reported incorrectly. It’s at times like this though that I’m happy to have access to historical Quality Score through a tool like ours for a couple of reasons…
Reason #1: Verify the Quality Score bug has been corrected for your account
With Optmyzr’s Historical Quality Score Tracker, I can check if and when Google has fixed the Quality Score bug. Here you can see that by now my QS has returned to normal.
The MCC Dashboard shows that account-level Quality Score has not changed much for most accounts under management over the past week.
Reason #2: Find and fix the cause of quality score declines
If this had not been a bug, I could have used the QS Tracker to identify the elements of my account that were in the worst shape or that had dropped the most. In this example, the ad group “Navy Blue Sweaters” is recommended for optimization because even though it doesn’t have the worst QS in the account, it has the worst combination of spend and QS. Fixing this one would most likely raise QS for the entire account the most.
Find the ad groups in your account that would have the biggest impact on Quality Score if they were optimized.
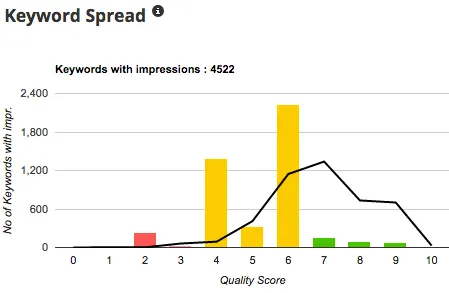
I could also get a sense of what type of QS change had taken place in the account with the chart that shows how many keywords exist at every QS level in my account. The graph shows both the number of keywords at each level for the start and end date of the selected date range.
The colored bars indicate the number of keywords at each Quality Score level at the end of the selected date range and the black line indicates the number at the start of the range. In this example, you can see a dramatic increase in keywords with a QS of 4 and 6.
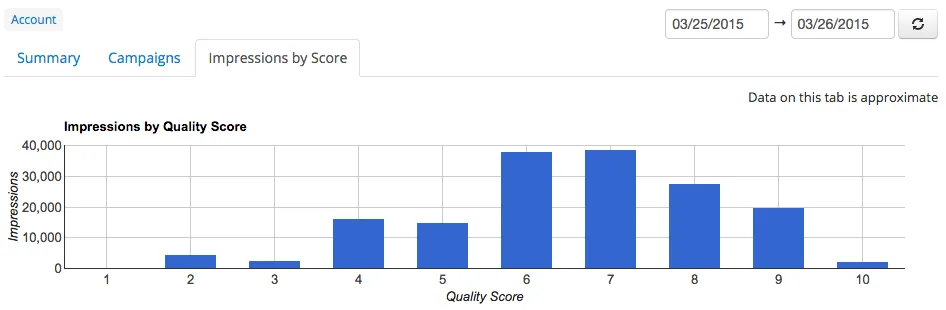
You could argue that just looking at the number of keywords with a low QS doesn’t tell you much because only keywords with lots of impressions contribute meaningfully to the account QS… and you’d be correct! That’s why we also include a visualization showing how many impressions happened at each QS level, helping you hone in on the keywords that are most in need of a fix.
Find out how many impressions in your account come at each level of Quality Score.
Update #1 – March 30, 2015
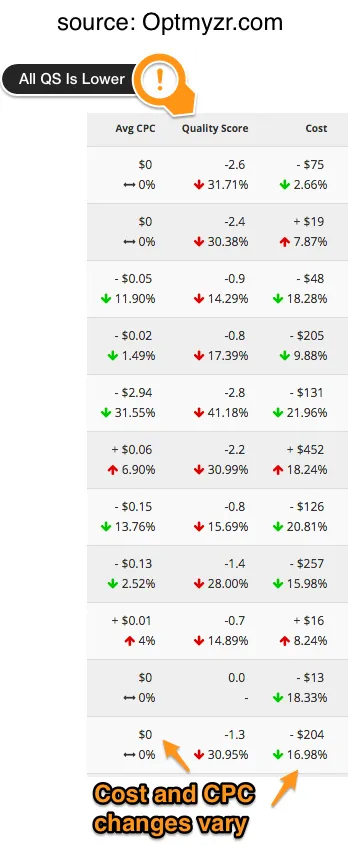
Advertisers report an increase in costs as a result of this bug. What I’ve seen in a handful of accounts I manage through Optmyzr is that there is no clear impact on CPC or cost. While all accounts seem to have been affected by the QS bug and have big QS drops, the costs and average CPCs are sometimes up, down, or unchanged.
While the Quality Score is always down, costs and CPCs are a mixed bag.
I recently came across a video from Isaac Rudansky (one of our customers) where he does a great job explaining how AdWords Quality Score works. Isaac’s video is factual, yet entertaining. If you’ve ever wondered how QS works, why you should care about it, and how to use tools like Optmyzr to improve it, take a look at this video.
If you’re more inclined to read an article on the topic, here is a post I wrote for SearchEngineJournal last year:
One of the first tools built by Optmyzr was a Quality Score Tracker that lets you to see your account level quality score, and track historical quality scores of individual keywords.
One of the more recent tools that we built, and one that I was specifically responsible for, is the multi-client center (MCC) dashboard, where advertisers can get a quick view of all of their accounts, including recent stats as well as trends.
I’m excited to announce that we’ve just merged these two capabilities: now you can see account level quality score directly on the MCC dashboard. Not only can you see the current quality score for the account, but you can also see how it has changed from one period to the next.
See the account-level Quality Score for all the AdWords accounts you manage on a single page
See the percent change of the account-level Quality Scores for all your accounts on one screen.
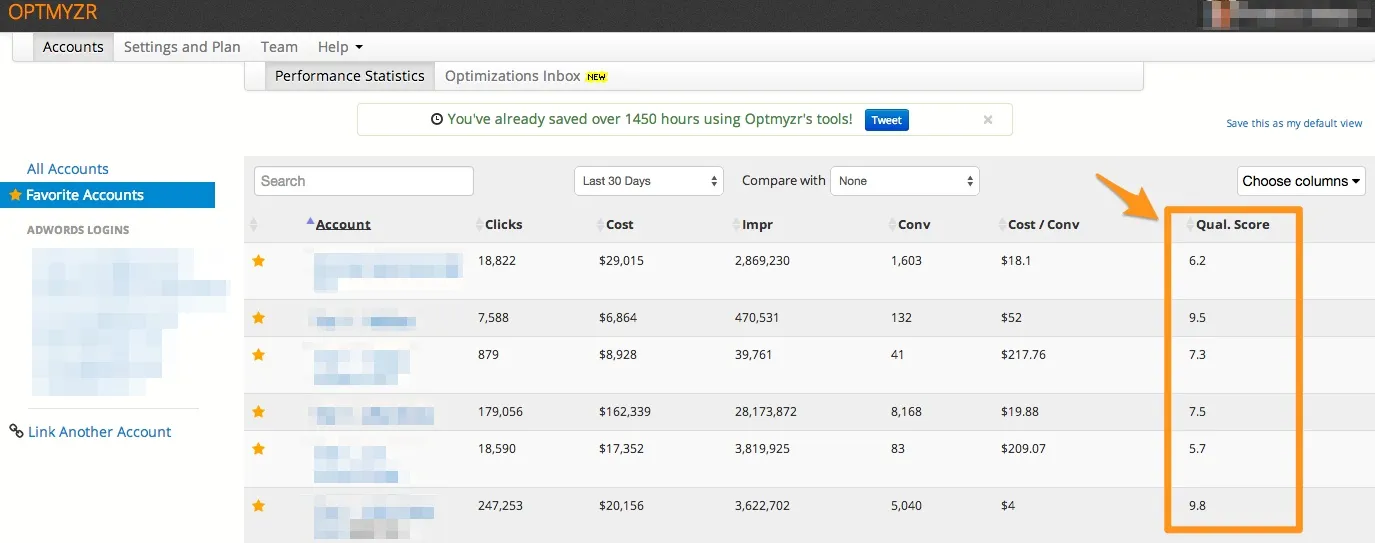
If you’ve read any of my blog posts about AdWords Quality Score (QS) or seen any of my presentations at SMX, SES, or PubCon, you should already be familiar with the importance of the AdWords account-level QS. It’s Google’s measure of how relevant the keywords in an account typically are and it’s a major factor in determining how much an advertiser has to pay to get new keywords started in their account.
An account with great account-level QS has to pay a lower CPC than if it had poor QS to get the same ad rank for a new keyword. As soon as the new keyword has enough CTR data to establish its relevance, the account-level QS factor becomes far less important.
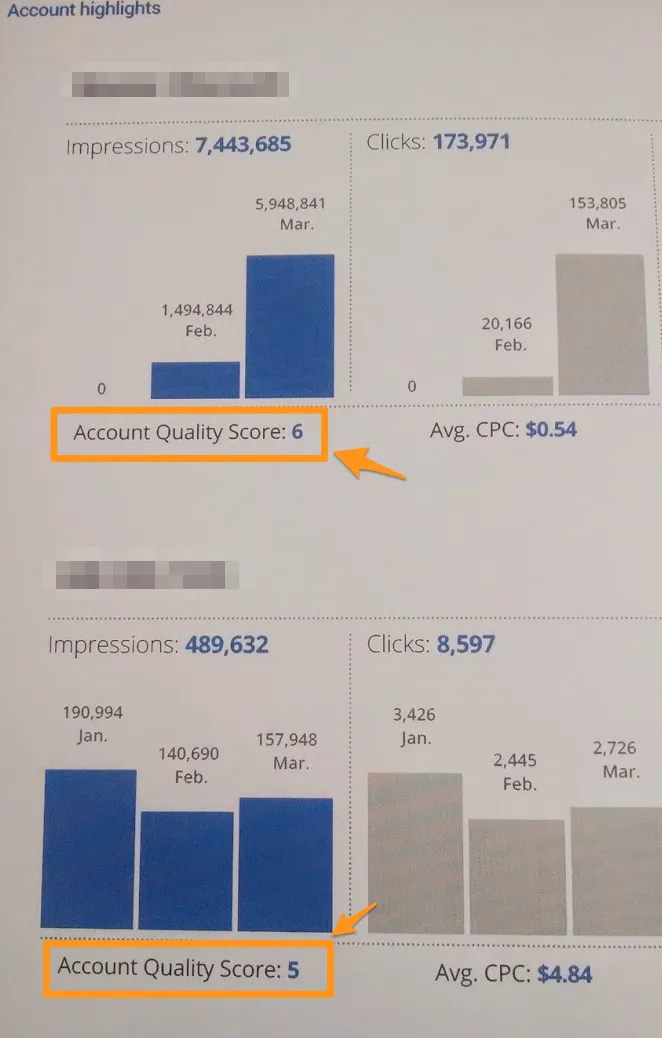
The thing is that Google has never disclosed what the account’s QS is… until now! I just received a booklet from the Google Partners team with data for a few accounts that are under my MCC and while it’s so subtle I originally didn’t notice it, there is an account Quality Score published for each account!
So I immediately went to our Optmyzr Quality Score Tracker to see how Google’s numbers compare to the ones we’ve been calculating and reporting to our customers for nearly a year now. The good news is that they match up very closely. We are somewhat limited in how we can calculate the QS number but it seems our formula is pretty close to the one Google uses and for all accounts I checked, we were within 1 point of what Google said. Because Google rounds to an integer and their number is for the entire quarter, that’s as close as I think we could get.
Google Partners started to report the account Quality Score in a booklet they send agencies.
Getting a high position on Google’s search results page is a key component of getting lots of visitors to your site but how do you get that great position for your ad without spending too much?
The way AdWords ranks ads is based on two main components: your bid and your quality score. Because the position of the ad is not based on the bid alone, something crazy sometimes happens… the ad in the highest position could be paying less for a click than the ads below it. That’s right, advertisers who know how to get a great quality score pay less than everyone else!
Here’s one of many examples we’ve seen where even a small increase in QS has a big impact on the average CPC an advertiser is paying.
So let’s take a look at how quality score works and how you can use it to your advantage to decrease your advertising costs.
How to pay less for new keywords in AdWords?
When you add new keywords to your account, Google has to make an educated guess about what value to set for the initial Quality Score. If you can figure out how to get the highest possible starting QS right out of the gates, you’ll pay less for your initial clicks.
So here’s how to get a better starting QS for new keywords: optimize your account QS by fixing the keywords that get a ton of impressions and have a QS that’s below the average for the account. But since Google doesn’t tell you what your account QS is, how do you put this advice into action? My favorite tool for monitoring account QS is Optmyzr (but I may be biased). It even gives me a prioritized lists of ad groups that I should optimize to boost my account QS. Other options include AdWords Scripts and some other SEM tools so research what option makes the most sense for your situation.
If you want to better understand the way Google uses data to set QS, take a look at the following.
To guess your starting QS, they look at the historical performance of a few things they may already know: your account QS, your typical performance for ads with a certain URL, and the performance of other advertisers for the keyword you’re adding. The following diagram represents the major components the AdWords system evaluates when determining quality score.
As you can see, there are 3 main factors: the account, the keyword and the ad. The ad component consists of sub-components including the ad text and the visible URL.
The QS algorithm’s goal is to predict the CTR for a particular ad impression based on historical data. It uses these 3 factors individually and also in combination with each other. Factor 1 represents how a keyword has performed in a particular account. Factor 2 represents how an ad text and its components have performed in a particular account and factor 3 represents how a particular keyword has performed with a particular ad text.
How to pay less for keywords you’ve had for a long time?
After at most 1,000 impressions for a keyword, AdWords has more than enough data to make a statistically sound judgment about the QS. Instead of relying on generic data like account QS, it can now use data about how the keyword performed with its ad text. If your keyword’s CTR is too low, that’s an indication to Google that users are not finding the ad relevant for that keyword. So your best bet is to either make the keyword more specific, for example by turning the keyword ‘dog’ into ‘dog food’ or by moving the keyword into a separate ad group with an ad text tailored for just this keyword. It simply comes down to finding a way to convince users to click your ad more frequently.
To improve QS, make your keywords more specific and improve your account structure by creating smaller and more tightly themed ad groups, each with ads tailored to the small set of keywords.
As a general best practice, I like to keep ad groups to no more than 20 keywords. While it’s not a hard and fast rule, I find that ad groups with more than 20 keywords can usually be split up into several smaller ad groups.
What about Landing Page Quality Score?
Landing Page Quality Score is an element AdWords started to consider because some advertisers had figured out how to game QS by writing must-click ads but then not delivering on the promise of the ad. For example, it’s really easy to get a high CTR by telling users they can get a free tablet for clicking an ad. But once they click, that promise usually turns out to be a scam.
It’s important to understand that this is why LPQ was introduced. While it can now boost the QS, it was originally intended to weed out bad advertisers. But it’s not a big component of QS. I say this because some advertisers believe they can get a better QS by creating unique landing pages for every keyword and while there’s nothing wrong with that, it’s probably not the best way to spend your limited time and resources. Focusing on highly relevant ads that get great CTRs is still the best way to boost QS.
You’ve done your keyword research, narrowed down your top keywords, written compelling ad copy, and created a great landing page for what you’re selling. But you find out your Quality Score is below average.
Improving your quality score increases your ad’s position and as a result, increases its landing page visibility. It’s also an indicator that your ad is relevant and doing well.
Quality Score was and continues to be the key way to understand what Google thinks of the quality and relevance of your ads.
Automation backed by machine learning delivers good results, but it can’t do much about relevance problems, so focusing on relevant ads will improve your performance further.
A better Quality Score always has and always will help you save money.
Time to move on to the meat and potatoes of this post. Don’t worry though, I’d never leave you hanging.
5 Ways to Improve Quality Score
1. Use Optmyzr’s Quality Score Tracker
That’s not to say that you can’t use what Google gives you, but our team uses Optmyzr to track our quality scores. Why? Because when you have as many accounts as we do (I work for a digital ad agency) with dozens of campaigns, ad groups, ads, and keywords in play at the same time, we need all the help we can get in order to quickly pinpoint the areas we need to focus on the most.
We’ve worked the Quality Score Tracker into our daily process and our clients are way better off because of it. We’ve also learned that this is a great tool to show clients. Granted, there is some debate out there about whether quality score is a good metric to show a client or not but with the way we do things, it’s great.
We like to teach our clients because we believe that a learned client is a lifelong client and, as long as they understand what kind of return on ad spend (ROAS) they are getting, one who understands the benefits of larger paid search budgets
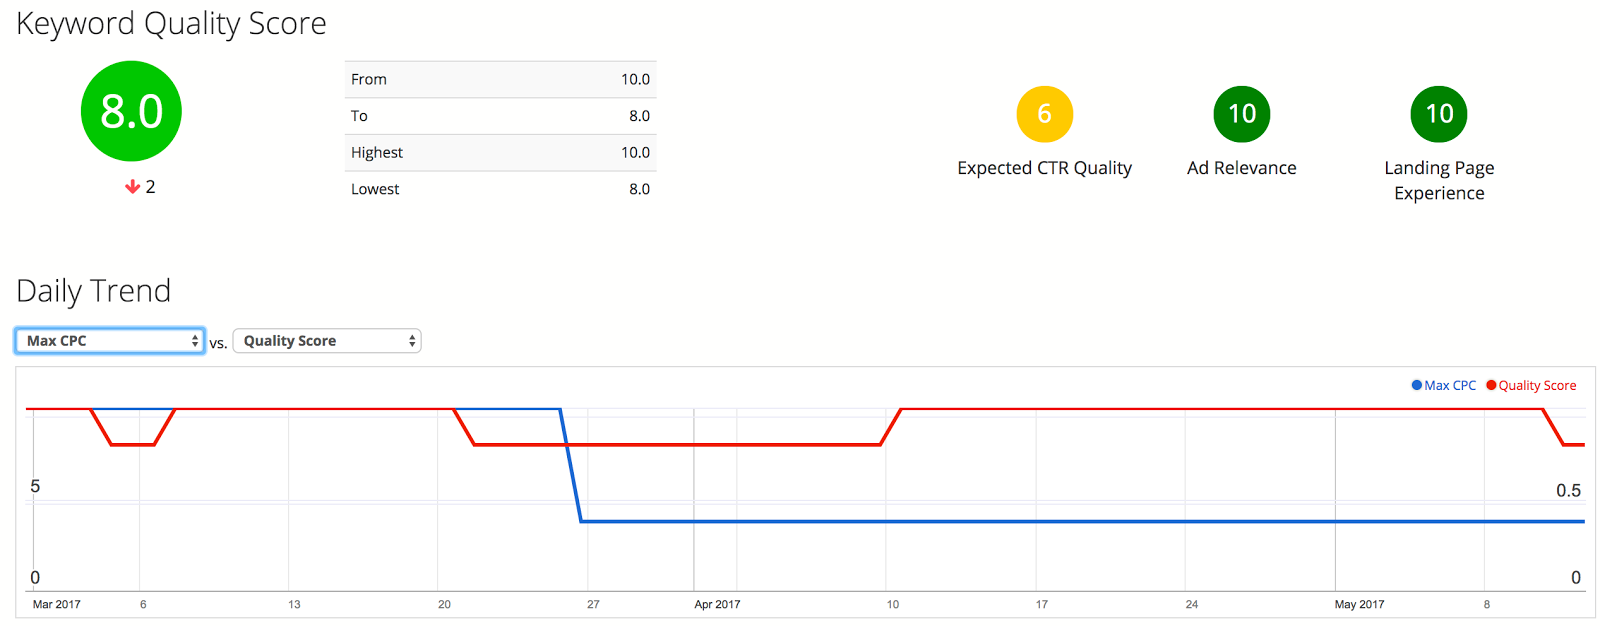
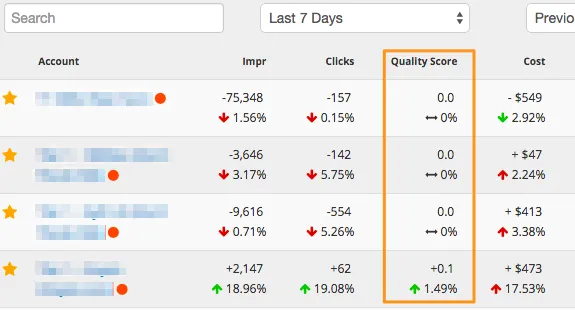
Below is a real screen-shot of a dealership client of ours:
Right off the bat, we can see where the issue is. Overall, the account quality score is good at 7.7 but as we all know, there’s always room for improvement. That red circle on the top left stands out, doesn’t it?
Clicking into it we can see the offending ad group in addition to the offending keywords. We can even see the quality score over time. Below where it says Daily Trend (bottom of image) there is a line graph that tells you exactly when the quality score dipped.
Armed with that knowledge, I’m able to go into Google Ads and see that the ad was wrong. While the ad had been changed to include the year of the vehicle, the keywords for this particular ad group didn’t include that information.
Since the keywords being bid on didn’t match the ad and, of course, the landing page when the ad was clicked on didn’t match the ad, the quality score went down.
This took just a few minutes to find and then correct.
2. Use Long Tail Keywords – Expected CTR Quality & Ad relevance
Competitive keywords can be difficult to manage in both organic and paid search, especially in the more competitive industries, which is why you should always be picky about the keywords you use. With long-tail keywords, you can be more specific and specificity equals a higher conversion rate, less cost per click, and a higher expected click-through rate.
If you really want to take the whole superhuman CTR thing to the next level then think about using single keyword ad groups (SKAGs). True, these may take a bit more work to implement but your CTR will thank you.
There are more than a few reasons why you’d want to take a closer look at SKAGs and I encourage you to if you aren’t familiar with them or haven’t tried them yet. One of the main reasons why SKAGs work so well is because they are so very relevant. Using SKAGs you can ensure that every keyword used (don’t forget about long-tail here) is in the ad copy of the ad.
Yes, you can use dynamic keyword insertion for this, but for more flexibility, try SKAGs.
Negative keywords are your friends. For some reason, negative keywords are easy to overlook, but they should be paid close attention to. The search term report will show you the holes that need to be plugged. Plug them, but keep checking back to make sure another leak hasn’t sprung.
3. Use EVERY Ad Extension possible – Expected CTR Quality & Ad relevance
I see a lot of accounts once we take them over from another agency and it always confuses me as to why more ad extensions aren’t used. Not only do they give your ad more bling, but they also take up more space (this is really good on mobile), increase relevancy and drive up the click-through rate.
I understand that not all ad extensions will be relevant in every case, but use all that makes sense. Yes, some are more time-consuming than others but the more you use the better your ads will perform.
Take a look at the price extension. Can you use it? Then do it. It takes up a ton of space on mobile and can really drive your competitors down. Recently, Google announced that price extensions are now available on all devices.
Again, they take up a lot of space and, on desktop, look really cool. Need more of that bling I mentioned earlier? Well, here you go.
Also, make sure that you’re at least using location extensions (if you have a physical location), call extensions, structured snippets, site links, call-outs, and the message extension.
Sound like a lot? This is just the tip of the extension iceberg, make sure to use as many as you can. When it comes to extensions, remember that more specific is better. What I mean by that is that you can add account-level extensions but you’ll see better success if you narrow it down to the campaign level or, better yet, the ad group level.
Just remember to keep your eye on the prize, a better quality score.
4. Ongoing Ad Optimization – Expected CTR Quality & Ad relevance
One ad per ad group isn’t enough, neither are two. Google recommends at least 3 per ad group. The best way to get the best performing ads is by doing A/B split testing, even if you are using SKAGs. Also, think about copywriting and how you can turn a boring ad into a more compelling ad that invites a click.
The best way to ensure that your ads are highly targeted is to always write each one from scratch. Never stagnate, always try to beat your best performing ads by writing even more compelling copy for the next ad.
If you have long-tail keywords going to a highly converting ad then you are well on your way to increasing your click-through rate and your ad relevance.
5. Take a long hard look at your landing pages – Landing page experience
You wouldn’t send an ad about toothpaste to a page selling candy, would you? Rhetorical question, but sometimes it takes an absurd question to drive a point home. My point is that you should be as obsessed with making your landing page match the ad as you are about the ad matching the keyword.
That’s a great start but you need to go further than that.
First, make sure the landing page looks just as good on mobile as on desktop. Pay close attention to the speed of the page because Google has gone on record saying that 53% of smartphone users will abandon a web page if the site takes more than 3 seconds to load.
3 Seconds! Couple that with a recent study that shows we have an average attention span of just 8 seconds (1 second less than a goldfish) and you have a recipe for disaster if you aren’t careful.
While I won’t be going into depth about landing pages in this post I think it’s important to ensure that your landing page has a call to action. What’s a call to action? Anything that gets people to act on whatever it is that you want them to do. It can be a lead form submission, a download, a phone call or even watching a video.
Whatever it is it has to be very easy to do. Making people jump through hoops won’t lead to conversion. Having said that, if it’s not feasible to put the final call to action on the actual landing page, then you must make sure that your site is easy to navigate with a clear path to your desired conversion.
Take a long hard look at your landing page data and pay particular attention to what is happening in analytics. Are they converting? Are they following the path you’ve laid out for them? If not, why not? Take a look at the data from both the desktop and mobile perspective, is anything off? If so, fix it.
Don’t stop there
Keep optimizing. Don’t let your account, or your client’s account, slowly die. Stay active, make adjustments regularly, and become obsessed with raising the bar. Never stop until the bar is as high as it can possibly go. There has been a lot of talk over the years, even research done on the importance of account activity. So, stay active my friends.
This is a guest post. The views and opinions expressed by the author are solely their own and do not represent that of Optmyzr.
Today Google announced the addition of seven new Quality Score (QS) fields in AdWords, including historical QS. It goes without saying that we’re big fans of giving advertisers access to this data. After all, Optmyzr’s first major tool was the historical QS tracker we launched in the summer of 2013. Ever since then we’ve tracked billions of points of data to help advertisers make more sense of their Quality Scores.
Is there a need to continue to use tools for QS tracking now that Google is providing the same functionality directly in AdWords?
Like Jacob from our friends at Hanapin says, it’s definitely nice that any advertiser can now get the data, without needing to resort to tools, or AdWords Scripts. But there are some significant benefits you get from using Optmyzr to track QS. Here are 5 things you can do with Quality Score in Optmyzr that you can’t in AdWords.
#1: Optmyzr helps you prioritize Quality Scores to fix
While AdWords now includes both the current and historical QS, it doesn’t have a column for letting you see the difference between these two numbers. That may seem trivial but when dealing with hundreds or thousands of keywords, it’s nice to have a simple way to find keywords with the biggest increase or decrease in QS.
Optmyzr’s Quality Score Tracker includes a column called QS Change. It shows the numerical difference between the QS on the start and end date of the selected range. By clicking on this column, it’s very easy to find keywords with the biggest drop in Quality Score. It’s a great tool to identify the keywords most in need of some attention.
The column “QS Change” makes it easy to see which items had the biggest change between 2 dates.
#2: Optmyzr shows aggregate QS and account QS
It’s easy to focus your attention in the wrong place if you’re not taking volume into consideration. For example, look at the screenshot in the last paragraph and notice that the keyword with the biggest decline in QS had 18 impressions. It might be possible to improve that keyword’s Quality Score, but how much will that really benefit the account?
That’s why Optmyzr has always provided aggregate QS in the form of an impression-weighted account-level quality score, as well as campaign-QS and ad group-QS.
This helps advertisers focus on making changes in the places that can have the biggest payoff. For example, here’s where the biggest QS improvements are in this account. Because it’s aggregated at the ad group level, there is more data, making the insights more meaningful.
See which ad groups had the biggest gains in Quality Score.
Optmyzr even recommends which ad groups would most benefit from optimization by doing a weighted sort on cost and low QS.
Optmyzr recommends ad groups to optimize for Quality Score based on the possible financial upside.
#3: Optmyzr visualizations make QS easier to understand
We’ve always believed that historical QS change is a useful metric to inform advertisers whether Google likes the optimizations they are doing or not. As a PPC optimization company, this is obviously an important criteria for us and our customers to think about.
In AdWords, you can now see historical QS by day by applying a daily segment to the keyword data. But in the resulting table it’s pretty difficult to see a pattern of change.
Optmyzr makes understanding and analyzing Quality Score data easier in several ways.
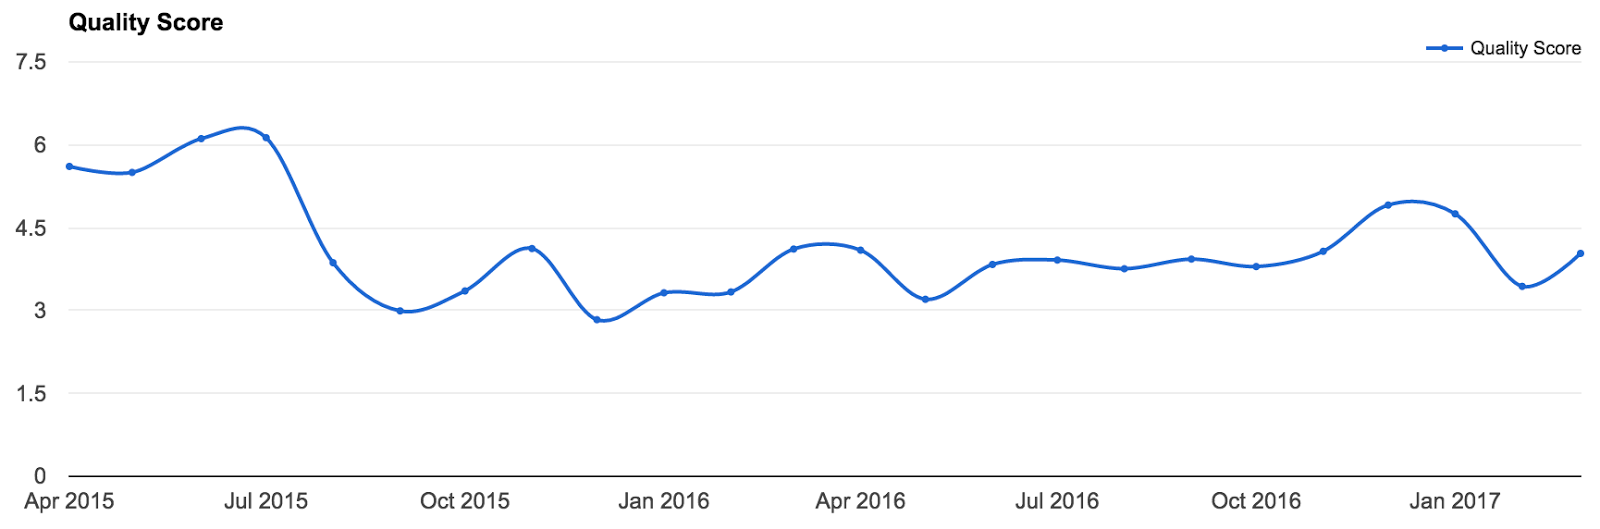
First, we provide a clean dashboard that shows the changes in QS between any 2 dates when the AdWords account was connected to Optmyzr. Here we have an example showing the account level Quality Score change between March 1, 2017 and May 13, 2017.
Quality Score dashboard gives quick insight into QS for an account or any of its campaigns or ad groups.
Next, unlike in AdWords where QS is not a value available for charts, Optmyzr does have time charts showing QS changes. This makes it really easy to see if QS changed during a particular date range.
See Quality Score changes visualized on a chart and instantly pick out important dates when changes happened.
#4: Optmyzr connects the dots on Quality Score impact
While the QS number 1 through 10 we see in accounts is based on position-normalized data, we can’t but wonder whether changes in bids, and the resulting changes in average position could have an impact on our QS. In Optmyzr, it’s very easy to investigate this question.
Optmyzr saves historical max CPC bids and lets you add this to a chart with Quality Score changes.
#5: Optmyzr includes Quality Score in automated reports
We could debate whether including AdWords jargon like QS in client reports is a good thing or not. However, we know that many advertisers like to include it in reports, and especially in reports used by consultants and agencies to audit prospective new clients.
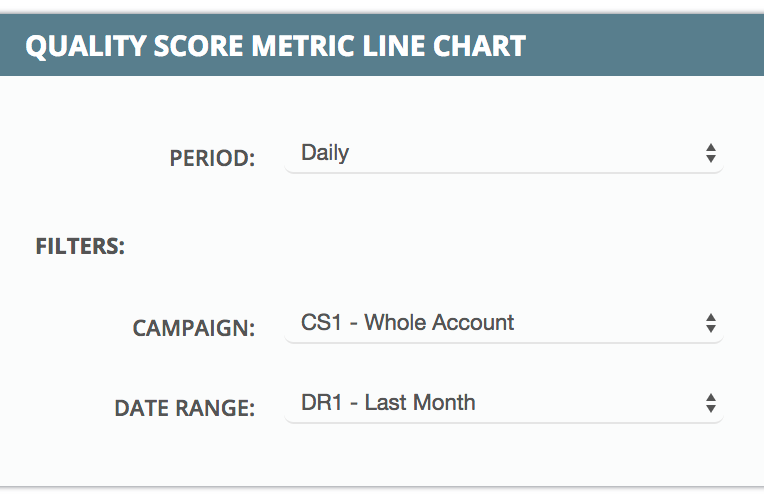
Optmyzr lets you include Quality Score data in report templates. It can be shown either as a KPI value:
Or it can be shown as a time chart:
The time chart has several interesting settings. The curve can be smoothed by showing weekly or monthly data (in addition to the ability to show daily data).
Advertisers can even calculate the aggregate quality score for groups of campaigns by combining our campaign filters with campaign labels. For example, an advertiser can add a specific label to all their branded campaigns and then select this label in the report. There is no other way that we know of for advertisers to get quality score aggregation for portions of their accounts.
Change settings for how to include Quality Score in reports in Optmyzr’s report designer.
Conclusion
Optmyzr is excited that Quality Score is finally getting the treatment it deserves in the AdWords interface. With a renewed focus on QS, we hope advertisers will use Optmyzr’s unique capabilities related to QS to optimize their accounts.
The Quality Score Tracker is one of our most popular tools and we’ve just given it a makeover! We’ve added several new capabilities that we’re sure you’ll love.
See historical QS at a glance
We improved how we show historical QS by including the data for the first and last date of the selected date range on all views. We now also include the highest and lowest QS values from the selected period, giving you a better understanding of how your current QS compares with historical data.
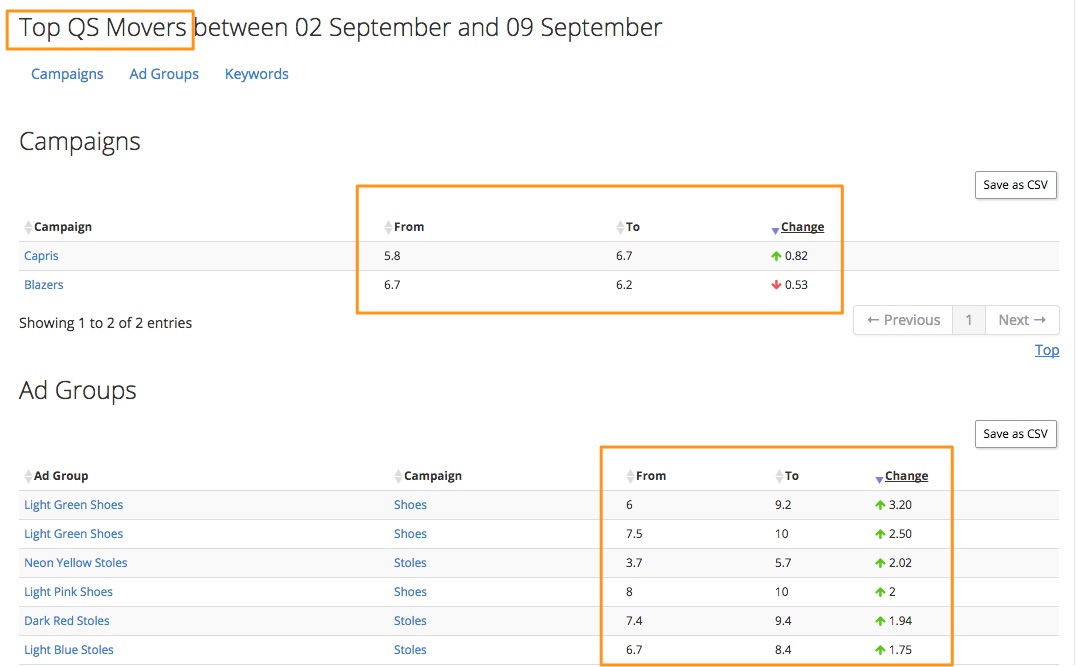
Find areas of opportunity
Our new Top Movers table shows the campaigns, ad groups, and keywords that saw the most significant change in Quality Score for the selected date range. This makes it easier to find items whose QS has slowly declined and needs to be fixed. It also shows items whose QS has improved which may provide insights about the types of optimizations that are delivering results.
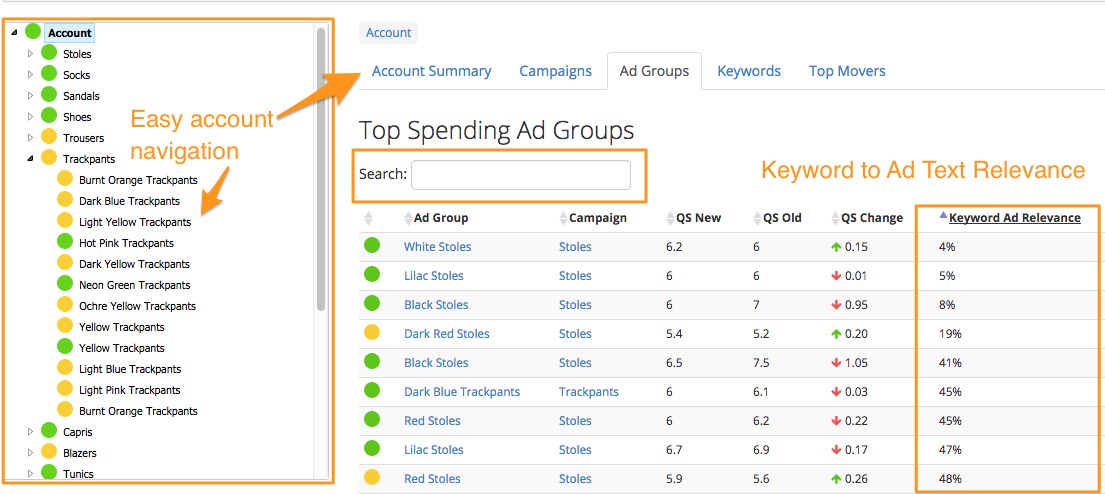
Find ad texts to fix
We added the Keyword Ad Relevance subcomponent of QS to keywords and also aggregated it at the account, campaign, and ad group levels. This makes it easy to find instances where you can improve QS by improving the ad text using tools like our AB Ad Testing tool or the Ad Template Report Enhanced Script.
See only the data you need
We added a text search box so that you can quickly hone in on just the keywords, ad groups, and campaigns that contain specific text.
A big change that we made to the Quality Score Tracker was that we now include impressions from all devices (mobile, desktops, tablets) on Google search to calculate the weighted impression share. Earlier, we were only using impression data from desktops on Google search. If you’re getting a lot of traffic from mobile, you’ll may notice a change in the account, campaign and ad group level Quality Scores.
We recently hosted a webinar about the recent changes in Quality Score with Convirza and they just posted the transcript of the Q&A we did at the end. Read it here…
If you’re interested in the topic of Quality Score and missed my 2 recent posts on this topic, here are the links:
If you looked at your AdWords account earlier this week, you may have noticed some very dramatic declines in Quality Score. I noticed it myself as I logged into my Optmyzr MCC dashboard where we show the account level Quality Scores for all the accounts. Normally I’d see changes in the range of +/- 0.2 but this time the changes were all down around 2 points!
See account-level Quality Score for all your accounts on a single page with Optmyzr’s MCC Dashboard.
Of course, this got me very worried because clearly, Google had made some changes to the algorithm to cause this. Luckily it turns out that it was just a bug, so my QS was fine, it was just reported incorrectly. It’s at times like this though that I’m happy to have access to historical Quality Score through a tool like ours for a couple of reasons…
Reason #1: Verify the Quality Score bug has been corrected for your account
With Optmyzr’s Historical Quality Score Tracker, I can check if and when Google has fixed the Quality Score bug. Here you can see that by now my QS has returned to normal.
The MCC Dashboard shows that account-level Quality Score has not changed much for most accounts under management over the past week.
Reason #2: Find and fix the cause of quality score declines
If this had not been a bug, I could have used the QS Tracker to identify the elements of my account that were in the worst shape or that had dropped the most. In this example, the ad group “Navy Blue Sweaters” is recommended for optimization because even though it doesn’t have the worst QS in the account, it has the worst combination of spend and QS. Fixing this one would most likely raise QS for the entire account the most.
Find the ad groups in your account that would have the biggest impact on Quality Score if they were optimized.
I could also get a sense of what type of QS change had taken place in the account with the chart that shows how many keywords exist at every QS level in my account. The graph shows both the number of keywords at each level for the start and end date of the selected date range.
The colored bars indicate the number of keywords at each Quality Score level at the end of the selected date range and the black line indicates the number at the start of the range. In this example, you can see a dramatic increase in keywords with a QS of 4 and 6.
You could argue that just looking at the number of keywords with a low QS doesn’t tell you much because only keywords with lots of impressions contribute meaningfully to the account QS… and you’d be correct! That’s why we also include a visualization showing how many impressions happened at each QS level, helping you hone in on the keywords that are most in need of a fix.
Find out how many impressions in your account come at each level of Quality Score.
Update #1 – March 30, 2015
Advertisers report an increase in costs as a result of this bug. What I’ve seen in a handful of accounts I manage through Optmyzr is that there is no clear impact on CPC or cost. While all accounts seem to have been affected by the QS bug and have big QS drops, the costs and average CPCs are sometimes up, down, or unchanged.
While the Quality Score is always down, costs and CPCs are a mixed bag.
I recently came across a video from Isaac Rudansky (one of our customers) where he does a great job explaining how AdWords Quality Score works. Isaac’s video is factual, yet entertaining. If you’ve ever wondered how QS works, why you should care about it, and how to use tools like Optmyzr to improve it, take a look at this video.
If you’re more inclined to read an article on the topic, here is a post I wrote for SearchEngineJournal last year:
One of the first tools built by Optmyzr was a Quality Score Tracker that lets you to see your account level quality score, and track historical quality scores of individual keywords.
One of the more recent tools that we built, and one that I was specifically responsible for, is the multi-client center (MCC) dashboard, where advertisers can get a quick view of all of their accounts, including recent stats as well as trends.
I’m excited to announce that we’ve just merged these two capabilities: now you can see account level quality score directly on the MCC dashboard. Not only can you see the current quality score for the account, but you can also see how it has changed from one period to the next.
See the account-level Quality Score for all the AdWords accounts you manage on a single page
See the percent change of the account-level Quality Scores for all your accounts on one screen.
If you’ve read any of my blog posts about AdWords Quality Score (QS) or seen any of my presentations at SMX, SES, or PubCon, you should already be familiar with the importance of the AdWords account-level QS. It’s Google’s measure of how relevant the keywords in an account typically are and it’s a major factor in determining how much an advertiser has to pay to get new keywords started in their account.
An account with great account-level QS has to pay a lower CPC than if it had poor QS to get the same ad rank for a new keyword. As soon as the new keyword has enough CTR data to establish its relevance, the account-level QS factor becomes far less important.
The thing is that Google has never disclosed what the account’s QS is… until now! I just received a booklet from the Google Partners team with data for a few accounts that are under my MCC and while it’s so subtle I originally didn’t notice it, there is an account Quality Score published for each account!
So I immediately went to our Optmyzr Quality Score Tracker to see how Google’s numbers compare to the ones we’ve been calculating and reporting to our customers for nearly a year now. The good news is that they match up very closely. We are somewhat limited in how we can calculate the QS number but it seems our formula is pretty close to the one Google uses and for all accounts I checked, we were within 1 point of what Google said. Because Google rounds to an integer and their number is for the entire quarter, that’s as close as I think we could get.
Google Partners started to report the account Quality Score in a booklet they send agencies.
Getting a high position on Google’s search results page is a key component of getting lots of visitors to your site but how do you get that great position for your ad without spending too much?
The way AdWords ranks ads is based on two main components: your bid and your quality score. Because the position of the ad is not based on the bid alone, something crazy sometimes happens… the ad in the highest position could be paying less for a click than the ads below it. That’s right, advertisers who know how to get a great quality score pay less than everyone else!
Here’s one of many examples we’ve seen where even a small increase in QS has a big impact on the average CPC an advertiser is paying.
So let’s take a look at how quality score works and how you can use it to your advantage to decrease your advertising costs.
How to pay less for new keywords in AdWords?
When you add new keywords to your account, Google has to make an educated guess about what value to set for the initial Quality Score. If you can figure out how to get the highest possible starting QS right out of the gates, you’ll pay less for your initial clicks.
So here’s how to get a better starting QS for new keywords: optimize your account QS by fixing the keywords that get a ton of impressions and have a QS that’s below the average for the account. But since Google doesn’t tell you what your account QS is, how do you put this advice into action? My favorite tool for monitoring account QS is Optmyzr (but I may be biased). It even gives me a prioritized lists of ad groups that I should optimize to boost my account QS. Other options include AdWords Scripts and some other SEM tools so research what option makes the most sense for your situation.
If you want to better understand the way Google uses data to set QS, take a look at the following.
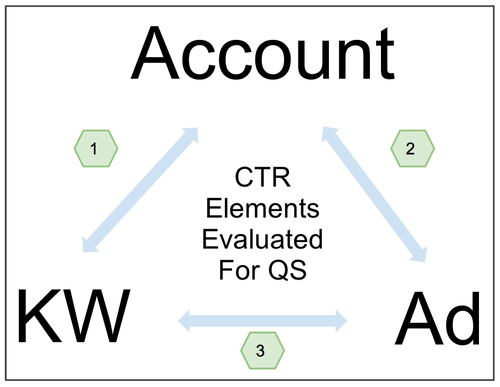
To guess your starting QS, they look at the historical performance of a few things they may already know: your account QS, your typical performance for ads with a certain URL, and the performance of other advertisers for the keyword you’re adding. The following diagram represents the major components the AdWords system evaluates when determining quality score.
As you can see, there are 3 main factors: the account, the keyword and the ad. The ad component consists of sub-components including the ad text and the visible URL.
The QS algorithm’s goal is to predict the CTR for a particular ad impression based on historical data. It uses these 3 factors individually and also in combination with each other. Factor 1 represents how a keyword has performed in a particular account. Factor 2 represents how an ad text and its components have performed in a particular account and factor 3 represents how a particular keyword has performed with a particular ad text.
How to pay less for keywords you’ve had for a long time?
After at most 1,000 impressions for a keyword, AdWords has more than enough data to make a statistically sound judgment about the QS. Instead of relying on generic data like account QS, it can now use data about how the keyword performed with its ad text. If your keyword’s CTR is too low, that’s an indication to Google that users are not finding the ad relevant for that keyword. So your best bet is to either make the keyword more specific, for example by turning the keyword ‘dog’ into ‘dog food’ or by moving the keyword into a separate ad group with an ad text tailored for just this keyword. It simply comes down to finding a way to convince users to click your ad more frequently.
To improve QS, make your keywords more specific and improve your account structure by creating smaller and more tightly themed ad groups, each with ads tailored to the small set of keywords.
As a general best practice, I like to keep ad groups to no more than 20 keywords. While it’s not a hard and fast rule, I find that ad groups with more than 20 keywords can usually be split up into several smaller ad groups.
What about Landing Page Quality Score?
Landing Page Quality Score is an element AdWords started to consider because some advertisers had figured out how to game QS by writing must-click ads but then not delivering on the promise of the ad. For example, it’s really easy to get a high CTR by telling users they can get a free tablet for clicking an ad. But once they click, that promise usually turns out to be a scam.
It’s important to understand that this is why LPQ was introduced. While it can now boost the QS, it was originally intended to weed out bad advertisers. But it’s not a big component of QS. I say this because some advertisers believe they can get a better QS by creating unique landing pages for every keyword and while there’s nothing wrong with that, it’s probably not the best way to spend your limited time and resources. Focusing on highly relevant ads that get great CTRs is still the best way to boost QS.