
Today Google announced the addition of seven new Quality Score (QS) fields in AdWords, including historical QS. It goes without saying that we’re big fans of giving advertisers access to this data. After all, Optmyzr’s first major tool was the historical QS tracker we launched in the summer of 2013. Ever since then we’ve tracked billions of points of data to help advertisers make more sense of their Quality Scores.
Is there a need to continue to use tools for QS tracking now that Google is providing the same functionality directly in AdWords?
Like Jacob from our friends at Hanapin says, it’s definitely nice that any advertiser can now get the data, without needing to resort to tools, or AdWords Scripts. But there are some significant benefits you get from using Optmyzr to track QS. Here are 5 things you can do with Quality Score in Optmyzr that you can’t in AdWords.
#1: Optmyzr helps you prioritize Quality Scores to fix
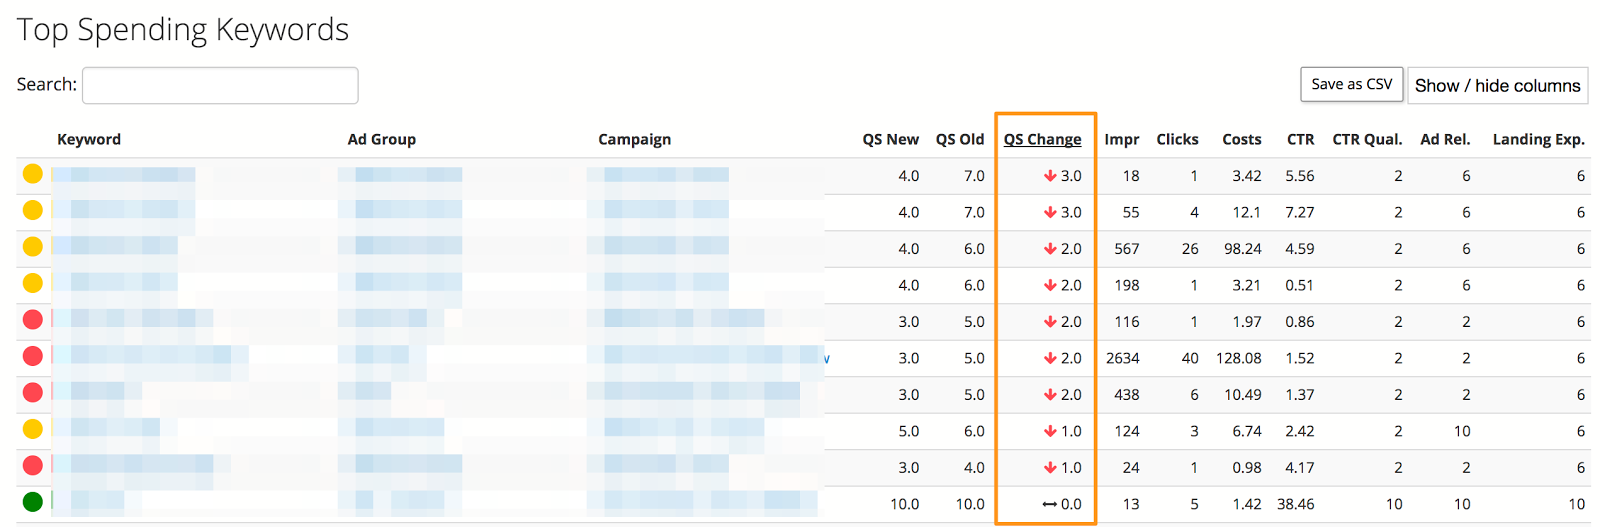
While AdWords now includes both the current and historical QS, it doesn’t have a column for letting you see the difference between these two numbers. That may seem trivial but when dealing with hundreds or thousands of keywords, it’s nice to have a simple way to find keywords with the biggest increase or decrease in QS.
Optmyzr’s Quality Score Tracker includes a column called QS Change. It shows the numerical difference between the QS on the start and end date of the selected range. By clicking on this column, it’s very easy to find keywords with the biggest drop in Quality Score. It’s a great tool to identify the keywords most in need of some attention.
#2: Optmyzr shows aggregate QS and account QS
It’s easy to focus your attention in the wrong place if you’re not taking volume into consideration. For example, look at the screenshot in the last paragraph and notice that the keyword with the biggest decline in QS had 18 impressions. It might be possible to improve that keyword’s Quality Score, but how much will that really benefit the account?
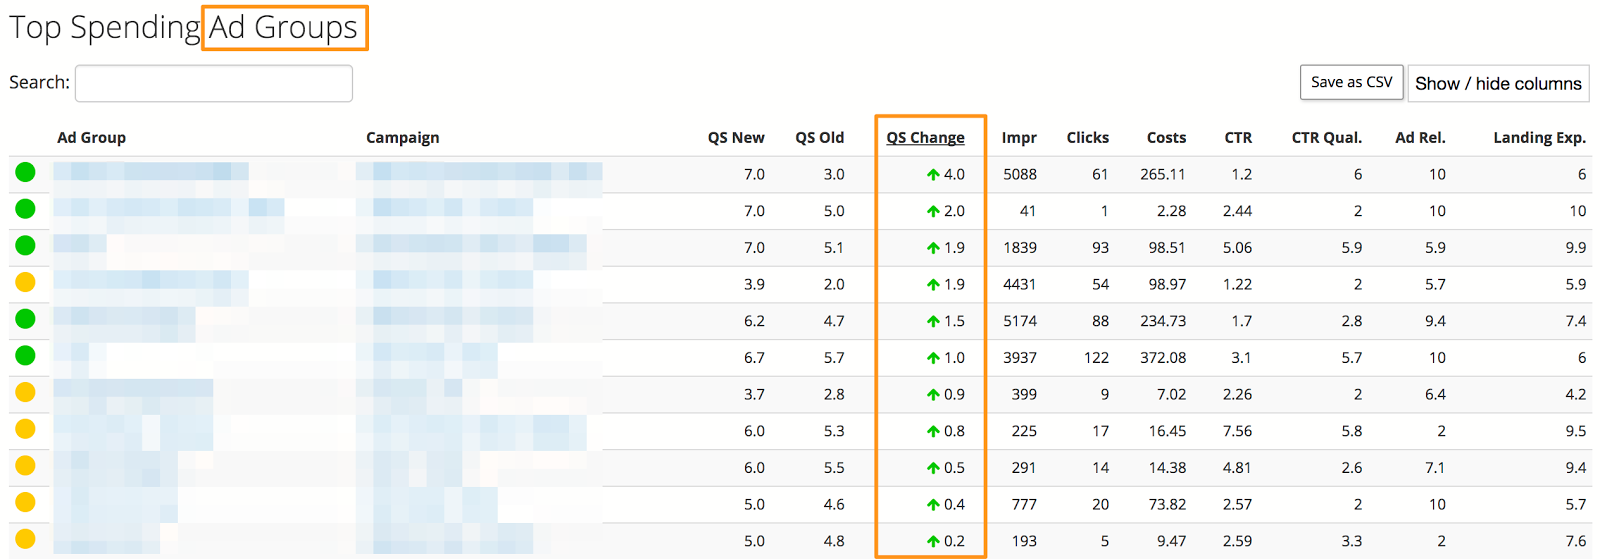
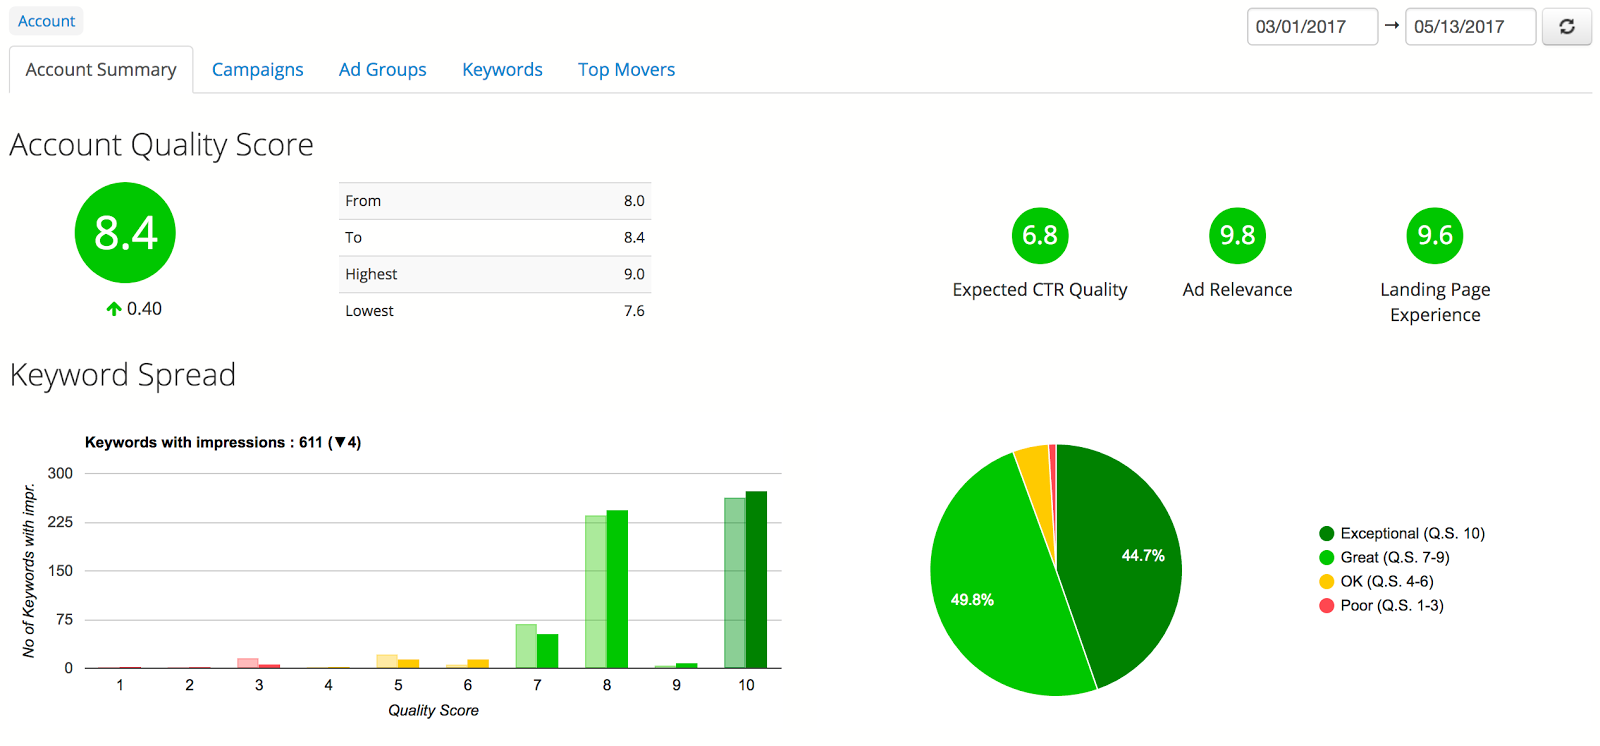
That’s why Optmyzr has always provided aggregate QS in the form of an impression-weighted account-level quality score, as well as campaign-QS and ad group-QS.
This helps advertisers focus on making changes in the places that can have the biggest payoff. For example, here’s where the biggest QS improvements are in this account. Because it’s aggregated at the ad group level, there is more data, making the insights more meaningful.
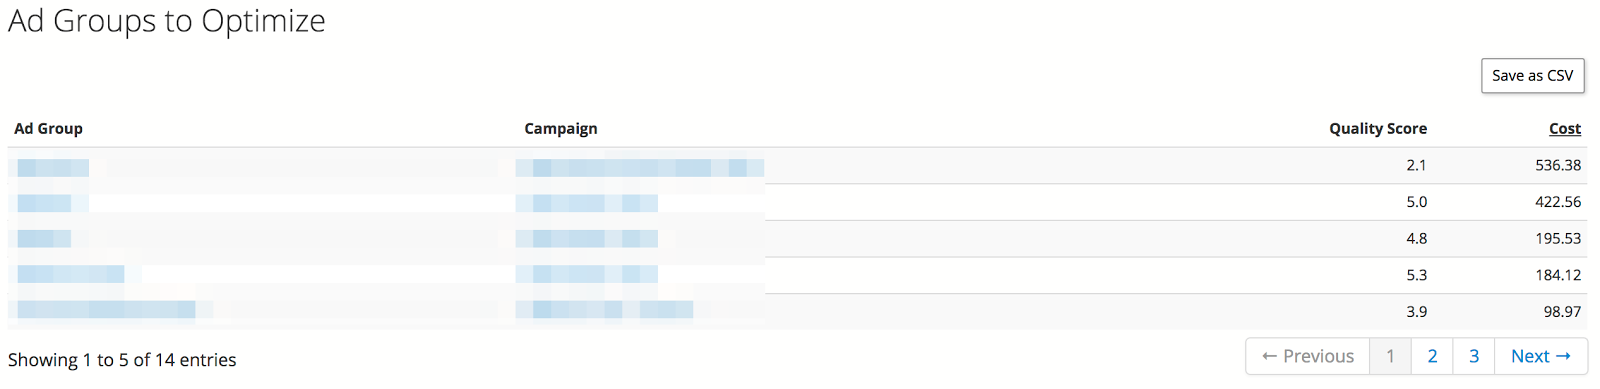
Optmyzr even recommends which ad groups would most benefit from optimization by doing a weighted sort on cost and low QS.
#3: Optmyzr visualizations make QS easier to understand
We’ve always believed that historical QS change is a useful metric to inform advertisers whether Google likes the optimizations they are doing or not. As a PPC optimization company, this is obviously an important criteria for us and our customers to think about.
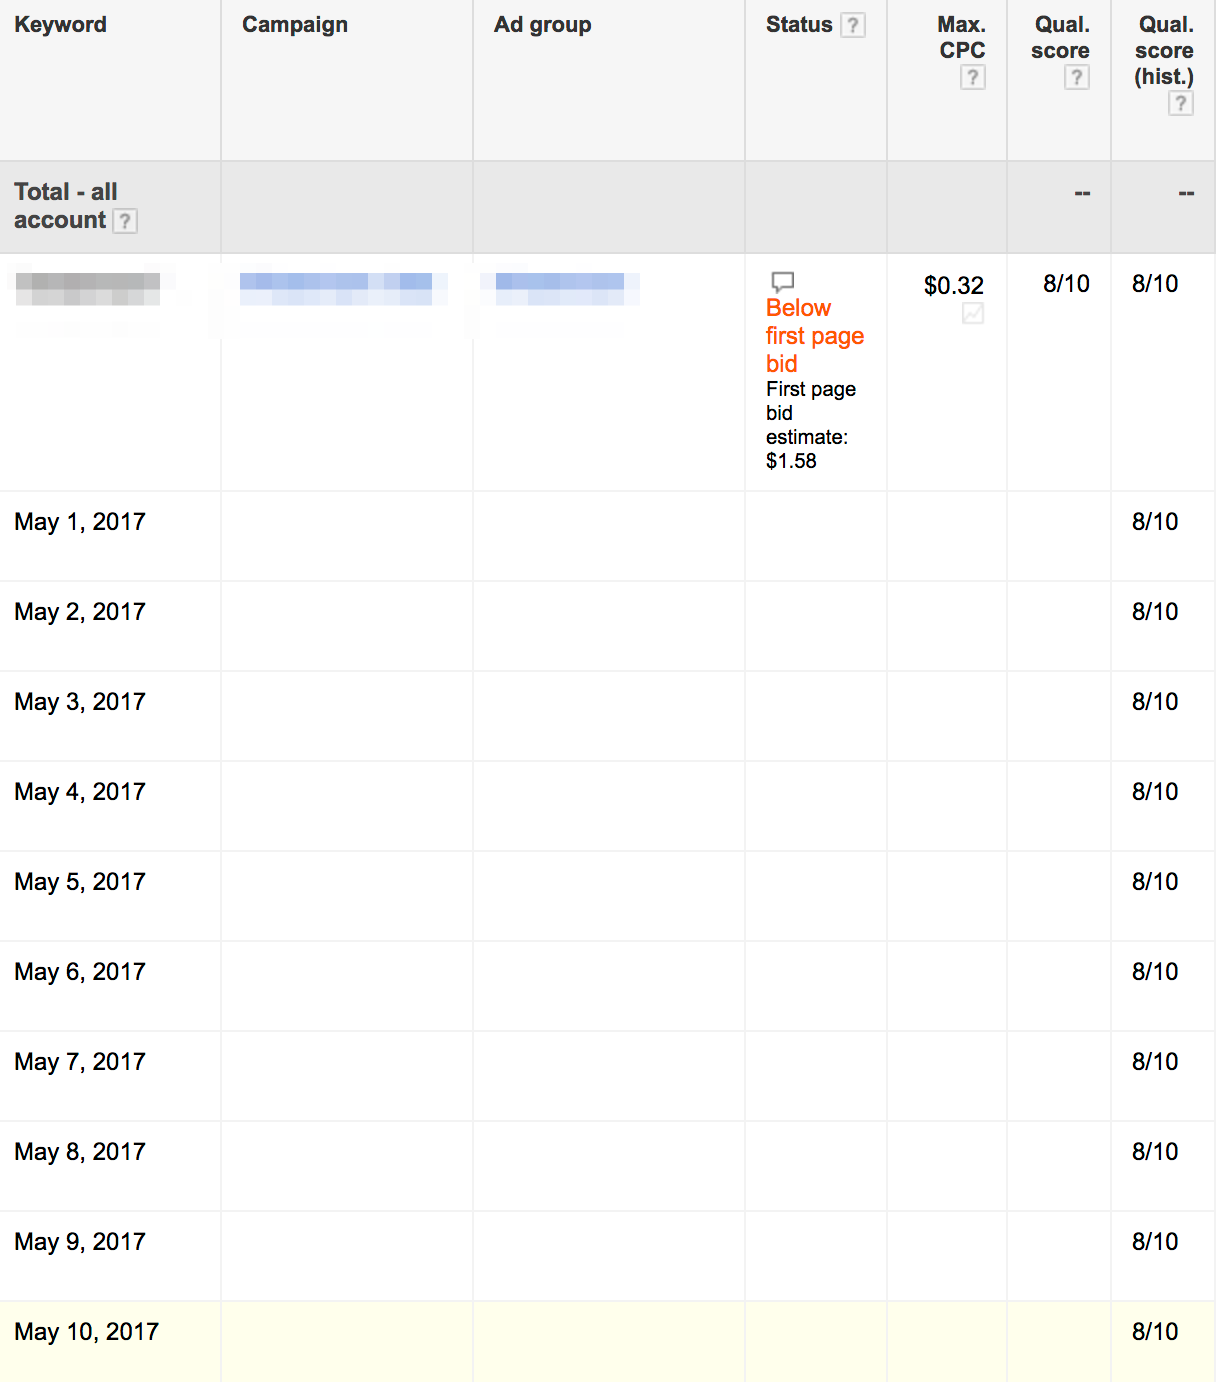
In AdWords, you can now see historical QS by day by applying a daily segment to the keyword data. But in the resulting table it’s pretty difficult to see a pattern of change.
Optmyzr makes understanding and analyzing Quality Score data easier in several ways.
First, we provide a clean dashboard that shows the changes in QS between any 2 dates when the AdWords account was connected to Optmyzr. Here we have an example showing the account level Quality Score change between March 1, 2017 and May 13, 2017.
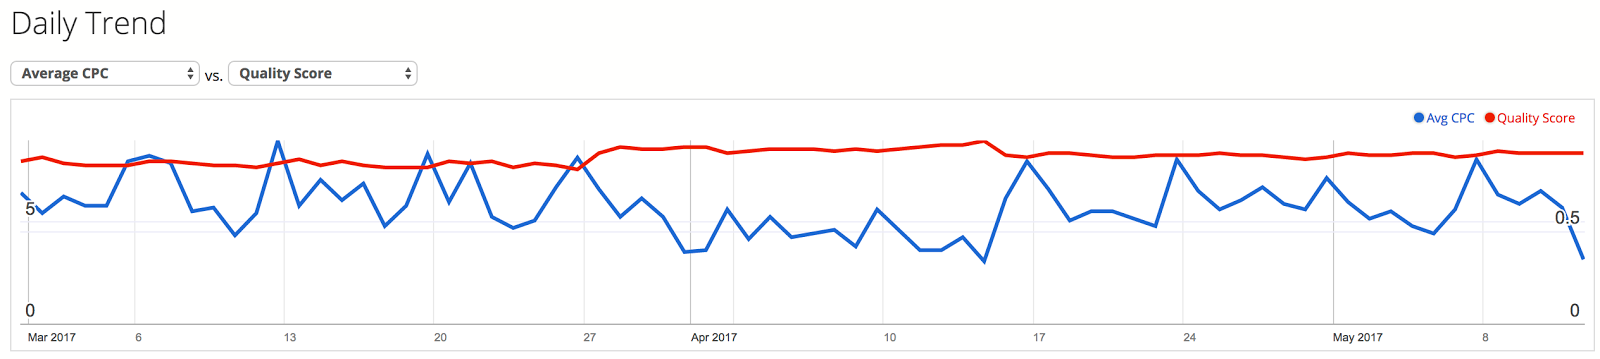
Next, unlike in AdWords where QS is not a value available for charts, Optmyzr does have time charts showing QS changes. This makes it really easy to see if QS changed during a particular date range.
#4: Optmyzr connects the dots on Quality Score impact
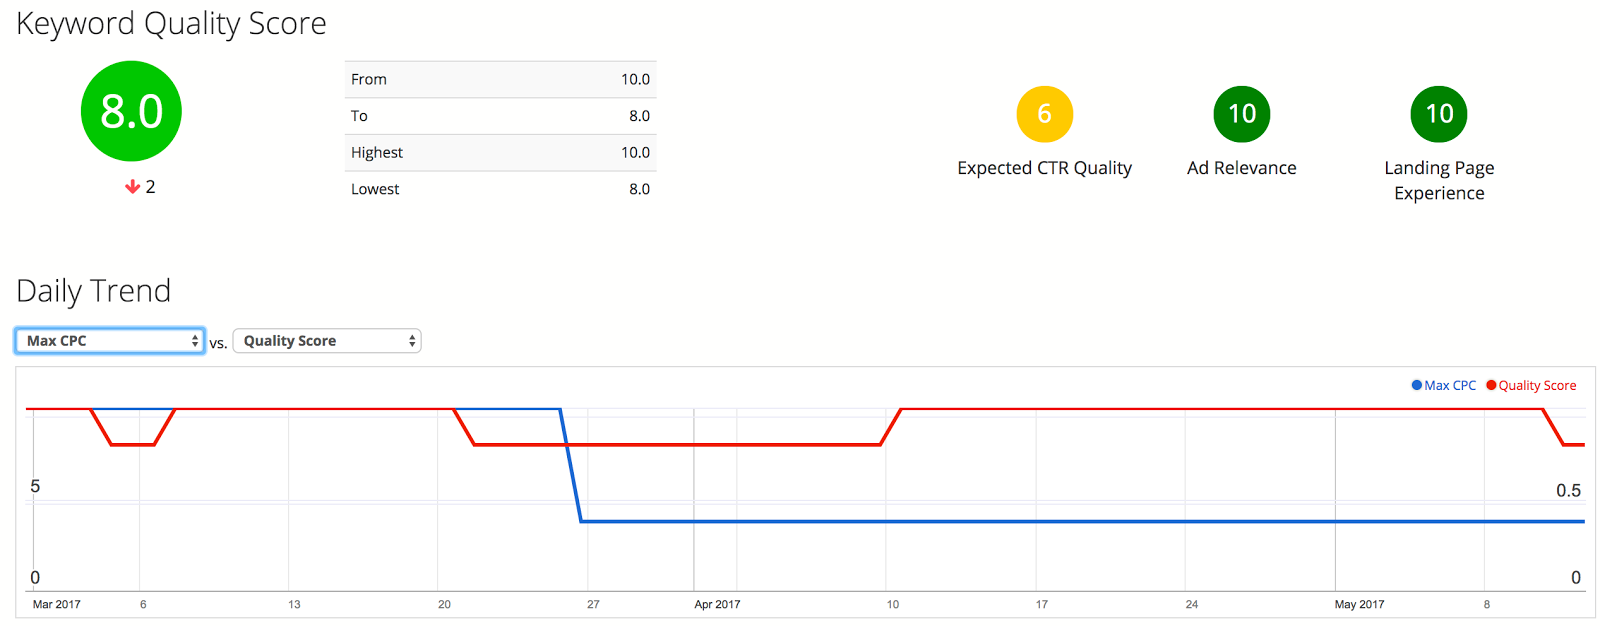
While the QS number 1 through 10 we see in accounts is based on position-normalized data, we can’t but wonder whether changes in bids, and the resulting changes in average position could have an impact on our QS. In Optmyzr, it’s very easy to investigate this question.
#5: Optmyzr includes Quality Score in automated reports
We could debate whether including AdWords jargon like QS in client reports is a good thing or not. However, we know that many advertisers like to include it in reports, and especially in reports used by consultants and agencies to audit prospective new clients.
Optmyzr lets you include Quality Score data in report templates. It can be shown either as a KPI value:

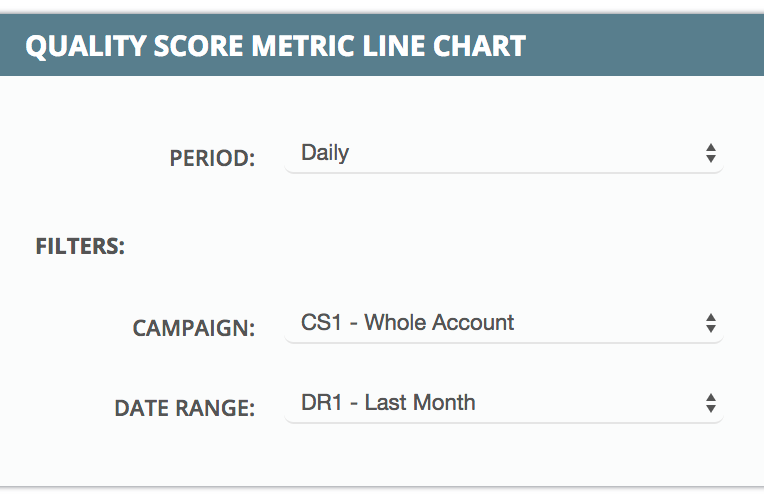
Or it can be shown as a time chart:
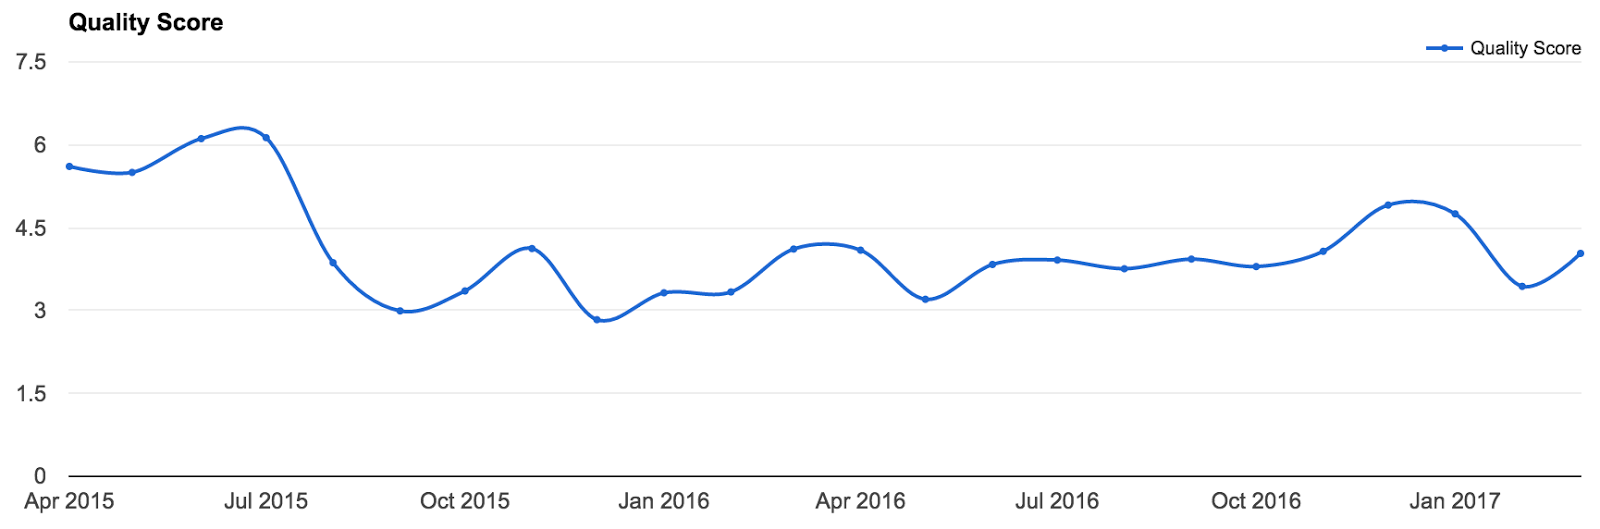
The time chart has several interesting settings. The curve can be smoothed by showing weekly or monthly data (in addition to the ability to show daily data).
Advertisers can even calculate the aggregate quality score for groups of campaigns by combining our campaign filters with campaign labels. For example, an advertiser can add a specific label to all their branded campaigns and then select this label in the report. There is no other way that we know of for advertisers to get quality score aggregation for portions of their accounts.
Conclusion
Optmyzr is excited that Quality Score is finally getting the treatment it deserves in the AdWords interface. With a renewed focus on QS, we hope advertisers will use Optmyzr’s unique capabilities related to QS to optimize their accounts.