Many advertisers have long viewed Google’s Ad Strength as the definitive north star for Responsive Search Ad (RSA) success, believing that a higher score guarantees better performance. But is this common perception actually supported by the results? Our latest data says otherwise.
At Optmyzr, we analyzed data from roughly 20,000 Google Ads accounts to understand what actually drives RSA efficiency. We looked at several factors commonly associated with better ads, including:
- Ad Strength ratings
- Headline length
- Description length
- Pinning strategies
- Capitalization styles
We then compared those elements against the metrics that actually matter to advertisers: cost per acquisition (CPA), return on ad spend (ROAS), conversion rate (CVR), and conversions per impression.
The results challenge several widely held assumptions about how to build better responsive search ads. Here are our key takeaways:
- Ad Strength does not correlate with better performance
- Headlines under 20 characters deliver the lowest CPA
- 61–70 character descriptions perform best
- Partial pinning beats full pinning
- Sentence case outperforms title case
Read on for the full details about our findings.
Methodology: About the study
We examined data from approximately 20,000 active Google Ads accounts managed through the Optmyzr platform. For each dimension we studied, we aggregated performance data across all accounts and evaluated efficiency metrics including CPA, CPC, CTR, ROAS, CVR, and conversions per impression.
For pinning and capitalization analyses, we also compared the subset of accounts that used every variation. These “common account” subsets are smaller, but they help reduce selection bias.
Important caveat: Optmyzr customers tend to be experienced PPC practitioners. This dataset may skew toward more sophisticated advertisers. Results are directional, not population-wide absolutes.
Here are the questions we set out to answer:
- Is there a correlation between Ad Strength and actual performance?
- Do shorter or longer ad headlines perform better?
- Is there an optimal length for ad descriptions?
- Does pinning help or hurt RSA performance?
- Does capitalization style (Title Case vs. Sentence case) affect efficiency?
Finding 1: Ad strength does not predict performance
This is the headline finding, and it is consistent with what we reported in our in our 2024 study: there is no reliable correlation between Ad Strength and ad efficiency.
Ad Strength vs. Performance (All Accounts)
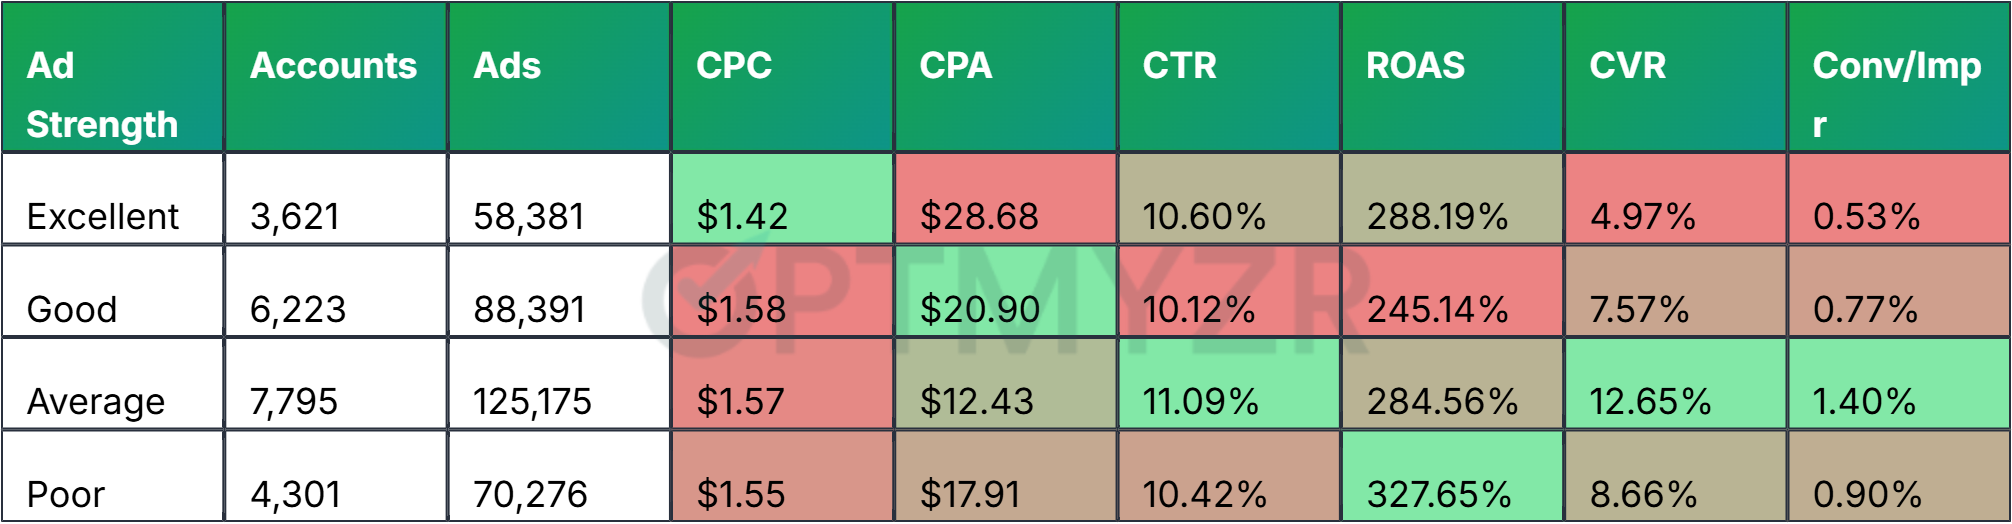
Ad-strength labels don’t always predict cost-efficiency. In this dataset, ‘Average’ ads produce the lowest CPA and highest CVR, while ‘Excellent’ ads show strong ROAS but higher CPA. Source: Optmyzr study, 2026.
Observations:
Ads with an “Average” Ad Strength deliver the best CPA ($12.43), the highest CVR (12.65%), and the most conversions per impression (1.40%). “Excellent” Ad Strength ads actually have the worst CPA ($28.68) and the lowest CVR (4.97%) in our dataset. Meanwhile, “Poor” Ad Strength ads deliver the best ROAS at 327.65% – outperforming every other category including “Excellent.”
The implication is clear: Ad Strength reflects structural completeness – how many headlines and descriptions you have provided, how diverse your keywords are across assets – not how well your ad will actually perform.
This does not mean you should ignore Ad Strength entirely. Think of it the way Google intends it: as a checklist for asset coverage, not as a performance predictor. If you are an experienced advertiser with ads that convert, do not let a “Poor” or “Average” rating push you into changes that could hurt performance. But do consider that ads with lower ad strength and good KPIs may ultimately get fewer impressions because Google predicts they will be less relevant for users.
Finding 2: Shorter headlines are more efficient
Google gives you up to 30 characters per headline, and Ad Strength rewards you for filling that space. But our data shows that shorter headlines consistently outperform longer ones.
Headline Length vs. Performance
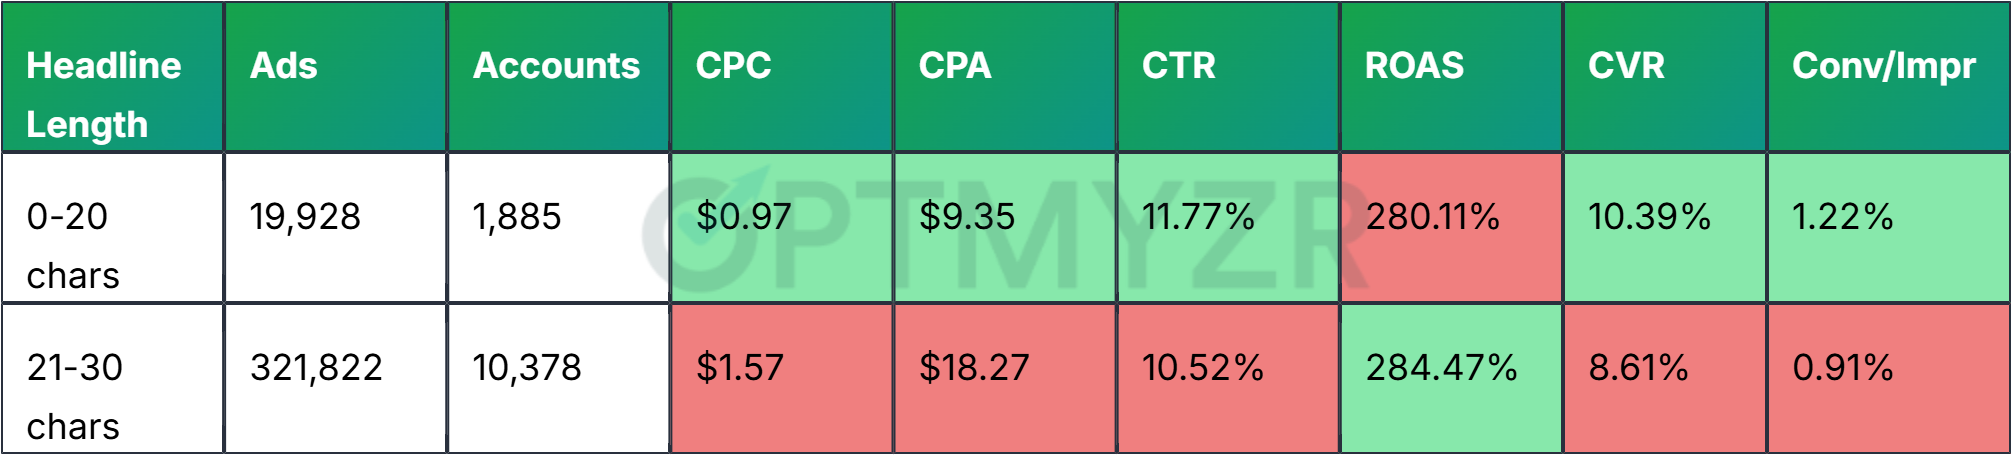
Brevity pays: Headlines under 20 characters dramatically reduce CPC and CPA. Source: Optmyzr study, 2026.
Longer headlines (21–30 characters) do show a higher share of “Excellent” ratings and a noticeably lower share of “Poor” ratings, which suggests that fuller assets may help you avoid the lowest Ad Strength tier. But the overall correlation between headline length and Ad Strength is extremely weak (0.056).
Ad Strength Rating vs. Headline Length
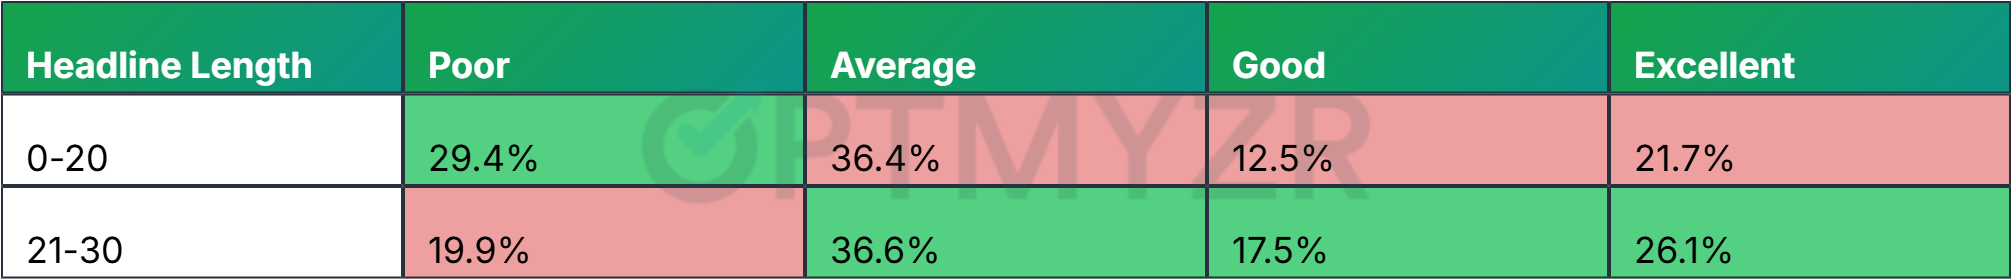
Longer headlines (21-30 characters) significantly increase the likelihood of ‘Good’ or ‘Excellent’ ad strength labels. Source: Optmyzr study, 2026.
Observations:
Headlines under 20 characters deliver a CPA of $9.35 – nearly half the $18.27 CPA of longer headlines. They also have higher CTR (11.77% vs. 10.52%), better CVR (10.39% vs. 8.61%), and more conversions per impression (1.22% vs. 0.91%).
Why? Shorter headlines tend to be more direct and intent-focused. They get to the point faster. Instead of stuffing keywords into every available character, they communicate a clear, concise message that resonates with the searcher’s intent.
The practical takeaway: resist the urge to maximize character count just because Google gives you 30 characters. Write the headline that best communicates your value proposition – even if it is only 15 characters long.
Read more: Why Your Responsive Search Ads Underperform (and 8 Ways to Fix Them)
Finding 3: Mid-length descriptions hit the sweet spot
While shorter is better for headlines, descriptions tell a more nuanced story. There is a clear sweet spot in the 61-70 character range.
Description Length vs. Performance
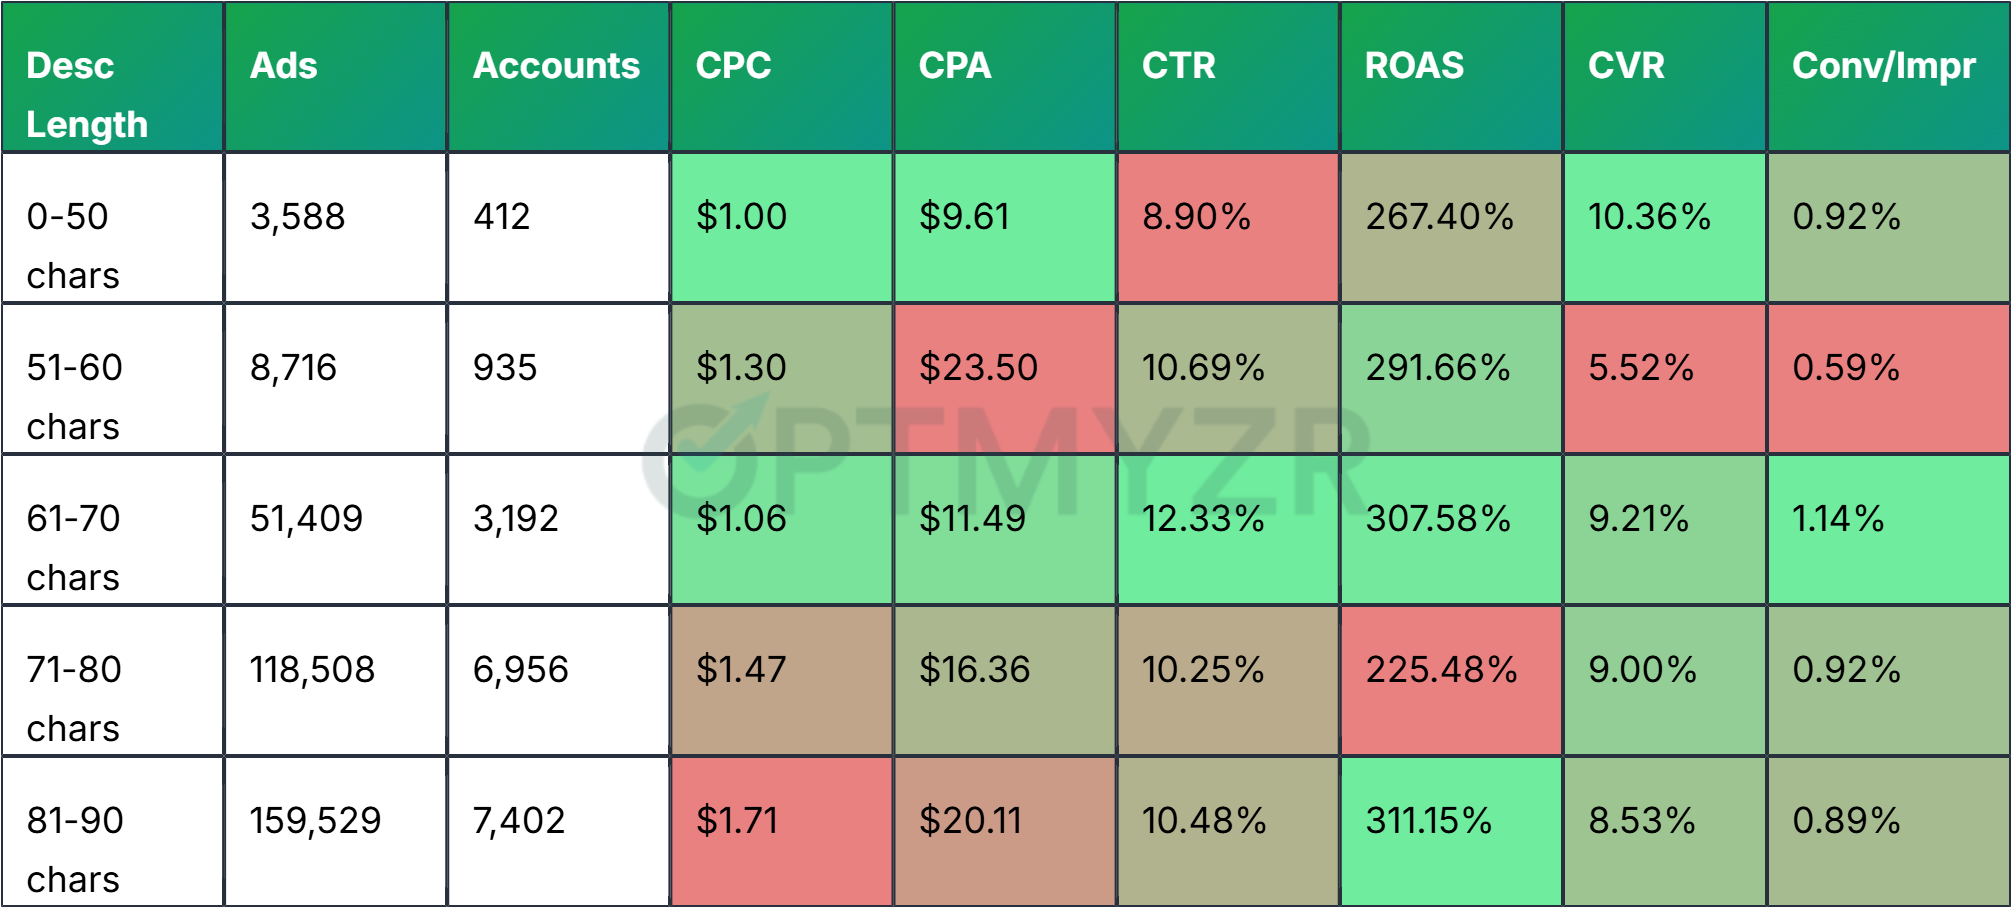
Ads with description lengths between 61-70 characters demonstrate superior performance across multiple metrics. Source: Optmyzr study, 2026.
Observations:
The 61-70 character bucket delivers the best combination of metrics: the highest CTR (12.33%), strong ROAS (307.58%), solid CVR (9.21%), and the most conversions per impression (1.14%). It also has a very competitive CPA of $11.49.
Very short descriptions (0-50 chars) have the lowest CPA ($9.61) but also the lowest CTR (8.90%), suggesting they may not be engaging enough to drive volume. On the other end, the longest descriptions (81-90 chars) have the highest CPC ($1.71) and a weaker CPA ($20.11).
The pattern suggests a diminishing-returns curve: descriptions need enough length to be persuasive, but beyond about 70 characters, you start paying more without getting proportionally better results.
Finding 4: Partial pinning outperforms full pinning and no pinning
The pinning debate has been one of the most contentious topics in the RSA world. Should you pin everything, essentially recreating the old ETA format? Pin nothing and let Google optimize? Our data points says the sweet spot is in the middle.
Pinning Strategy vs. Performance (All Accounts)
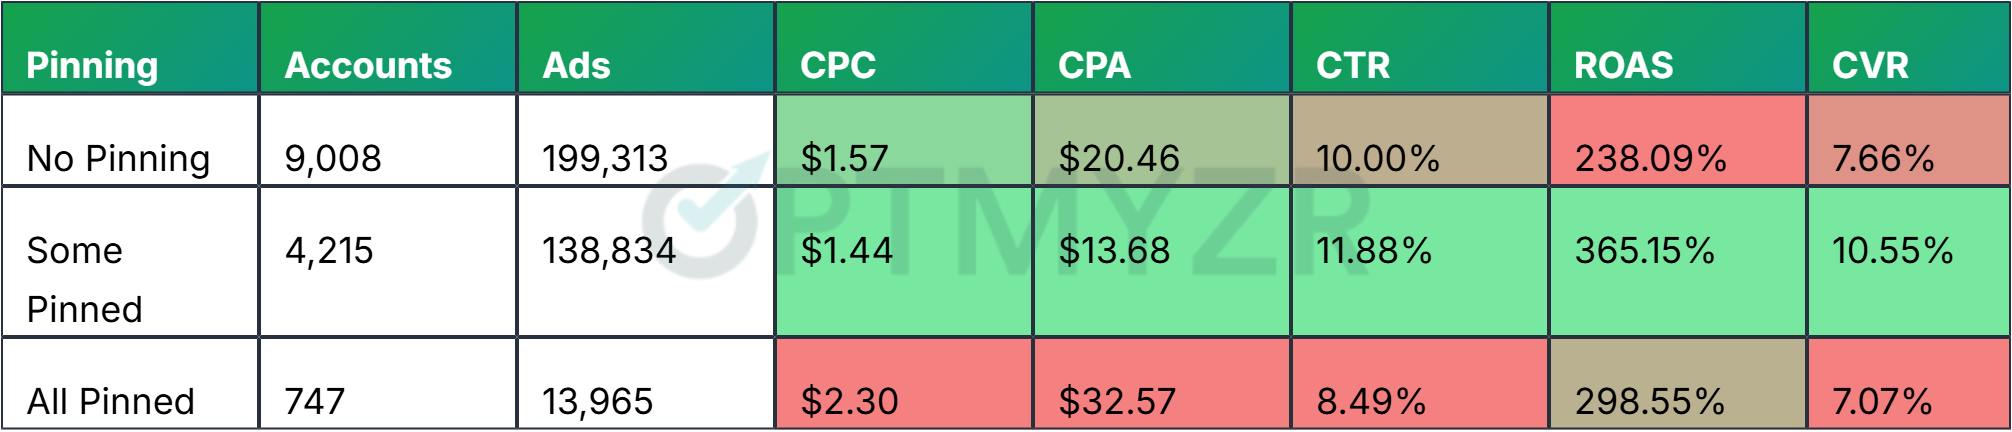
Accounts with some pinned ads achieve the highest ROAS and lowest CPA. Source: Optmyzr study, 2026.
We then looked at a subset of accounts that use every variation of pinning. They have some ads where every position is pinned, some where nothing is pinned, and some that pin only a few positions. Now the ROAS winner shifts to ads with all positions pinned, and the conversion rate winner shifts from some pinning to no pinning.
Pinning Strategy vs. Performance (268 Common Accounts)
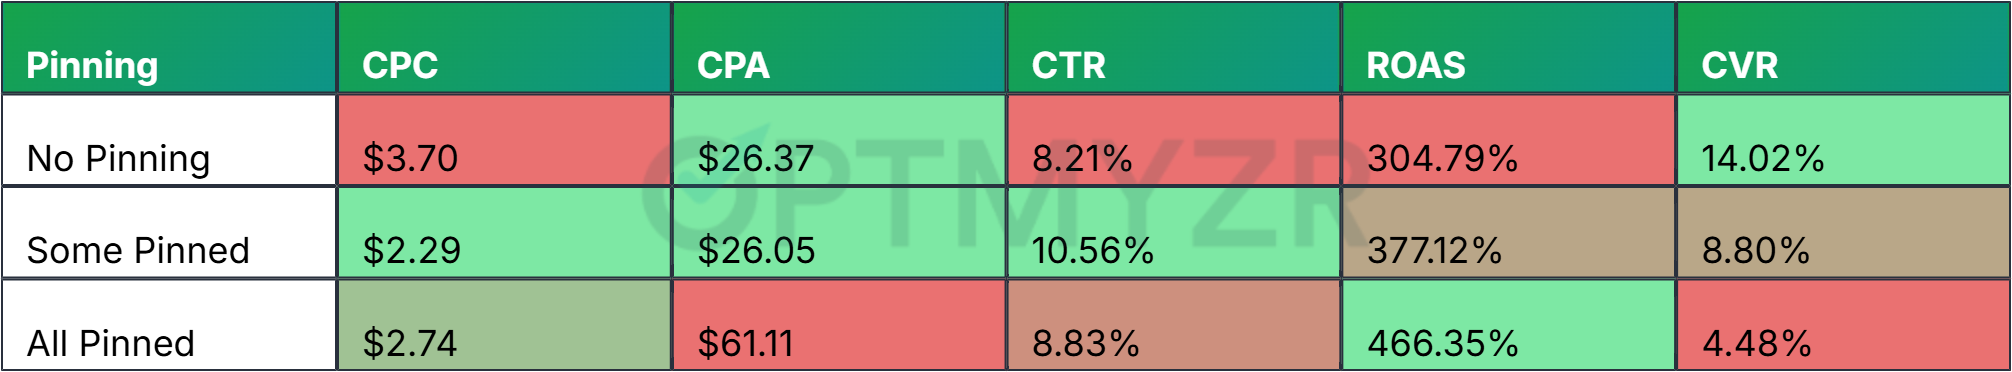
Optimizing pinning strategies can significantly impact campaign performance. Source: Optmyzr study, 2026.
Observations:
In the full dataset, partial pinning wins across nearly every metric: best CPA ($13.68), highest CTR (11.88%), best ROAS (365.15%), and highest CVR (10.55%). Fully pinned ads perform worst on CPA ($32.57) and CTR (8.49%).
The controlled comparison (268 accounts with all three strategies) tells a similar story. Partial pinning and no pinning deliver comparable CPAs (~$26), but partial pinning has significantly better CTR and ROAS. Fully pinned ads have a CPA of $61.11 and a CVR of just 4.48%, but they do deliver the best ROAS.
The takeaway: use pinning strategically, not as a default. Pin your most important headline to position 1 to ensure your core message always shows. But leave room for Google to test combinations – the machine learning genuinely does find winning combinations you would not have predicted. What you should not do is pin everything. Full pinning eliminates the core advantage of RSAs.
Finding 5: Sentence case generally outperforms title case
Should You Write Your Headlines Like This? Or should you write them like this? Our data has a clear directional answer: sentence casing works best.
Headline Capitalization vs. Performance (All Accounts)
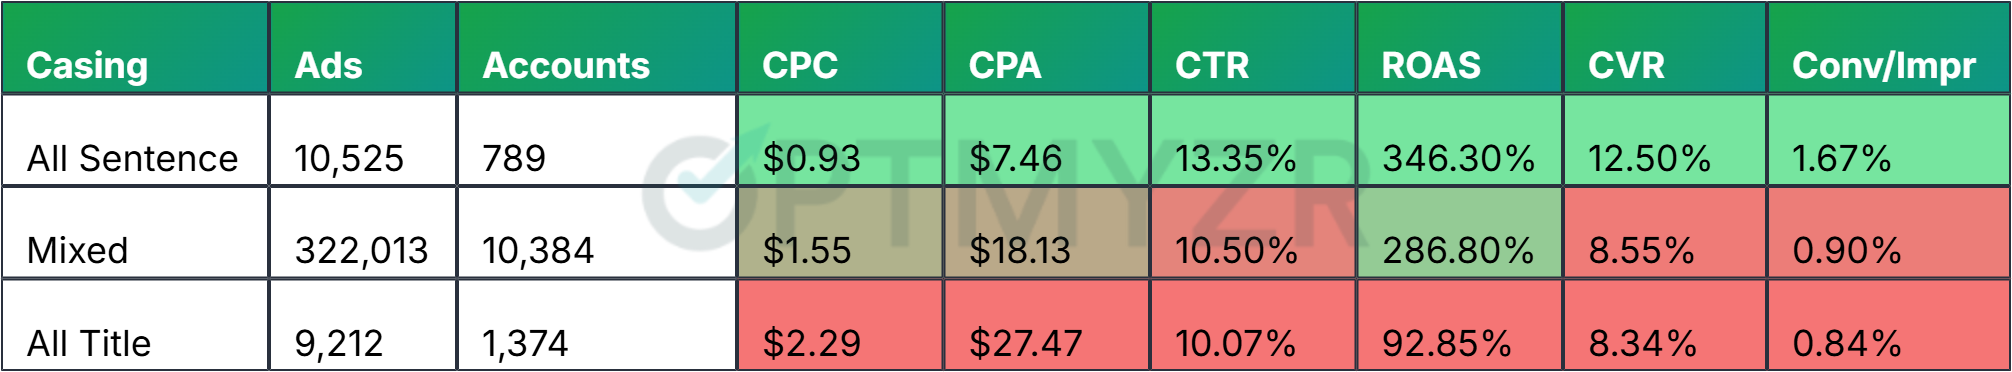
Sentence case ads tend to perform better than other capitalization strategies. Source: Optmyzr study, 2026.
Description Capitalization vs. Performance (All Accounts)
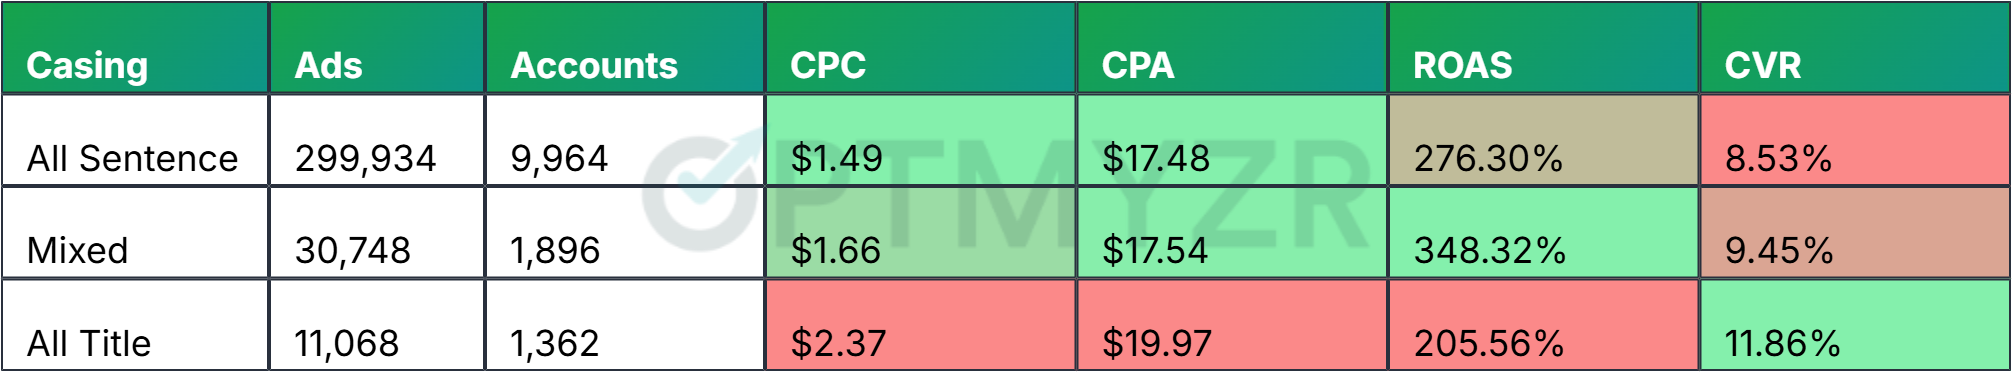
All title casing in ad descriptions tends to correlate with worse CPA and ROAS.Source: Optmyzr study, 2026.
Observations:
For headlines, the differences are striking. Sentence case headlines deliver a CPA of $7.46 versus $27.47 for title case – a 3.7x difference. They also have the highest CTR (13.35%), best CVR (12.50%), and strongest ROAS (346.30%).
For descriptions, the picture is more mixed. Sentence case and mixed case have nearly identical CPAs (~$17.50), while title case is slightly higher ($19.97). Mixed case descriptions deliver the best ROAS (348.32%).
A caveat: when we restrict to common accounts, the headline sample drops to just 31 accounts that use every type of casing. That is too small for firm conclusions, though the directional signal still favors sentence case. The description common-account analysis (217 accounts) also supports sentence case as the strongest performer on CPA and ROAS.
Why might sentence case work better? It reads more naturally – more like how people actually communicate. Title case can feel like generic ad copy. Sentence case blends more seamlessly into the search results page, which increasingly features AI Overviews that use sentence case as well.
Caveats and what this does not tell you
Before you restructure your entire ad strategy based on these findings, some important limitations:
This is observational data, not a controlled experiment. We can identify correlations and directional patterns, but we cannot prove causation. Advertisers who write short headlines might also be better at other aspects of PPC management.
Common-account analyses often have small sample sizes, particularly for casing comparisons. When samples are small, treat findings as directional hypotheses to be tested, not as definitive rules.
Your industry, audience, and competitive landscape matter. What works across 20,000 accounts on average may not be optimal for your specific situation. Use these findings to inform your testing priorities, not to replace testing.
What you should do next
Based on this analysis, here is where to focus your RSA optimization efforts:
- Stop chasing Ad Strength. If your ads perform well on the metrics that matter to your business, a “Poor” or “Average” Ad Strength score is not a problem worth solving.
- Test shorter headlines. If you have been filling every character slot, try concise, intent-focused alternatives under 20 characters. Measure impact on CPA and conversion rate, not just CTR.
- Aim for 61-70 character descriptions. Give yourself enough space to be persuasive, but do not pad.
- Use partial pinning. Pin your core message and let Google optimize the rest. Avoid full pinning.
- Try sentence case. Especially for headlines, natural-sounding copy appears to drive better engagement and conversions.
The overarching theme across all five findings is the same: the creative choices that look the most “ad-like” – maxed-out character counts, title case formatting, perfect Ad Strength scores – tend to perform worse than the choices that feel more natural and direct. Your audience does not reward polish. They reward relevance.