One of the core skills for PPC marketers is reporting. The ability to beautifully visualize data and draw insights from it is a big factor in optimizing your ad campaigns.
At Optmyzr, we’ve built several tools for reporting to help you make understanding your campaign performance easier. In this article, you’ll learn about our top reporting features that will simplify reporting.
1. Add multiple date range options to your report.
Most reporting tools only give you the option to add one or two date range options in your reports. With Optmyzr’s report designer, you can include as many date range options as you want in a single report. These can be absolute or relative date ranges so you can automatically schedule reports.
For example, you can have data for the last month, the month before the last, or last year in the same report. In widgets providing comparison data, you’ll also find previous period date ranges for easy month-on-month or year-on-year analysis.
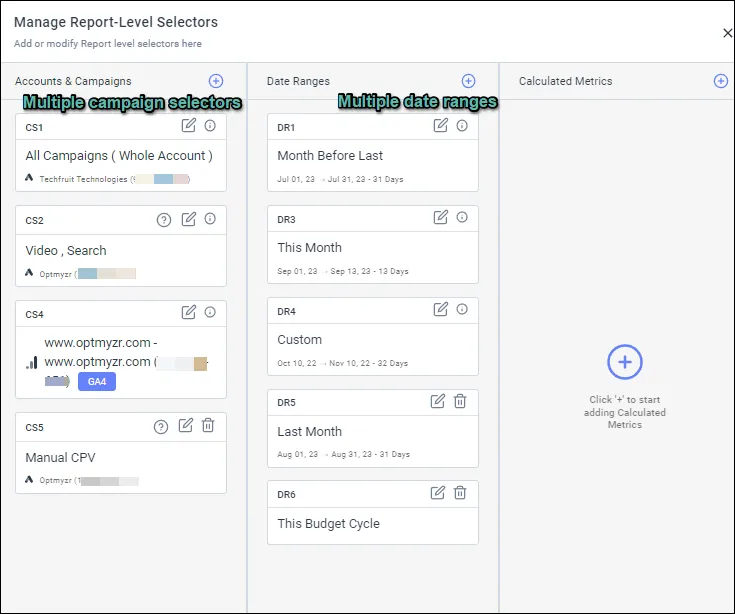
2. Measure performance at the account, campaign, and label levels in the same report.
We understand that if you’re using labels in ad platforms, you want to be able to report on them. In the report designer, you get the option to report at the account, campaign, and label levels. What makes this feature really cool is that you can have all three levels in the same report.
For example, you can compare the performance of your branded and non-branded campaigns, or one category of products with another in the same report. Also, if you want to use labels for reporting but don’t want to create them in the ad platform, you can use Optmyzr labels.
Another great addition to this feature is the ability to report on a specific campaign type or bid strategy. If you’re preparing a report on automated bidding campaigns, you can just select the respective bid strategies and include only those campaigns that work on automated bidding.
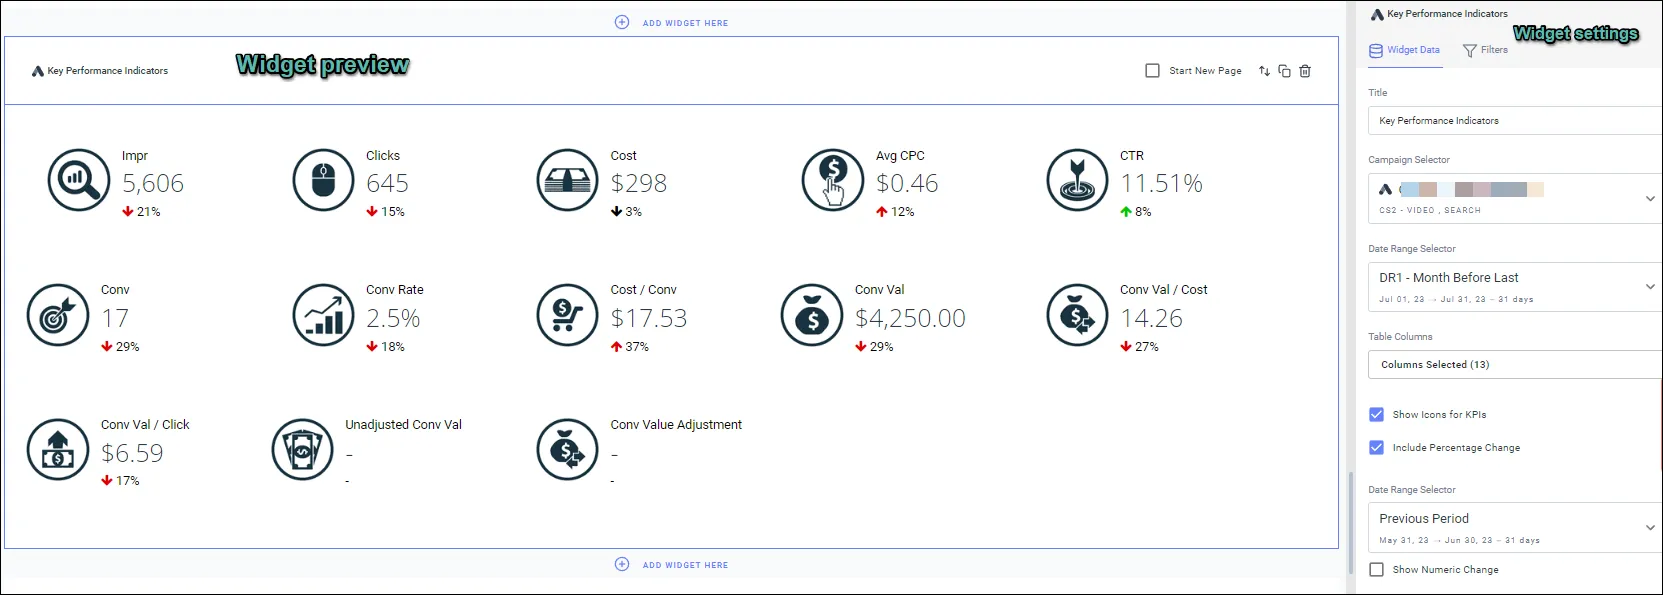
3. Preview your report while configuring.
Preview your report simultaneously while configuring different settings for multiple widgets. This streamlines the report creation process and eliminates the need to constantly switch between the settings and preview pages.
You can make real-time adjustments to your report widgets, such as data selection, filters, and visualizations, all while observing the immediate impact on your report’s appearance. This not only saves you time but also ensures that you can fine-tune your reports with precision.
4. Create up-to-date reporting dashboards.
You can share links to reports, schedule them, or update them on a schedule. This helps you create a reporting dashboard that can be updated on a schedule (every day, every week, or every month).
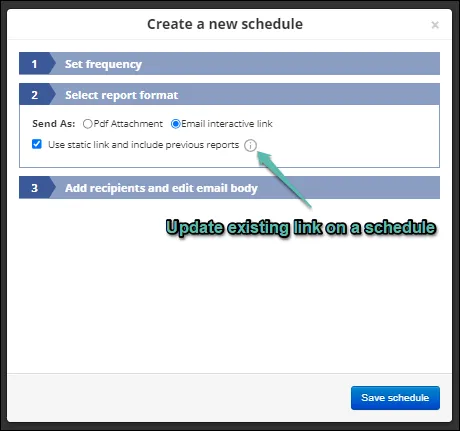
5. Schedule your reports based on rules.
This feature provides a highly customizable way to automate your report deliveries. Using this option, you can set specific conditions that determine when you should and shouldn’t send reports, based on the KPI values you set.
You define a specific condition around the deciding metric(for example, impressions). If the metric doesn’t meet the condition, the report won’t be sent to any of the designated recipients.
In essence, this feature gives you precise control over when and to whom your reports should be automatically delivered.
Further reading: More about this tool
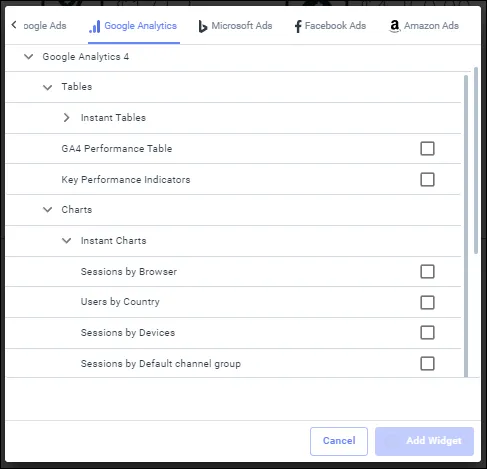
6. Add instant tables and charts from Google Analytics 4.
In Google Analytics 4, we’ve introduced a time-saving feature: instant tables and charts. These widgets are set up with the ideal combination of dimensions and metrics, aiming to instantly provide answers to your most critical questions about website traffic.
With these pre-configured widgets, you can conveniently access essential insights without the need for manual setup, ensuring a faster and more efficient experience while analyzing your web data. It’s all about simplicity and speed, so you can focus on what matters most – understanding your online traffic.
7. Insert date ranges dynamically.
If you’re scheduling reports, it is essential to be able to automatically insert the correct date. You can automatically insert dates using the date range insertion feature in any text box in the report. What makes this feature so useful is that you can insert the date in any format.
For example, you can choose to display dates like September 1 – September 30, 2015, or just September 2023.
More about the different date formats here
8. Get text-based explanations for changes in your key performance metrics.
The PPC Narrator widget goes beyond raw data and gives you text-based explanations for changes in your key performance metrics. It offers valuable context on how these fluctuations impact your business, shedding light on critical factors such as reduced visibility or variations in revenue.
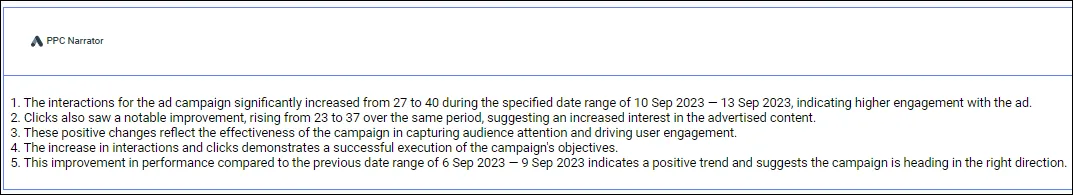
The insights are intelligently tailored to the chosen ‘sentiment,’ whether it’s Positive or Critical, providing you with a deeper understanding of the underlying dynamics within your data.
This empowers you to make informed decisions with confidence, leveraging the full potential of your reports.
The AI-powered summary is available in a PDF format and live report links.
More about the PPC Narrator here
9. Include external data in your reports.
To make sure you can include data from different sources, we have the Image Box widget, Custom text box widget, Spreadsheet data import widget, and Spreadsheet chart widget that lets you insert screenshots, tables, or offline data. You can take a screenshot of the particular view you would like to include in the report and insert it in the template.
10. Mark up for cost-related data.
This feature lets you mark up the cost-related data in a report by a certain percentage. This feature is available in Optmyzr’s Report Designer and can be selectively enabled in accounts.
Please feel free to send us an email at support@optmyzr.com if you would like to enable it on your account.
Better reporting means better results
Improving your reporting helps draw better insights from your efforts ultimately leading to better campaign performance. If you’re looking to save time and get the most out of your reports, try these 10 features.
Not an Optmyzr customer yet? Thousands of advertisers — from small agencies to big brands — around the world use these tools to manage over $4 billion in ad spend every year.
Sign up for our 14-day free trial today to give Optmyzr a try. You will also get the resources you need to get started and more. Our team will also be on hand to answer questions and provide any support we can.