2023 was a lot. There were big cultural events that shook economic stability, as well as major innovations in ad tech.
One can never be sure how these changes will influence ad accounts. Sometimes they’re negligible, other times they have a big impact (for good or for ill).
We decided to look at the following mechanics and how advertisers can take the lessons from 2023 to future-proof their campaigns moving forward:
- Match types: Did Broad Match enhancements in May of 2023 move the needle on its performance?
- Auction price volatility: How have auction prices changed and what impact does that have on other key metrics for major verticals?
- Performance Max: Are best practices actually best practices and just how much ROI is there in investing extra effort in creative?
We combined all three studies into one massive report because we see these questions as relating to each other. When match types behave the way you think they will (or don’t) that directly influences whether your account structure is going to deliver strong ROI. Volatility in auction prices might make you likely to trust PMax even though there are strong gains and paths to profit.
If you’re just interested in one of these questions, you can skip to that section in the navigation, but without any further ado, let’s dive in!
Match Types: Has Broad Match Evolved Enough & Is Exact Still the Best Path to Efficient Profit?
Before we dive into the data - here’s the TLDR:
- While Exact did have more accounts (4000) performing better than Broad (all metrics), the difference closed a lot since our last investigation. This shows big improvements for Broad Match!
- Average CPCs being as close as they are feels tied to general market fluctuation than one match type being “better” than the other.
- Phrase Match remains statistically insignificant as advertisers own that Exact performs the same job, and Broad Match has a place in today’s PPC landscape.
Criteria for the Study
- Must be running for at least 90 days prior to Q4 2023
- Minimum spend of $1000 and maximum spend of $10 million per month
- No branded campaigns included
- Must have both Broad Match and Exact Match in the account
Metrics
ROAS
- 25.90% of accounts performed better with Broad, median percentage difference is 52.78%
- 74.10% of accounts performed better with Exact, median percentage difference is 100.59%
CPA
- 26.16% of accounts performed better with Broad, median percentage difference is 41.11%
- 73.84% of accounts performed better with Exact, median percentage difference is 97.11%
CTR
- 18.43% of accounts performed better with Broad, median percentage difference is 24.83%
- 81.57% of accounts performed better with Exact, median percentage difference is 51.11%
Conversion Rate
- 37.88% of accounts performed better with Broad, median percentage difference is 35.29%
- 62.12% of accounts performed better with Exact, median percentage difference is 41.05%
CPC
- 51.50% of accounts performed better with Broad, median percentage difference is 24.91%
- 48.50% of accounts performed better with Exact, median percentage difference is 30.22%
Findings and Analysis
Broad may not perform at the same level as Exact, but the performance gap closed quite a bit since we last ran this study. We have a few thoughts on why this may have happened:
- Google made major improvements to Broad Match and it shows. Between the multilingual understanding and focus on intent, Broad Match is a much more reasonable data source than it was before.
- Auction prices trickle down to ROAS and CPA. While there is no denying Exact had demonstrably better ROAS and CPA, the median performance improvements were better. This might be due to rising CPCs across the board.
- PMax Search Themes are a factor here - they will always take a back seat to Exact Match while having the potential to win over Broad and Phrase if the syntax better matches the search theme. Given the wide adoption of PMax and statistically relevant adoption of search themes, broad might have performed even better if budget wasn’t diverted to PMax.
Action Plan
At this point there is no denying the match types have evolved to render syntax-driven structures moot. Whether you lean into Broad Match, DSA, or PMax as your data driver, you’re going to need to account for rules of engagement.
The Case for Keeping Broad in Your Account
Broad Match will show you exactly how various queries matched. While this might feel like an overrated feature, seeing what percentage of your Broad Match traffic would have come to you via phrase/exact can help you prioritize which keywords to keep/change out in your core ad groups.

If you use Broad Match, be sure that you add your other keywords as ad group level Exact Match negatives. This will ensure that your Broad Match keyword is able to do the job you intend for it to do without cannibalizing your proven keyword concepts.
To do this, you can run any of the following strategies:
- A Broad Match ad group with one to two Broad Match keywords you’re using to gather data. The other ad groups in the campaigns should exclusively be Phrase or Exact (I’d suggest Exact).
- A campaign with one ad group using Broad Match and all the other campaigns exclusively using Exact/Phrase.
Between the two, I’d suggest using the first method as that way Broad and Exact ad groups can help each other average out the deltas in the match types’ metrics. Without the conversions from Exact and the volume from Broad Match, campaigns might struggle to ramp up.
Choosing the right Broad Match keyword champion is the most critical choice. A few considerations:
- Does the keyword represent the best “deal” on traffic?
- Cheaper keywords won’t win every exploratory auction, but they might help you get discounts on high-value keywords when available.
- Don’t ignore quality on the path to the best deal. The keyword still needs to represent your customers.
- Keywords have different auction prices in different locations. Be mindful that your champion might need to change depending on geos.
- Is the keyword representative of your Exact Match keywords or is it testing completely new ideas?
- The benefit to being completely new is that you’re able to test your assumptions on established keyword concepts (i.e. they’re Exact).
- Locking in the same root words in a Broad keyword lets you test for variant drift (what percentage of your queries come back as close variants with different root words).
- Do your best customers search this way?
- Lead gen and ecommerce campaigns need to factor in ROAS. Depriving Google and yourself of revenue data (even if it’s a projection) is asking the algorithm to focus on volume over value.
- Honoring how your best customers search (high margin, easy to take care of, etc.) ensures that you’re not only matching keywords, you’re aligning creative.
The core ad metrics to focus on are CPC, conversions, CPA, and CTR-to-conversion rate.
The Case For Using PMax/DSA
PMax represents “black box” marketing to many, but as we’ll go over in the next section, there are a lot of areas for optimization and profit. Choosing to put your Broad Match budget into PMax may serve you better as it inherently comes with channels beyond search.
As younger generations come into their buying power, they are “searching it up” vs Googling it. That means having a presence on YouTube or other meaningful sites can be the difference between having a profitable conversation and losing to your competitor.
The other big checkbox for PMax (or DSA if you truly need just search) is that you won’t be subject to human bias. The keywords you think you’ll need might only cover part of your core customer base. Additionally, human-created keywords (even Broad Match) are subject to low search volume.
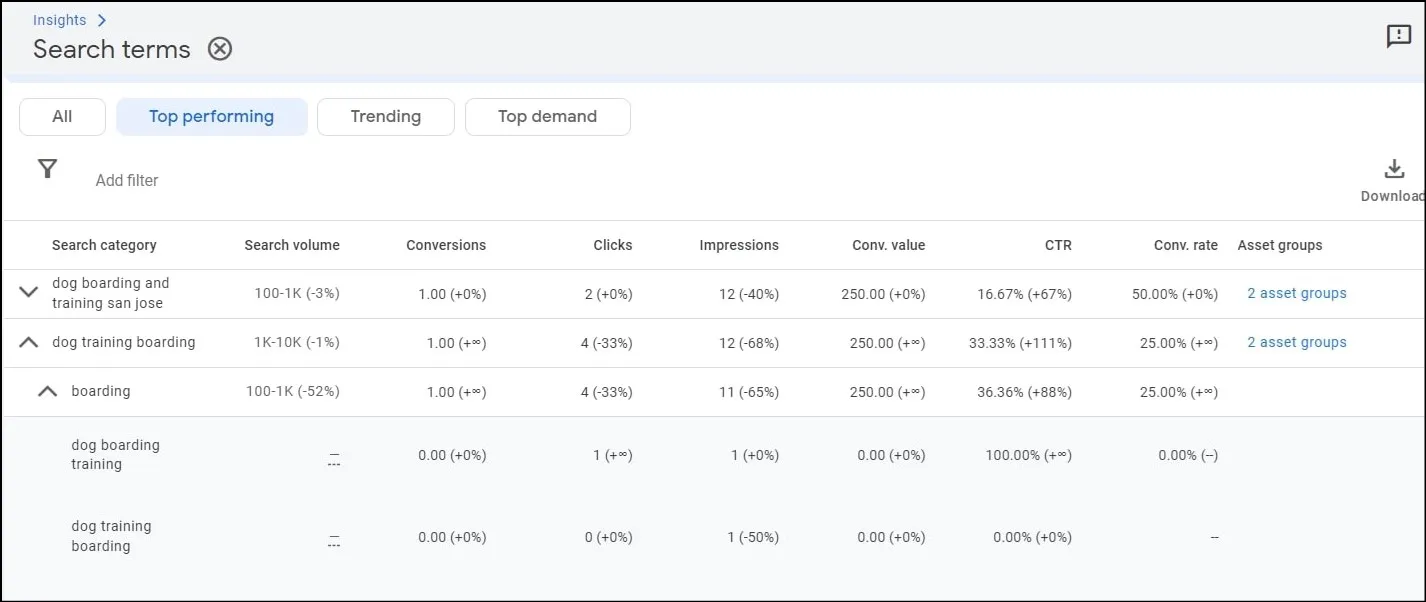
Be sure that you’re checking the search term insights to understand what keyword concepts are coming out and which might make sense to include as an Exact search term.
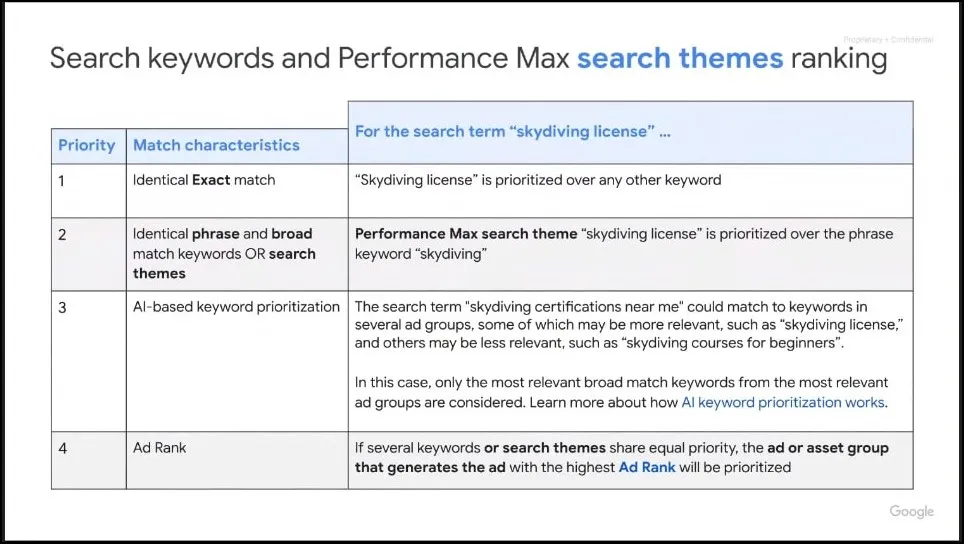
We’ll be going into the data on Search Themes in the PMax section, but it’s worth noting that exactly replicating your search keywords as search themes is likely a mistake. This is because your Exact Match keywords will always win, but phrase and Broad Match can lose to search themes.
Performance Max: What Are Most Advertisers Doing and Are They Right?
Here’s the TLDR on PMax data, which is framed more as questions than organizing by metric gains:
- This is not an “easy campaign” type. While only a small percentage of advertisers had campaigns in the red (3.92% of campaigns), advertisers who put in average effort got average results.
- There is no right answer on whether to segment your PMax campaigns through asset groups or a separate campaign. Use budget and priority of the product/service as your guiding lights.
- We as an industry have a bias for text assets but successful marketers have just as many images and are leveraging video they create.
- There is a bias around feed-only campaigns doing better than any other. While they do have a higher median ROAS, they also have the built-in bias of ecommerce having wider adoption of ROAS bidding.
Criteria for the Study
- The account needs to be active for at least 90 days prior to the investigation period
- Monthly spend needs to be at least $1000 per month and could not exceed $10 million per month
- The account needs to have conversion events firing successfully
- 7100 ad accounts and over 18K campaigns worldwide qualified for the study
Metrics/Questions
Question #1: What Does the Average Advertiser Do with PMax?
- 57.72% of advertisers run a single PMax campaign in their account
- 42.28% of advertisers run multiple PMax campaigns.
- While 41.35% of advertisers ran one campaign with one asset group, the median number of asset groups per campaign across all advertisers is 31.
- Advertisers load up on text assets (16 median per campaign), and image assets (13 median per campaign), but fall short with video (4 median per campaign).
- 99.2% of advertisers use audience signals.
- 33.3% of advertisers use search themes.
- 55.65% of advertisers use account exclusions in combination with PMax. These include negative keywords, placement exclusions, and topics.
- 72.5% of advertisers run feed-only campaigns.
Analysis/Thoughts
There are some biases in the data given that Optmyzr’s toolset proactively lets advertisers know if they’re missing audience signals. Additionally, there are tools for building out new shopping-oriented campaigns based on performance. This means our customer base is predisposed to harness feed-based PMax campaigns.
Despite those biases, there is no denying that feed-based PMax campaigns are the most popular. This is also due to ecommerce having a wider adoption of PMax than lead gen. There are a few reasons for this:
- Smart Shopping got rolled into PMax and so many ecommerce marketers felt compelled to leverage PMax.
- PMax thrives on ROAS bidding but can also function with CPA bidding. Lead-gen brands historically struggle to adopt ROAS bidding because they’re nervous about feeding bad data into the system.
Google-first advertisers tend to be more analytical than creative. This is absolutely shown in the bias towards text creative vs. visual. What’s interesting is that despite most PMax channels being visual, advertisers still cling to text (and expect amazing results).
Whether this is because they believe text is synonymous with bottom of the funnel, or because they are not confident or skilled to provide visual content; the fact remains that auto-generated content has a viable place in the marketplace until advertisers own it.
I was truly surprised that it’s essentially 50/50 on whether advertisers use exclusions with PMax. Given how vocal we are as an industry, I was expecting near-universal adoption. It’s unclear whether those who don’t use exclusions are doing so because they trust Google or if they don’t know how to apply exclusions.
Question #2: What Impact Does Applying Effort to PMax Have?
Before we dive into the numbers, it’s important to acknowledge the impact spend has on results. Larger spend accounts will have smaller gains because percentages are going to be smaller. We are sharing median values to mitigate this as much as possible.
Impact of Exclusions (negative keywords, placements, topics)
- Campaigns using exclusions (3963) have a median CPA of $21.45 and ROAS of 425.28%
- Campaigns not using exclusions (3158) have a median CPA of $18.55 and a ROAS of 423.44%
- There is only a .24% difference in conversion rate between campaigns using exclusions (favors not using exclusions)
Impact of Using Feed-Only vs All Creative Asset Campaigns
- Feed only campaigns have a median CPA of $21.58 and a ROAS of 502.21%
- All asset campaigns have a median CPA of $16.35 and a ROAS of 101.71%
- Feed only asset campaigns have a median conversion rate of 2.32% vs all asset campaigns with a conversion rate of 4.72%
Impact Of Using Audience Signals
Note: There is such a delta between accounts that use audience signals vs. those that don’t that we will only be highlighting the metrics of accounts that do. This is because we could only find 121 qualifying campaigns that didn’t use audience signals (compared with the over 14K that do). We’ll be sharing the performance gains vs the actual metrics.
- 35% better CPA
- 89% better ROAS
- 8% better conversion rate
Impact Of Using Search Themes
- Campaigns using search themes saw a median CPA of 22.46 and ROAS of 377.33%
- Abstaining from search themes resulted in median CPA of 20.30 and ROAS of 453.95%
- Conversion rate is flat between using Search Themes and not using them
Impact Of Segmenting PMax Campaigns By Asset Group
- Median ROAS of One Asset Group 424.57%
- Median ROAS of Multiple Asset Groups 461.64%
- Median ROAS of All Campaigns 426.66%
Analysis/Thoughts
There are some real surprises here on what impacts performance. I was not expecting Audience Signals to be such a big factor given that Google shared they’re designed to help teach the algorithm in the early days of the campaign. That near-universal adoption contributed to such big gains points to more utility than an early campaign boost.
Given that audience signals are so important, it’s critical that you’re setting yourself up to leverage them in the privacy-first world. Google now requires consent confirmation attached to your customer match lists and if you don’t include them, the list might fail.
Another big surprise was how tepid the results for search themes are. Given that search themes are designed to represent keywords in PMax, one would think adoption would serve better.
However, there was a sizable population of marketers using their keywords as search themes. This is a bad idea (unless the search themes/keywords are in transition) because Exact Match will always win over search themes.
However, Broad Match and Phrase can lose to search themes if the search theme syntax is closer.
The ideal workflow for search themes is to use them to test potential new Exact Match keywords. If you see your PMax campaign picking up more valuable traffic than your search campaigns, you know you need to consider adding those search themes as Exact Match keywords. Then you can test new search themes.

The control freak in me was disappointed that leveraging exclusions essentially represented a wash. That conversion rates were flat and the gains were very small on accounts that used exclusions makes one question if they are being used correctly.
I believe there is a strong human error component influencing the numbers (people not correctly applying account level negatives or not being aware of the form for campaign level).
That said, numbers don’t lie and it might be worth testing some campaigns without the human bias (provided brand standards are still accounted for).
Before we dive into the state of accounts in general, we wanted to address the biggest PMax question of all: is it worth it to do segmentation work?
Short answer: yes.
Long answer: your budget is going to influence whether you make this an asset-level or campaign-level segmentation.
If part of your business needs a specific budget, then asking one campaign to do all the work might be tough (especially if you’re serving multiple time zones/cost-of-living geos).
Conversely, if margins and value are essentially the same, you likely can save budget by consolidating with a multi-asset group PMax campaign (you can have up to 100 asset groups).
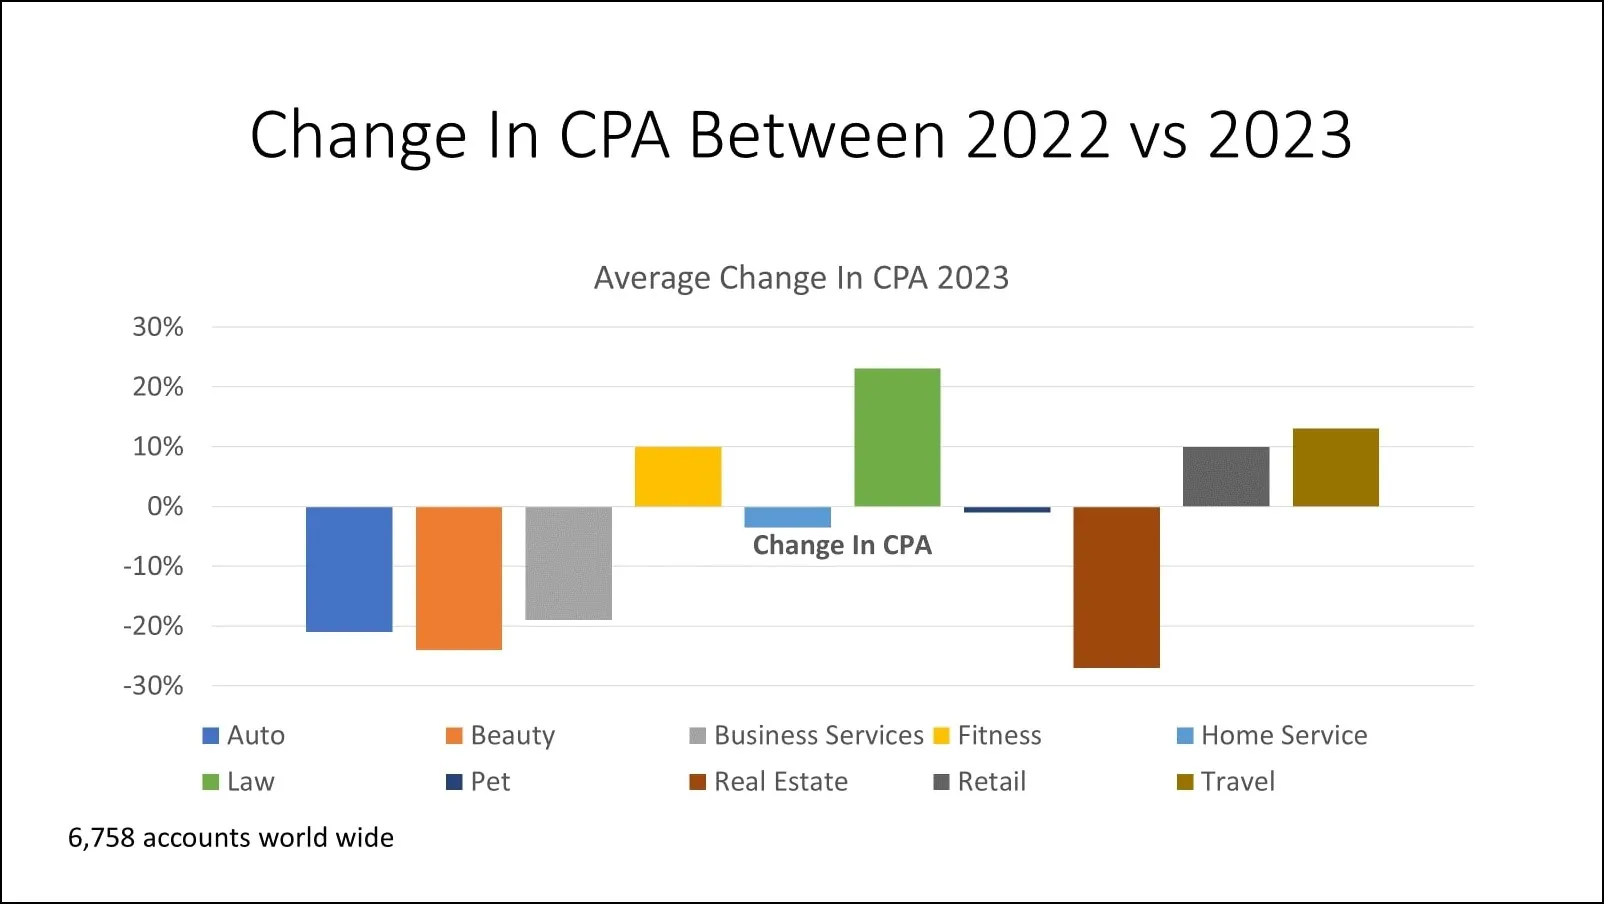
Industry View on CPCs, CPAs, ROAS, Spend & What You Can Do About It
Last year at the Global Search Awards, I had a great conversation with Amanda Farley about her suspicion that CPCs were being jacked up by human error and panic. We both agreed that the volatility in the economy and the fluctuations on the SEO side were causing erratic spending. Yet without data, we couldn’t quite put our finger on it.
Here’s a look at 2023 main metrics for the major verticals in the Optmyzr customer base. A few notes about the data:
- This data is based on 6758 accounts globally.
- We are including the Median change as opposed to the hard numbers. This is because accounts have a number of different factors and getting caught up in a specific number isn’t as useful as finding the profitable number for you.
Metrics
Vertical Breakdown
We looked at 6,758 accounts worldwide and compared their average and median performance difference between 2022 and 2023.
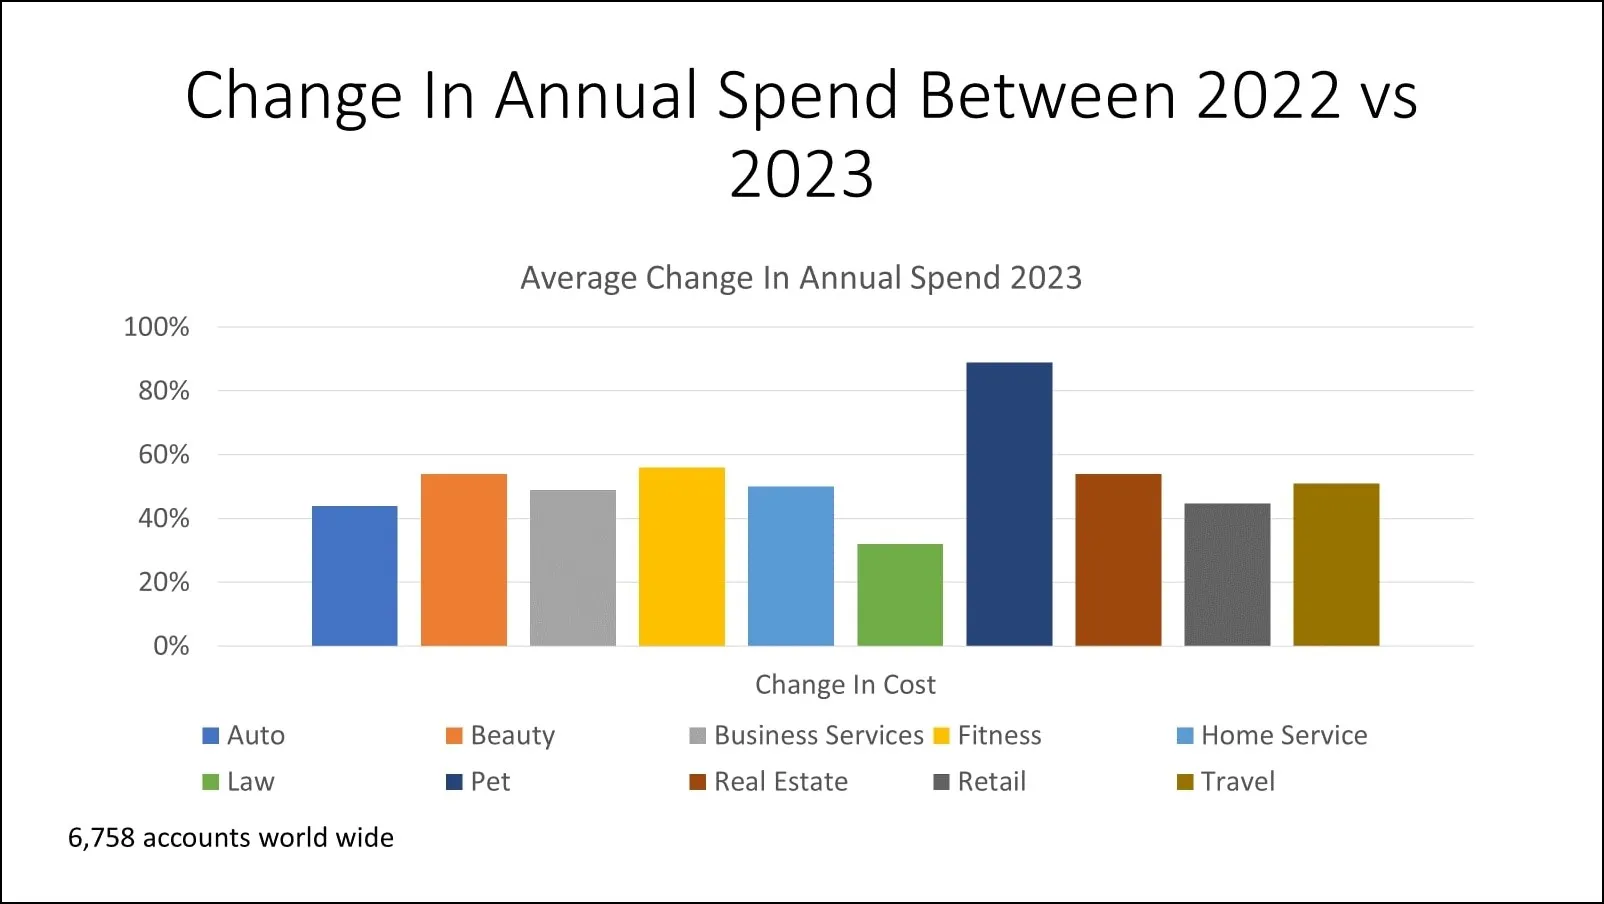
Core Findings for Cost
- Spending being up across the board could have been a bad thing. However, as the ROAS and CPA graphs show, many industries have seen greater success in 2023 than in 2022.
- There were a number of big SEO updates in 2023, so there is a certain degree of mitigation spend vs success spend.
- The big spike in the Pet vertical is in large part due to budgets being smaller.
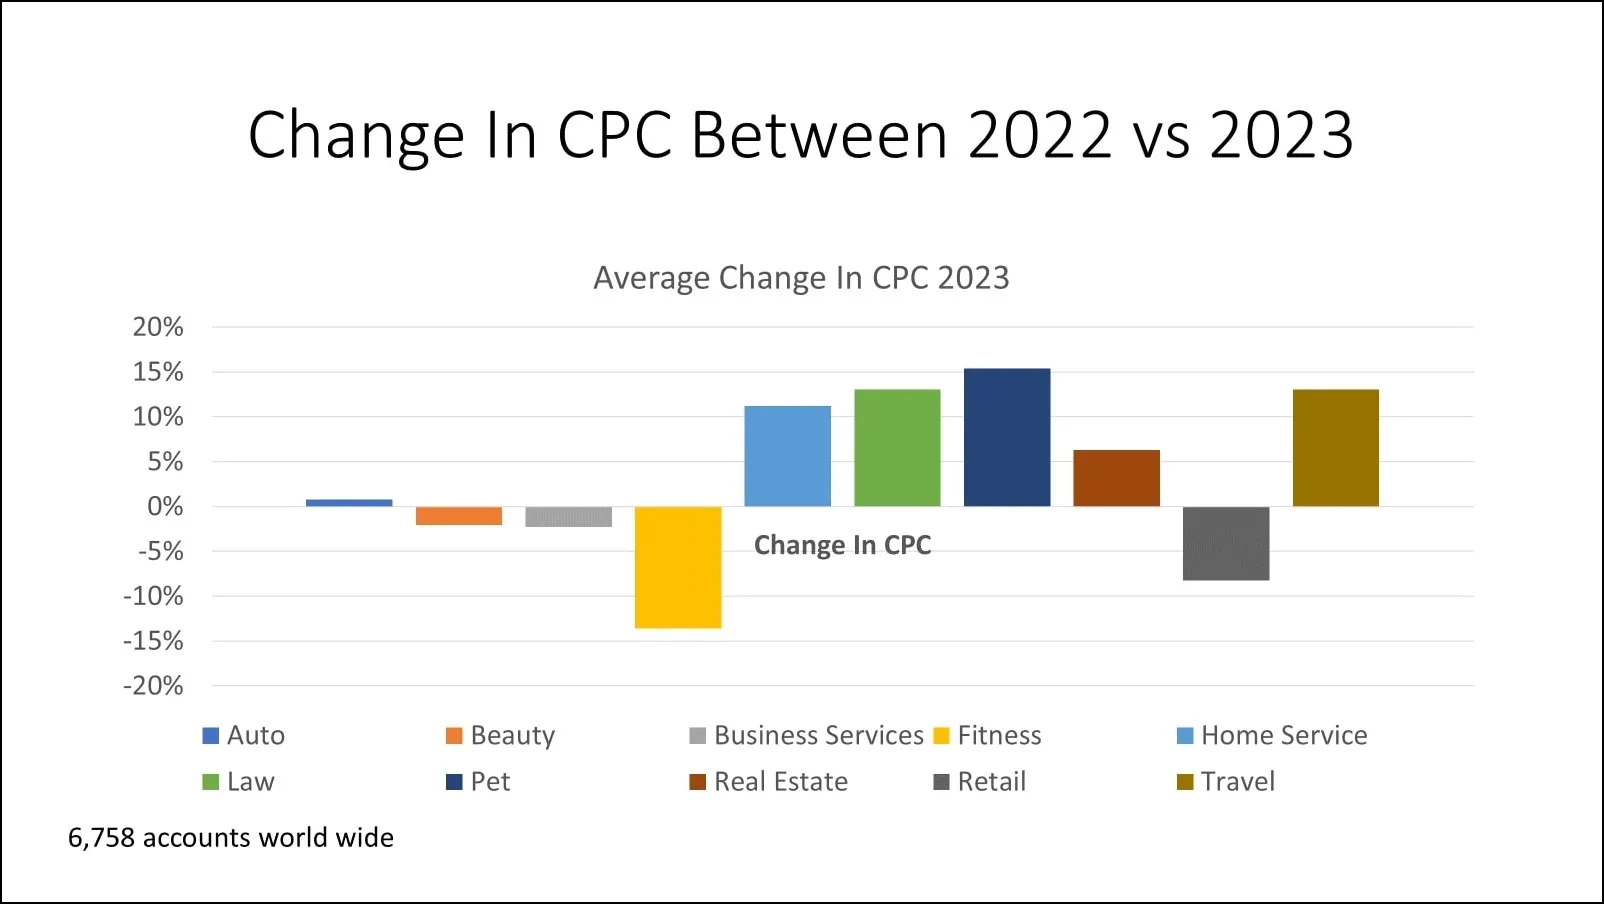
Core Findings for CPC
- PMax plays a large role in the reduced CPCs. Given that visual placements have cheaper auctions and are a big factor in PMax campaigns, it makes sense that CPCs would trend down.
- Verticals that saw spikes in CPCs (home services, law, pet, real estate, and travel) represent ties to other ad types (Local Service Ads and Hotel Ads). While those spends aren’t factored in the study, it’s worth noting that those ad types have gained much stronger adoption as CPCs rise.
- We found that accounts using portfolio bidding with bid caps (either through the ad platform or using Optmyzr budget pacing tools) can help set protections in place while still leveraging smart bidding.
Core Findings for CPA
- Legal is the big loser here and there are a few reasons for this: inability to leverage automation/AI due to brand restrictions, choosing ego bidding over cost-effective cost per case, and greater adoption of offline conversions factoring in the volatility of legal leads.
- The fairly flat or decrease in CPA in other verticals speaks to consumer confidence, as well as a rise in micro-conversions. Accounts by in large do not use the conversion exclusion tool, which means the influx of Google-created conversions from GA4 might be a factor here.
- Auto and real estate having such strong performance are tied to each other as more and more folks push for home ownership but might be forced to move outside their working cities.

Core Findings for ROAS
- ROAS up or flat across the board could be taken as a stamp of approval for PMax or could be a sign that more folks are adopting ROAS bidding.
- It’s worth noting that CPA decreases for the most part did not result in ROAS losses.
- The general “frustration” in the market is likely from ecommerce. With CPAs up 10% and ROAS essentially flat, it speaks to consumer restraint as well as the emergence of TikTok Shops, Temu, Advantage+, and increased Amazon adoption.
Value Of Branded Campaigns
| No. of accounts | CPC | CTR | Conv Rate | ROAS | CPA | |
| Accounts that do not contain any branded campaign | 9118 | 0.48 | 2.10% | 7.24% | 449.37% | 6.65 |
| Accounts that contain at least 1 branded campaign | 10201 | 0.73 | 1.85% | 7.97% | 559.80% | 9.15 |
Analysis/Thoughts
Here’s why we included the branded analysis with the vertical one: the impact on CPC and subsequent CPA/ROAS.
Branded campaigns have historically been heralded as an easy way to ramp up campaign performance. However, with the rise of PMax and the general flux in spend, the clear benefits and “best practice” level adoption are up in the air.
The ROAS and conversion rate gains aren’t that significant and all other metrics favor accounts that don’t run branded campaigns.
Based on the PMax adoption and the spend data I have two potential reasons for this:
- Advertisers are jaded and have rolled branded spend into PMax and are treating PMax campaigns as branded/quasi remarketing campaigns. While I don’t think this is wise (especially given how search themes work and the ability to exclude branded), there’s no denying the level of cynicism that’s crept into the space.
- Google has gotten smarter/better and no longer needs branded campaigns to understand an account has valuable campaigns.
Ultimately I still believe there is utility in a small-budget branded campaign because that way you can add it as a negative everywhere else.
Regarding the Vertical Spend Data
It is genuinely surprising to see every vertical spending more (regardless of performance gains or losses). This speaks to scares from the SEO side of the house and folks feeling like they need to make up the volume through paid. While we did hear some sentiment around fears in rising CPAs and CPCs, it’s worth noting Optmyzr customers for the most part saw cheaper CPAs and greater ROAS (with legal being a major exception).
We investigated how many ads per ad group each vertical had and were not terribly surprised all but Auto had a median of 1 (Auto has 2). This speaks to the trust among most advertisers (53%) to follow Google’s advice on the number of assets.
Many advertisers focus on Google first, regardless of whether that channel will serve them well. If you’re going to advertise on Google you need to make sure you can fit enough clicks in your day to get enough conversions for the campaign to make sense.
One of the reasons Optmyzr builds beyond Google is we see the importance of harnessing social and other search channels. Don’t feel trapped by habit.
That said, despite upticks in spend, there are clearly winning verticals, and all verticals came in flat or up on ROAS.
The Time for Automation Is Now
There has never been a better time to embrace automation layering in PPC. Having the ability to put safety precautions on bids as well as the importance of honoring what tasks will yield the highest ROI on time is mission critical.
Whether you’re an Optmyzr customer or not, you should be empowered to own your data and your creative. PMax is a staple campaign type at this point and fighting it is just going to leave you behind. However, not every task needs to be done and ultimately budget should determine how much you segment.
Keywords may be dancing between relevance and history, but until the ad networks retire them, it is important to know that Exact Match is where performance is and Broad Match is where testing lies.