Need to evaluate Performance Max? Start here.
In this article, we’ll explore the many areas to consider and explore when evaluating Google Ads Performance Max (i.e. PMax) campaigns.
Given the current limitations of insights we can pull from these campaigns, it can be difficult to understand the causes of performance fluctuations. This guide is here to make accomplishing that task easier than ever.
First Principles: Getting Familiar With The Context Of Our Data
Let’s begin with some first principles.
First off, it might be too soon to freak out!
Familiarize yourself with your estimated conversion reporting delay and the average days to conversion after the first ad interaction in your account for the conversion action that you’re analyzing.
Does it usually take 7 days before all conversion metrics are reported? Does it usually take 11 days until a customer completes a purchase after their first interaction with your ads?
In either case, if it’s only been a few days since your last major change to the campaign, it might be best to wait several more days before rushing to any major conclusions about performance.
Try to have as much of a complete picture of conversion metrics and the typical buying journey of your customers as you can before judging the outcome of your recent changes too harshly.
One quick way to check your recent average conversion reporting delay is by navigating to the Campaigns section of your account and changing the date range to Today, then hovering your mouse over the Conversions metric in the Account row.
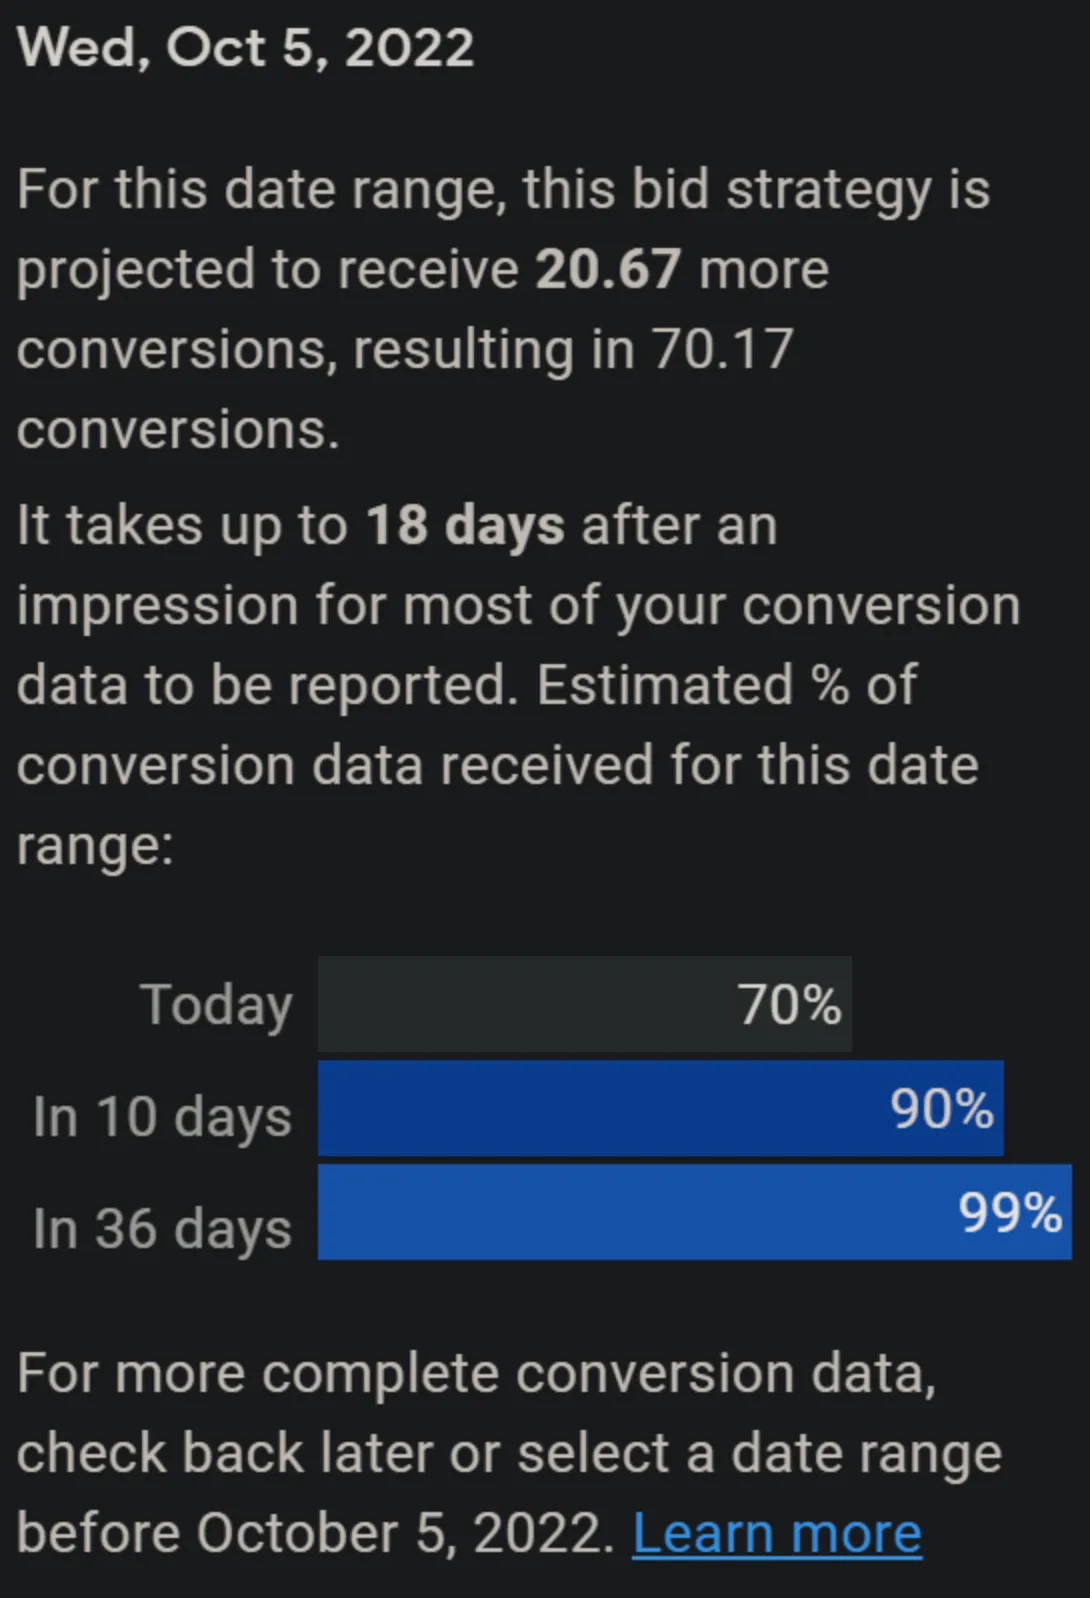
This helps you understand, on a high-level, how long it takes customers who see and click your ad to complete a particular conversion action. Conversions can be reported up to 90 days after the click, depending on the conversion window you’ve chosen for that particular conversion action.
Pro Tip: If you’d ever like to see the conversions that actually occurred on a given date, use the “Conversions (by conv. time)” metrics. Do note, however, that conversion by time data is only available after March 6, 2019.
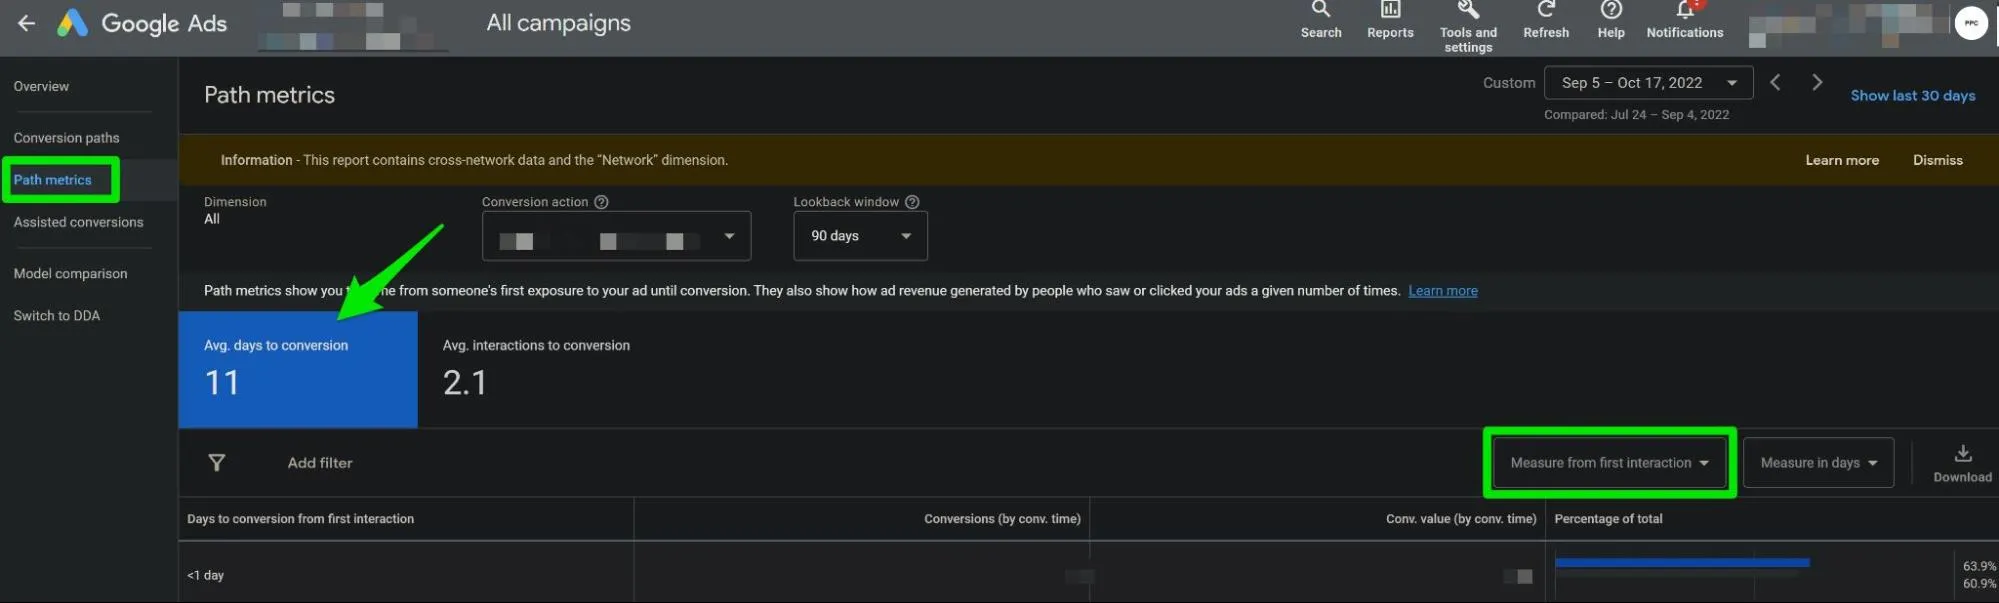
Now take an account-level look at the average days to conversion for the conversion action you’re analyzing by navigating to the Attribution > Path metrics section of your account. You’ll find this section under “Tools and settings” (top-right of page) > Measurement > Attribution.
Then click “Path metrics” on the left-side of the page. Once there, change the “Conversion action” filter as needed, choose an appropriate attribution Lookback window, choose a conversion window to analyze by changing the date range, then change the “Measure from last interaction” to “Measure from first interaction.”
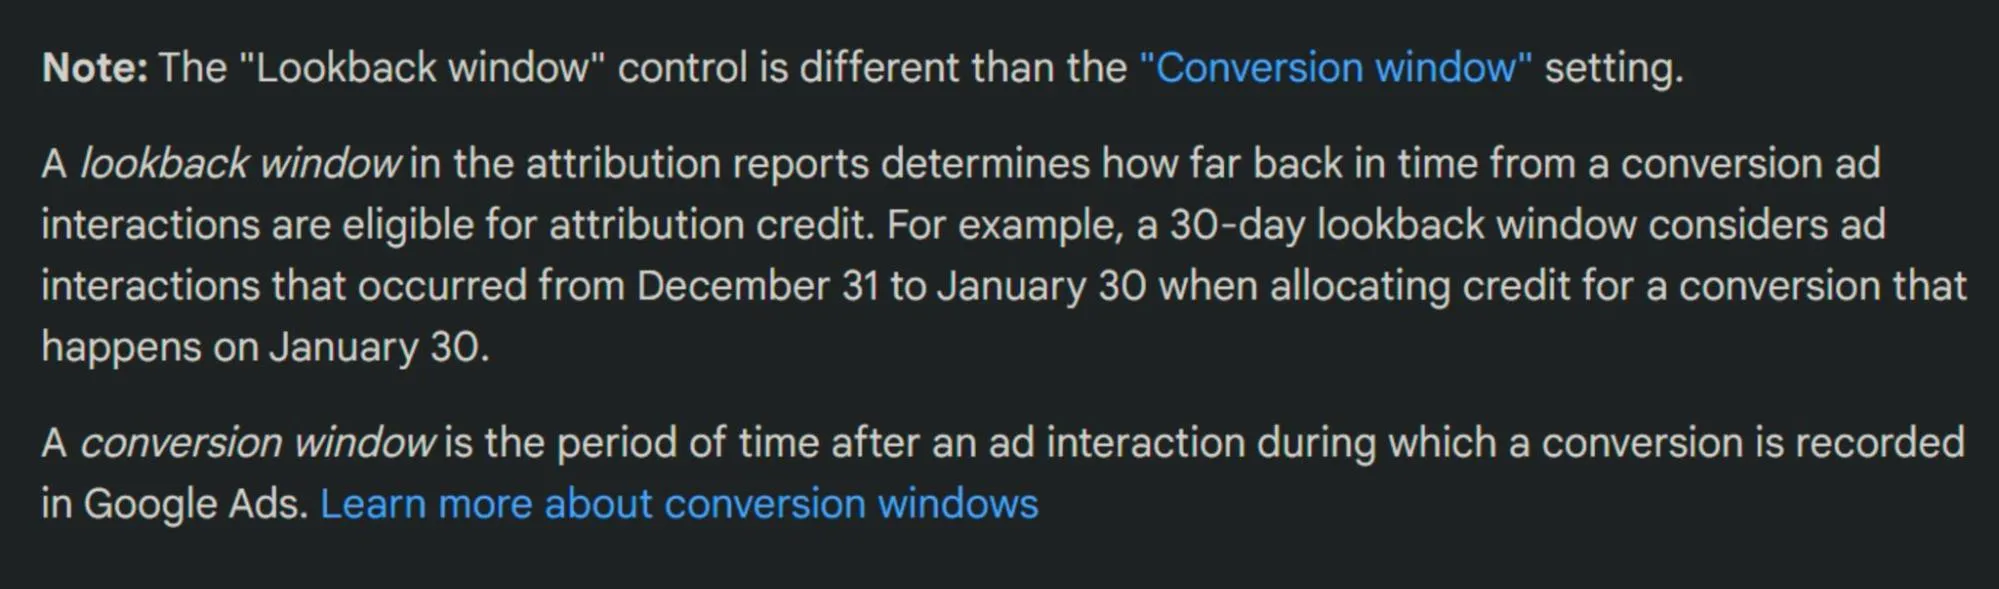
Note the difference between Lookback window and Conversion window, per Google:
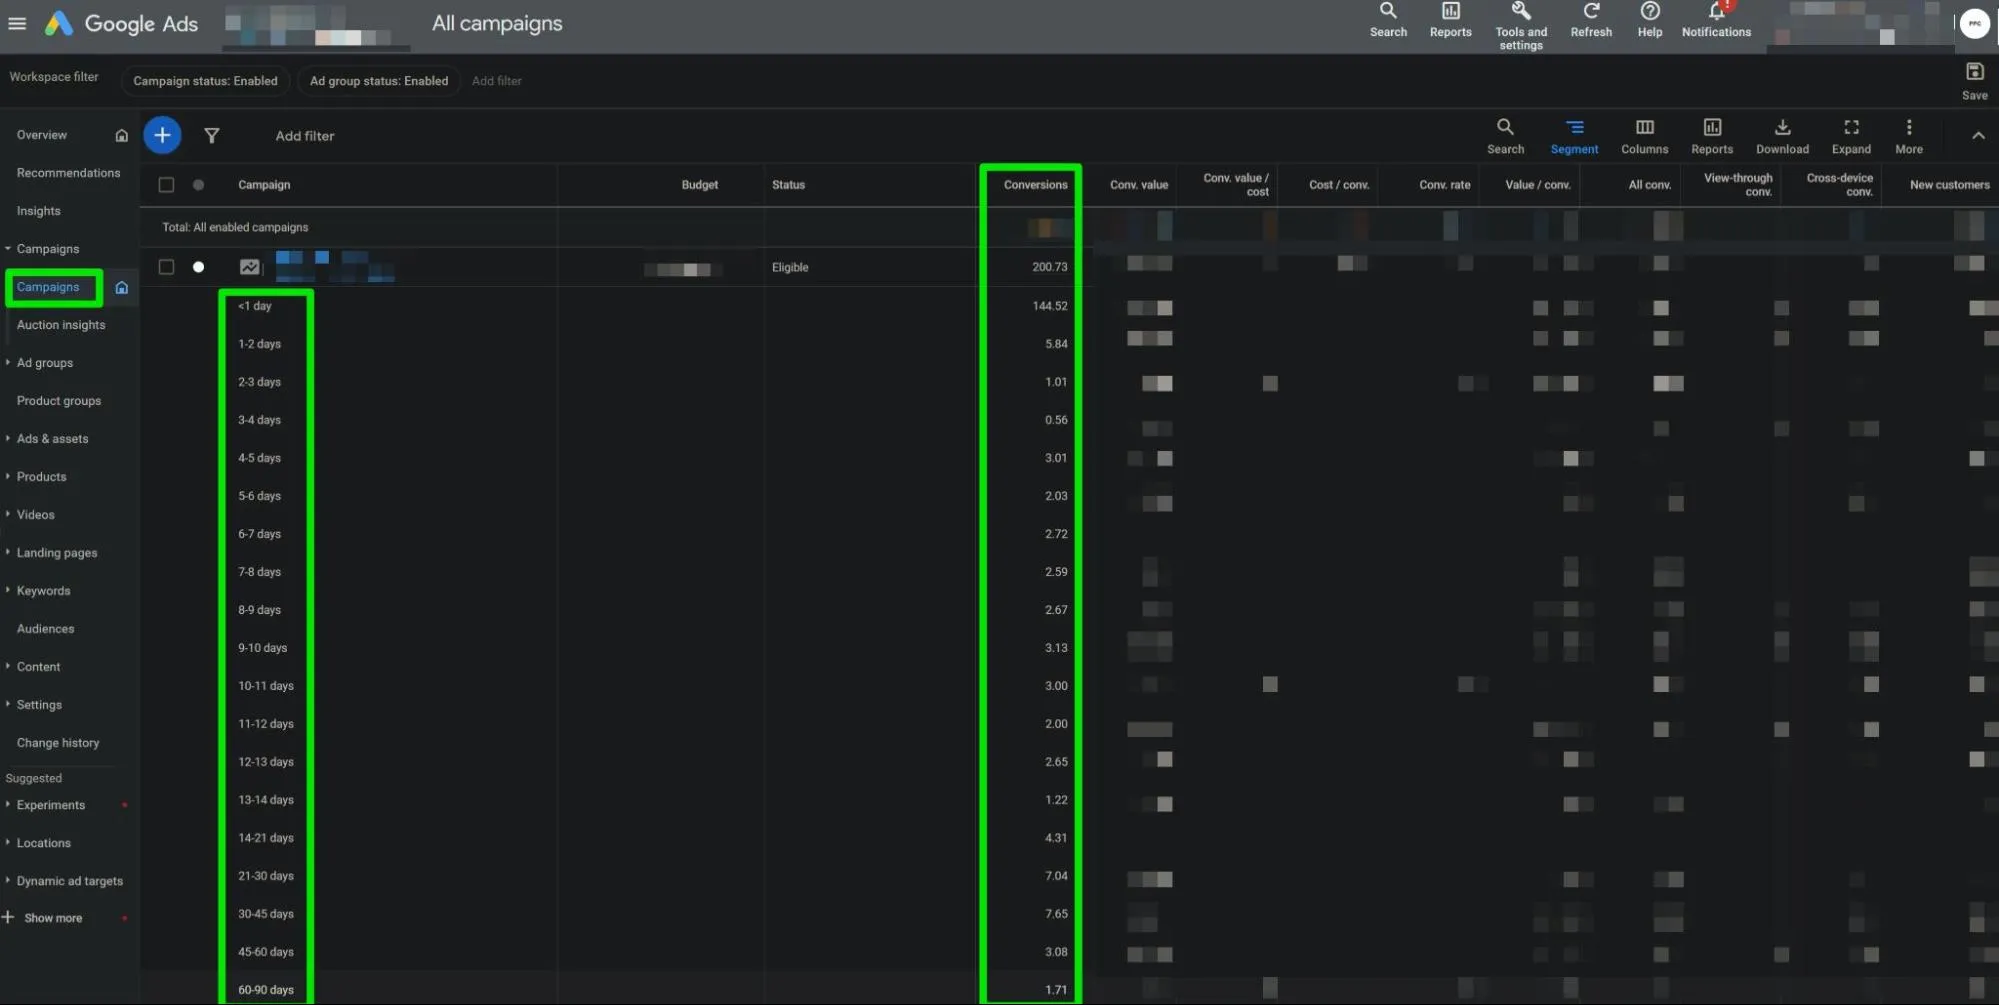
To see this in more detail and view the average days to conversion for the PMax campaign you’re investigating, add the Conversions > Days to Conversion segment to your Campaigns data table.
Usual Suspects (Non-PMax Specific): Most Common Indirect Causes Of Performance Fluctuation
Okay, so we’ve identified that we are indeed justified in our freakout. What now?
Let’s first investigate the “usual suspects” of major changes to PMax performance.
Conversion Tracking
Have there been any changes that may have affected conversion tracking?
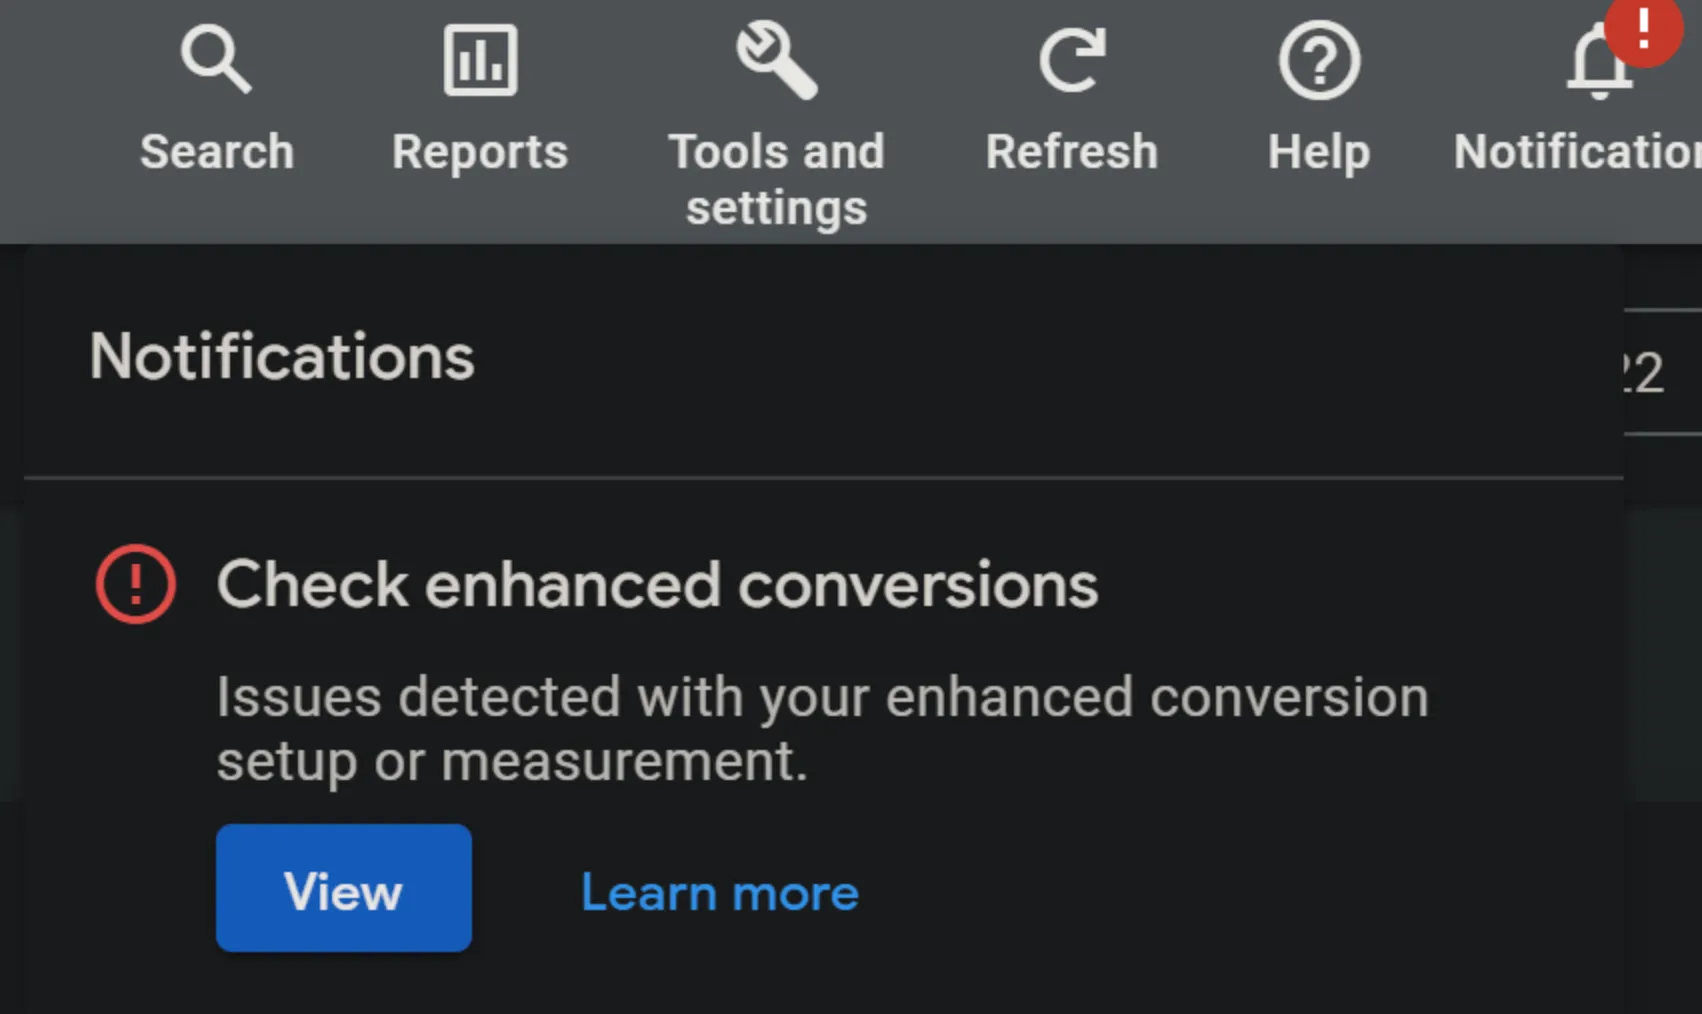
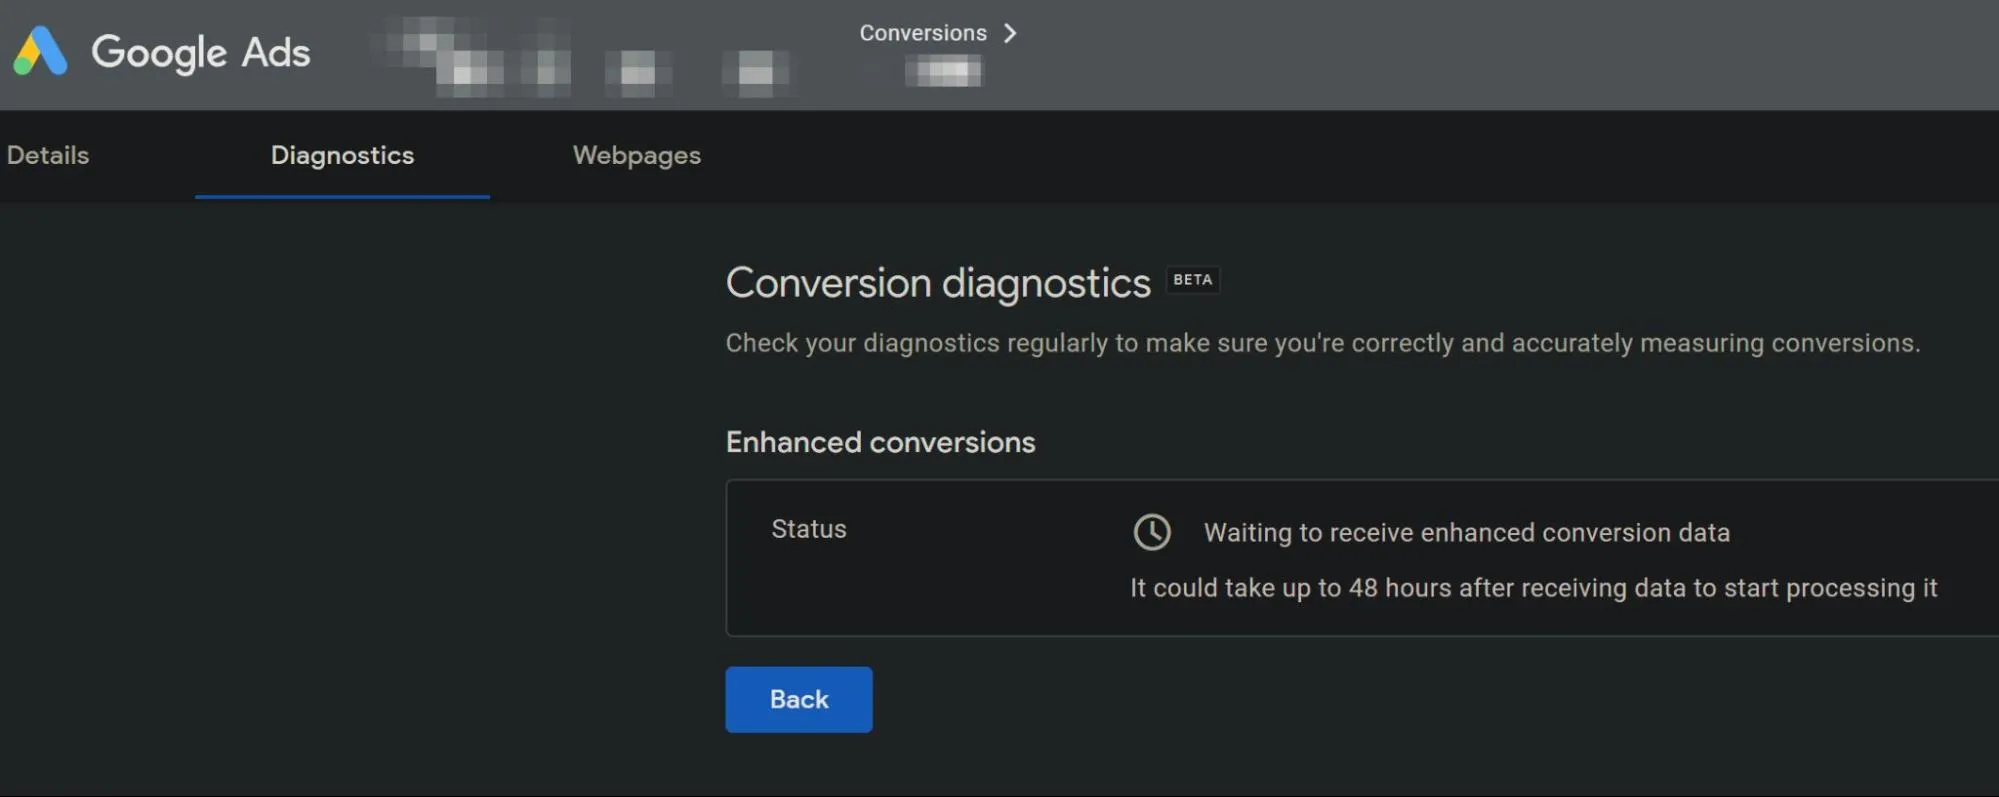
For example, has there been any changes to the source code of your site or Google Tag Manager, or are there any error messages showing in the Conversions section of Google Ads, the Diagnostics section of any of your Primary conversion actions in Google Ads, the Overview section of your Google Ads account, or the Google Ads Tag or Google Analytics sections of your Google Ads account within the Your Data Sources area of Audience Manager?
![]()
Budget, Bidding, Asset Group, & Listing Group Changes
Have there been any changes to the campaigns budget, bidding, or Asset Groups since performance improved or worsened?
Changes to any of these three can have major impacts on performance - especially relatively large budget increases or decreases, bid strategy type changes, enabling or disabling of Asset Groups, or Listing Group product additions or exclusions.
Google Merchant Center Issues or Major Product Feed Changes
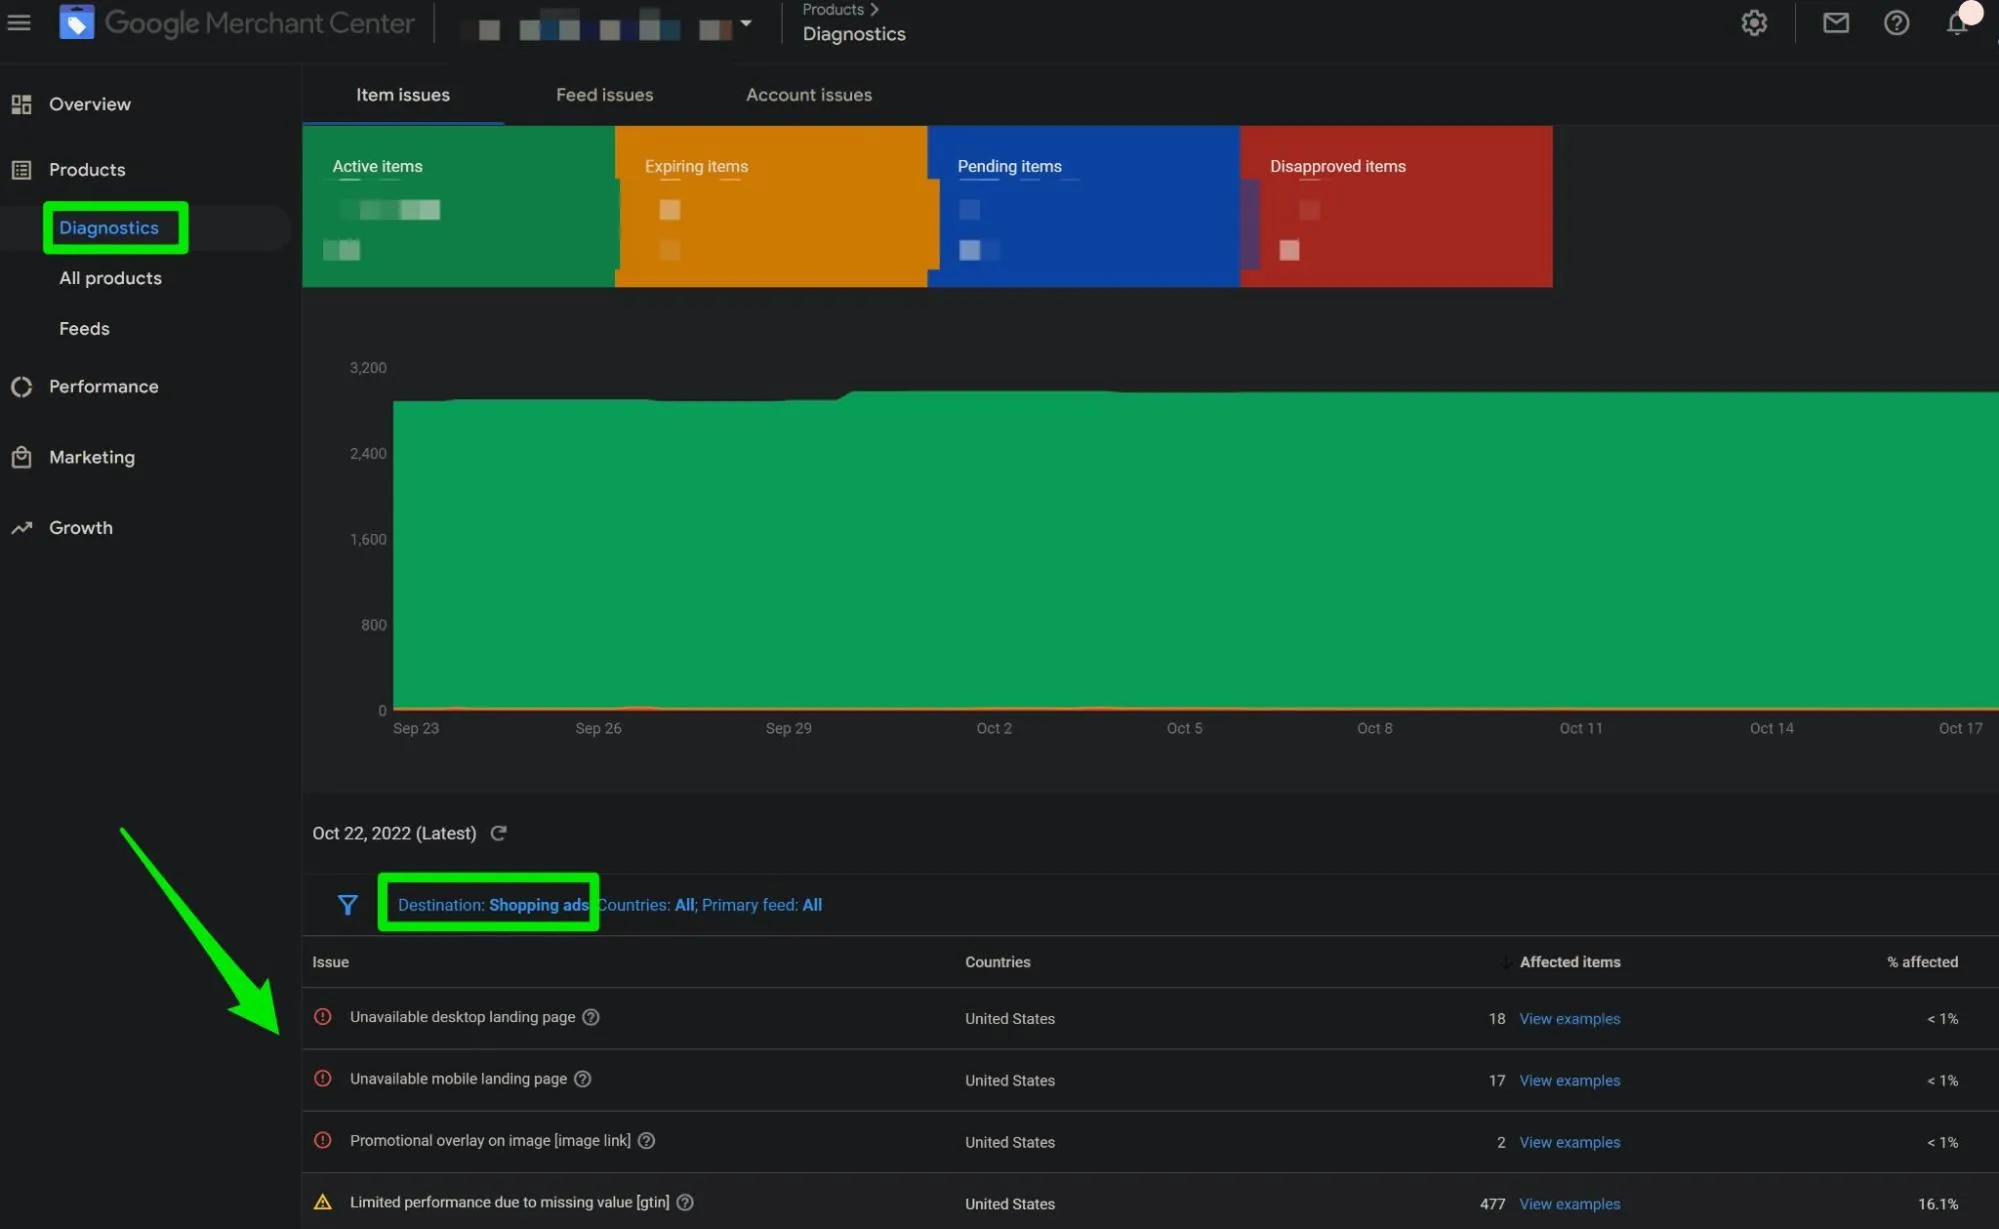
Check the Diagnostics section of your Google Merchant Center account for any recent disapprovals or warnings. Also, check the bell icon on the top-right of your Google Merchant Center account to see if there are any other notifications of issues that may be impacting the performance of your Shopping ads.
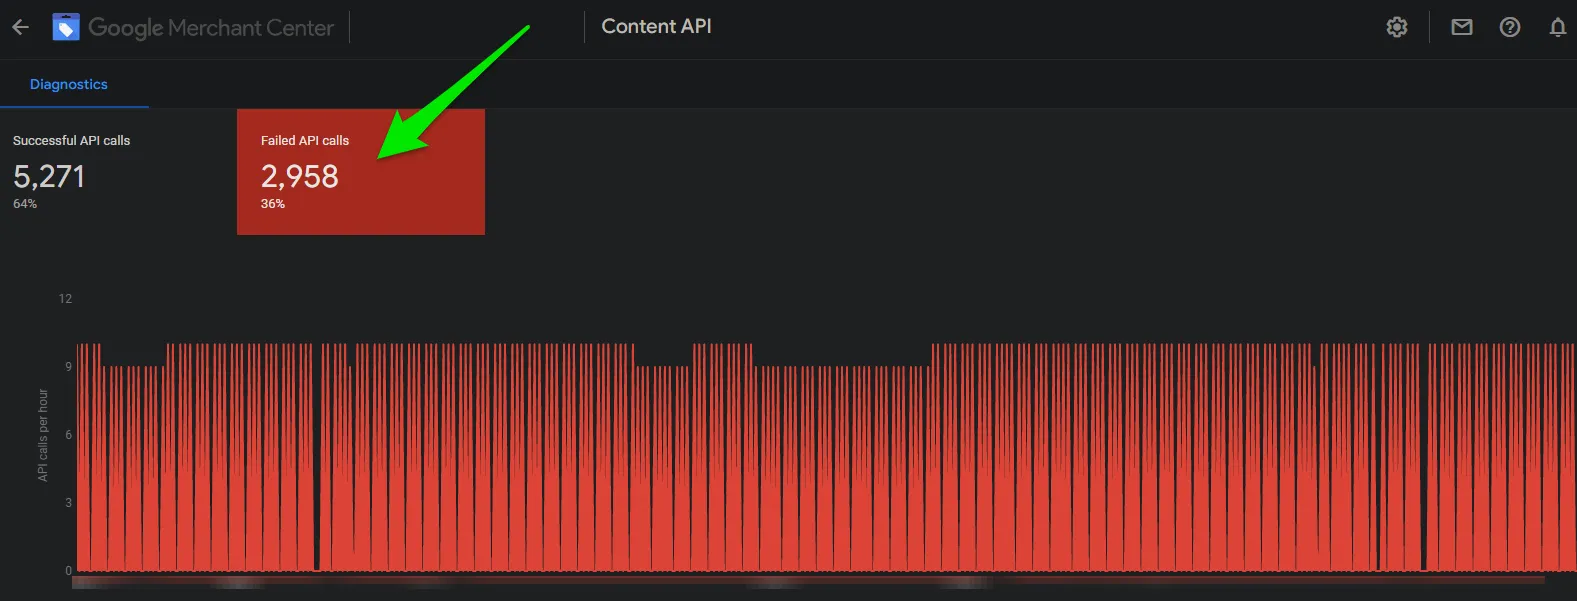
If you’re utilizing a Content API setup within your Google Merchant Center, don’t forget to check the Diagnostics report within the Content API section of your Google Merchant Center account as well. Are there major or consistent failed API calls occurring that may be impacting your Shopping ads?
Have there been any changes to your product feed that may have affected performance? If Supplemental Feeds are in use, are they still in sync and up-to-date with your primary product feed?
Site Changes
Have there been any changes to your site such as site navigation, checkout flows, CMS plugins, web hosting, or product pages?
Even seemingly minor changes to the site can cause major, unexpected negative consequences to the performance of your PMax campaigns.
Make sure you remain “in the loop” of any changes that occur to the site so you can closely monitor their potential impacts on performance - especially any changes that might impact conversion tracking or the product pages of best sellers.
Any recent changes to products going in or out of stock on your site, especially for any best sellers? Any recent changes to product pricing or promotions, customer shipping costs or free shipping offer thresholds?
Any extremely negative reviews showing on the site, or elsewhere for your products (e.g. on Amazon, on high-traffic volume review sites)?
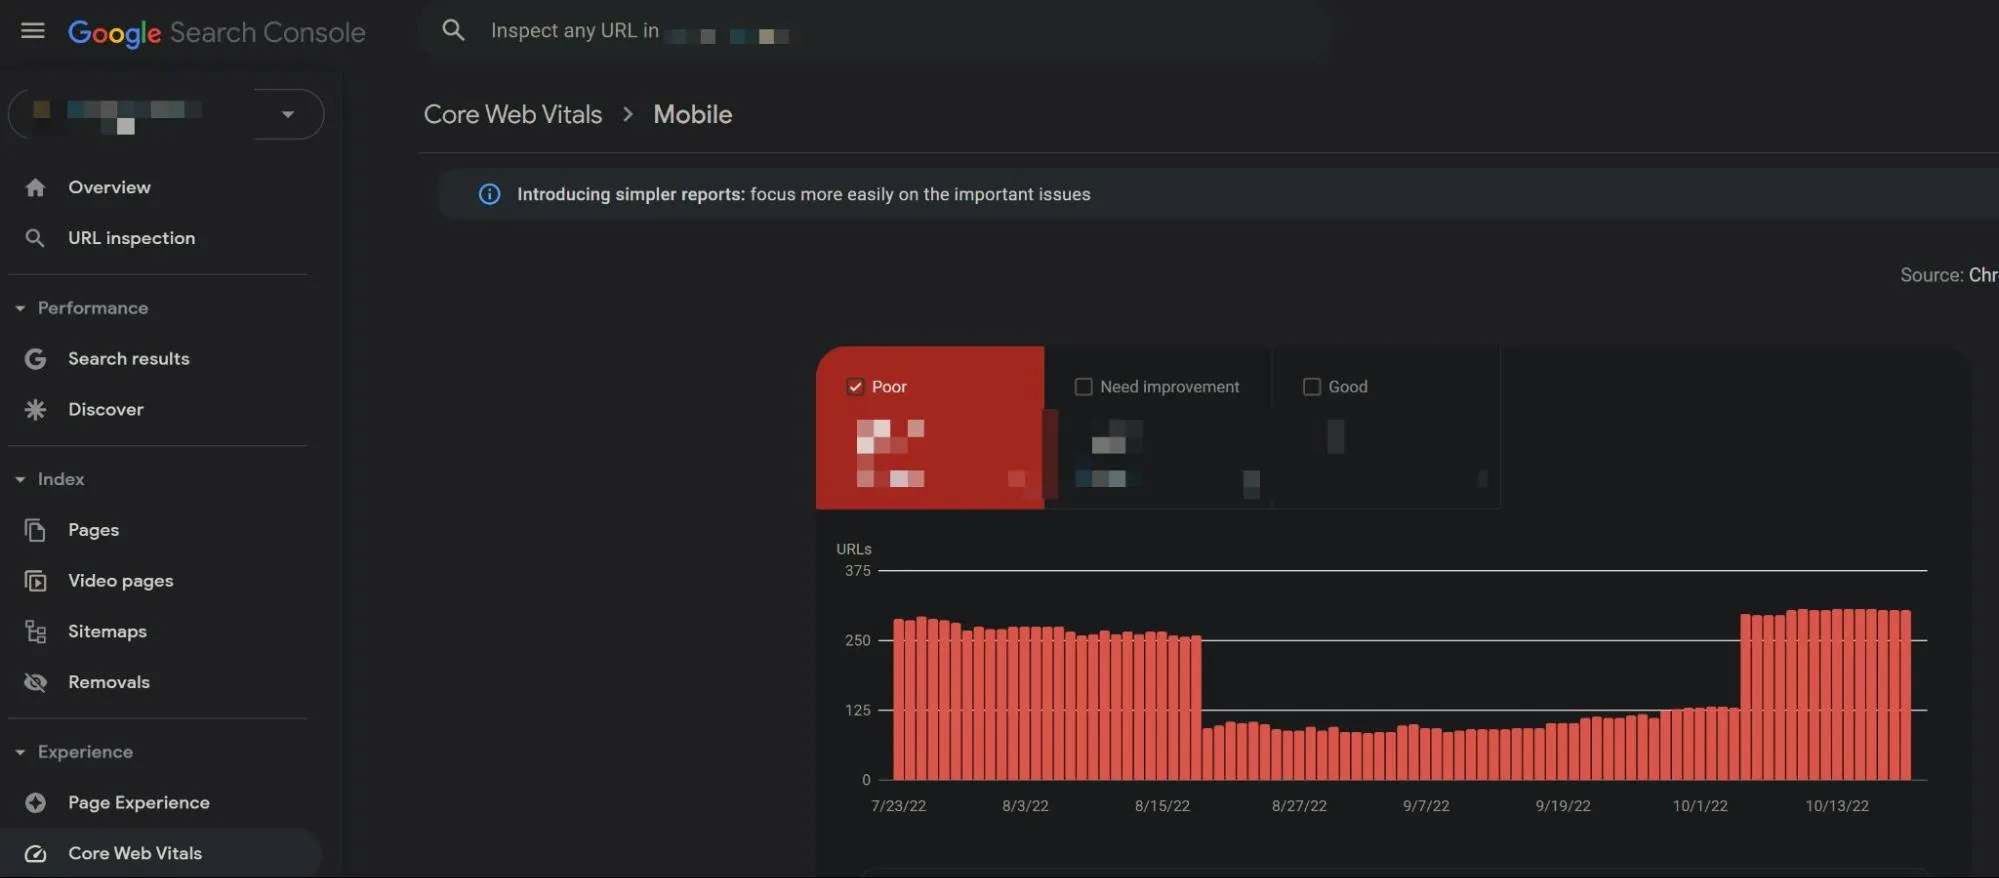
Google Search Console
If you use Google Search Console, are all pages on your site that you want Google to crawl indexed with Google Search Console? Are there any important URLs that are now showing as “Failing” in the Core Web Vitals section of your Google Search Console account?
Market
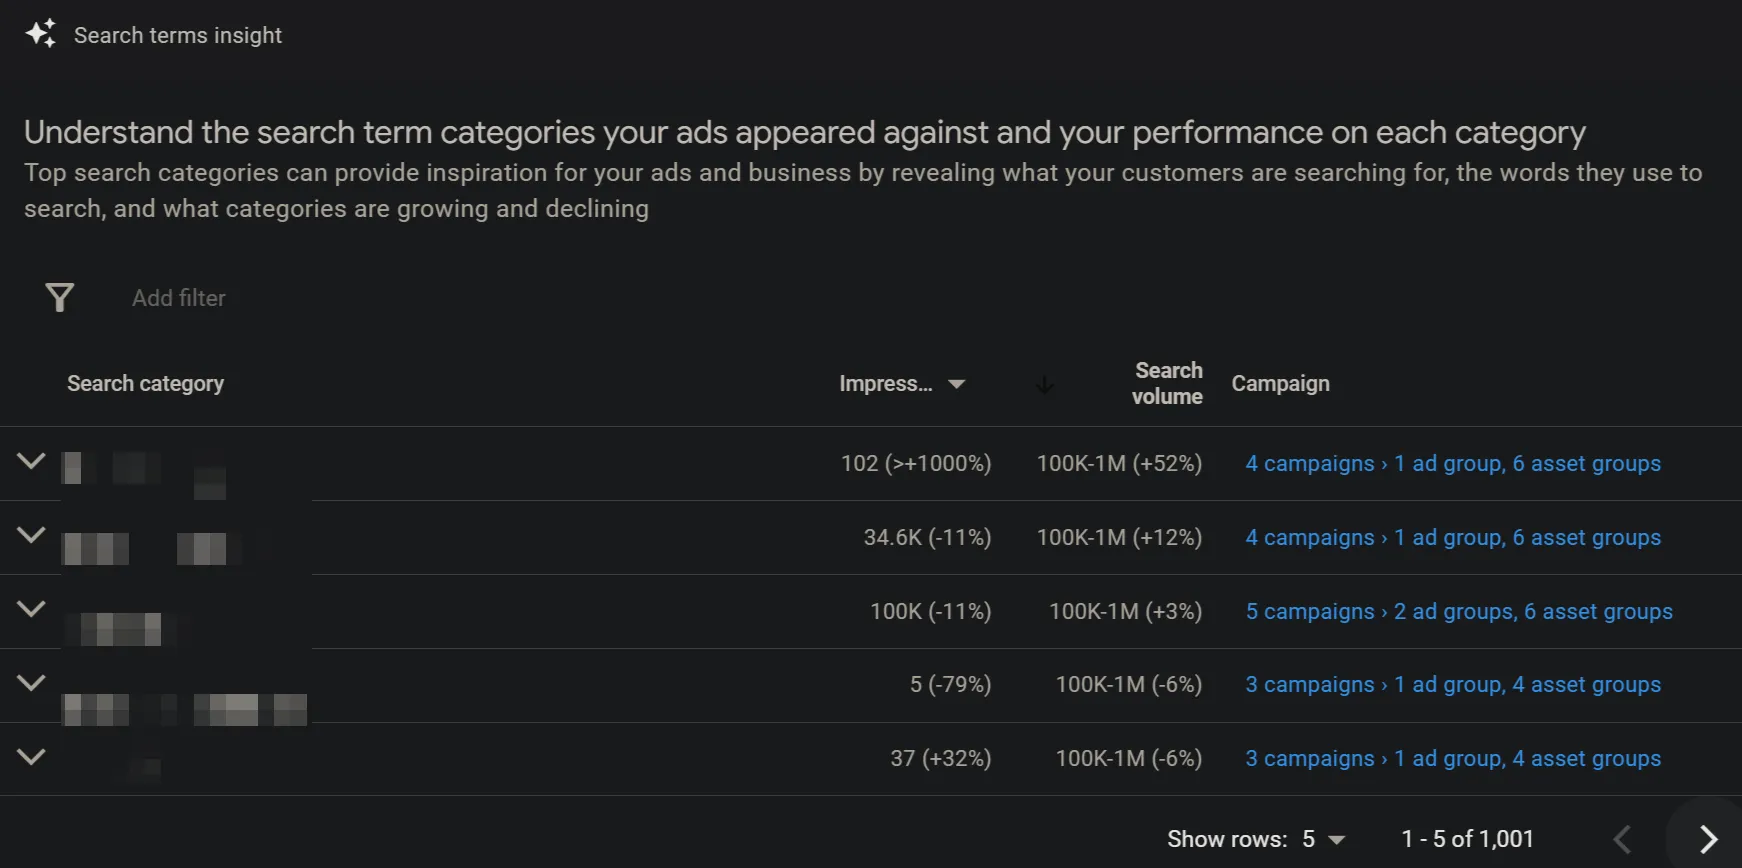
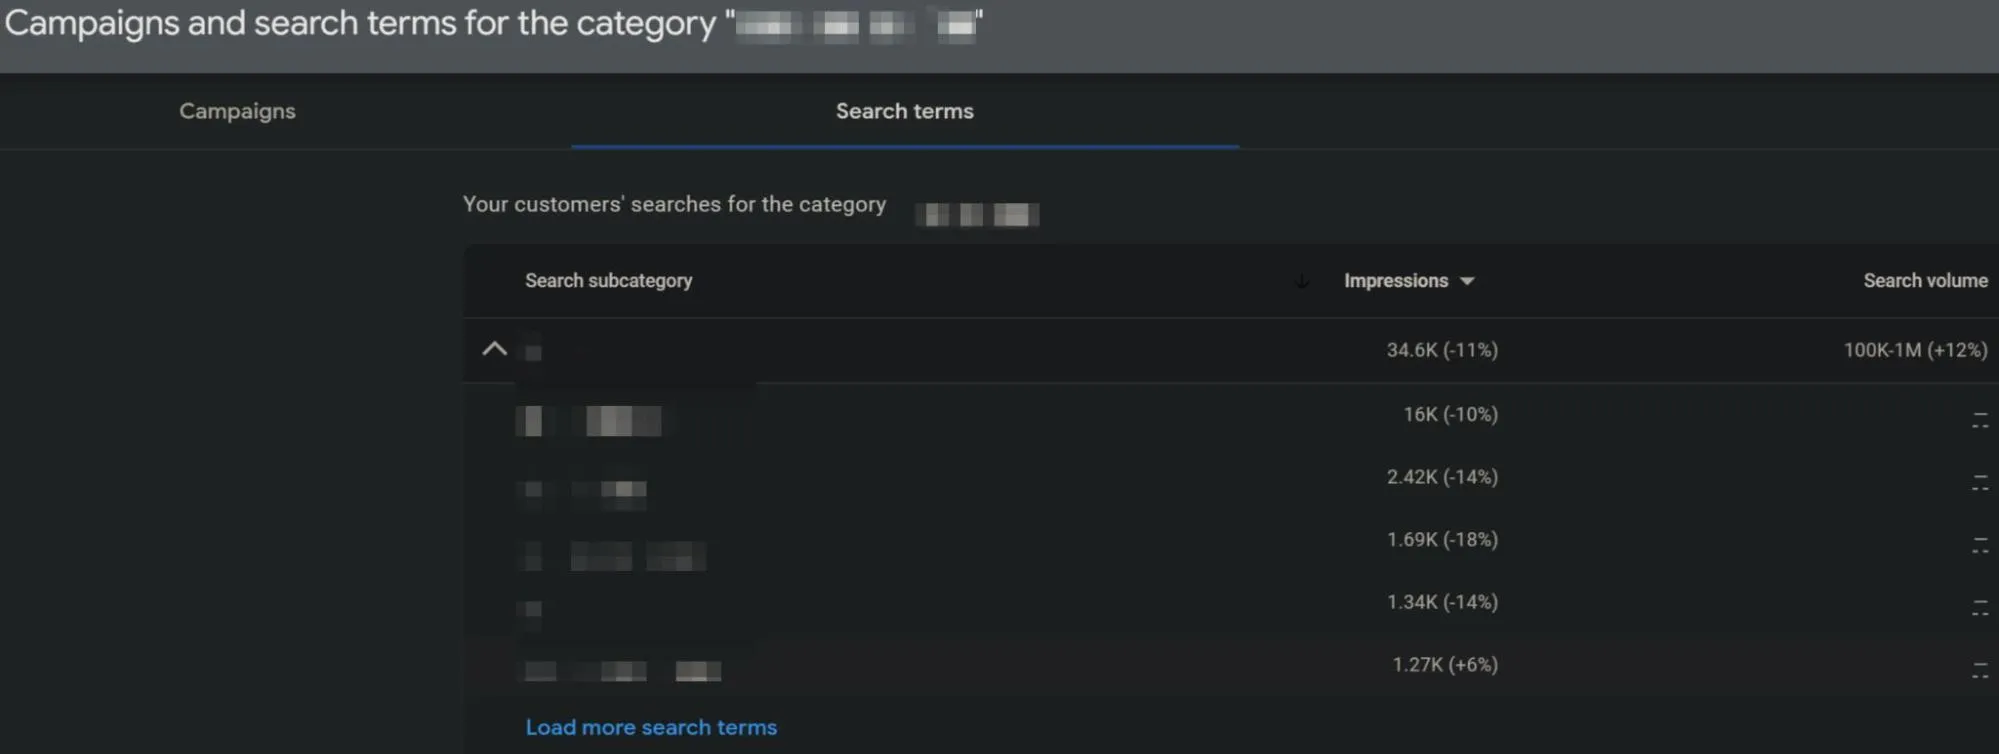
Evaluate changes in the search behavior for your products by reviewing, if available, the Search Terms and Search Trend Insight data in the Insights section of your Performance Max campaign and your Google Ads account as a whole.
Pay particular attention to high search volume Search Categories and search terms that have incurred large positive or negative shifts in metrics like impressions and conversions.
Outside of high search volume terms, are you seeing major shifts in the performance of other terms you’ve deemed are important, such as branded, competitor, top-of-funnel, or commercial-intent-oriented searches?
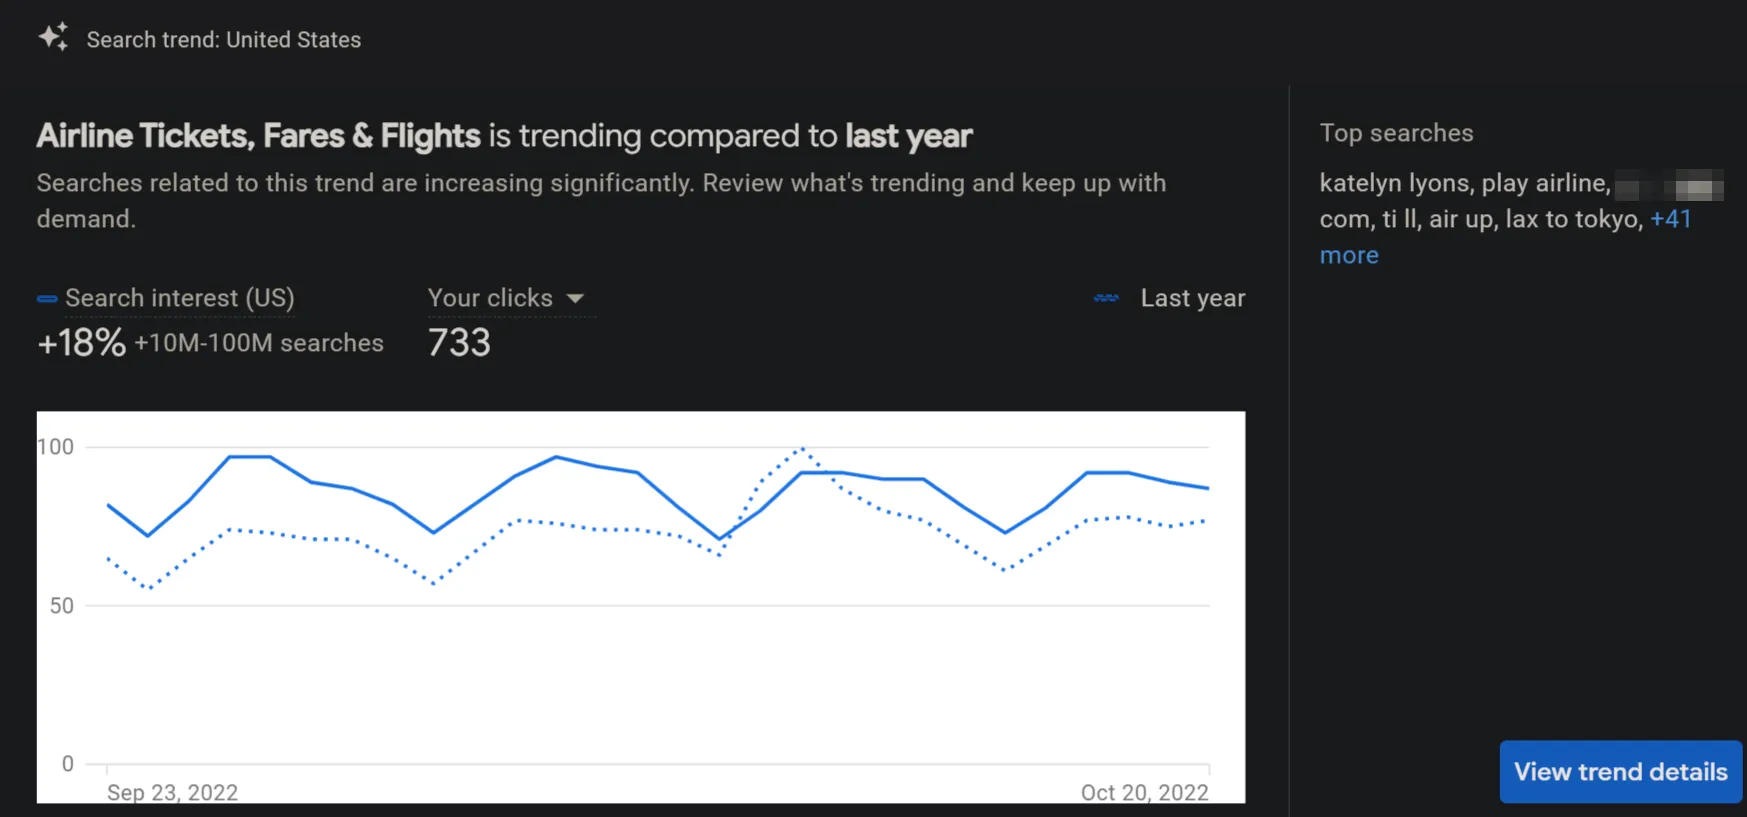
Note that Search Trend Insight data is not available for all advertisers, or these insights may not be very relevant to the products you’re offering, but do check-in periodically to see if new insights emerge.
Google will, at times, provide a notification to new insights such as these in the “Notifications” feature of your account - found by clicking the bell icon in the top-right corner of your Google Ads account.
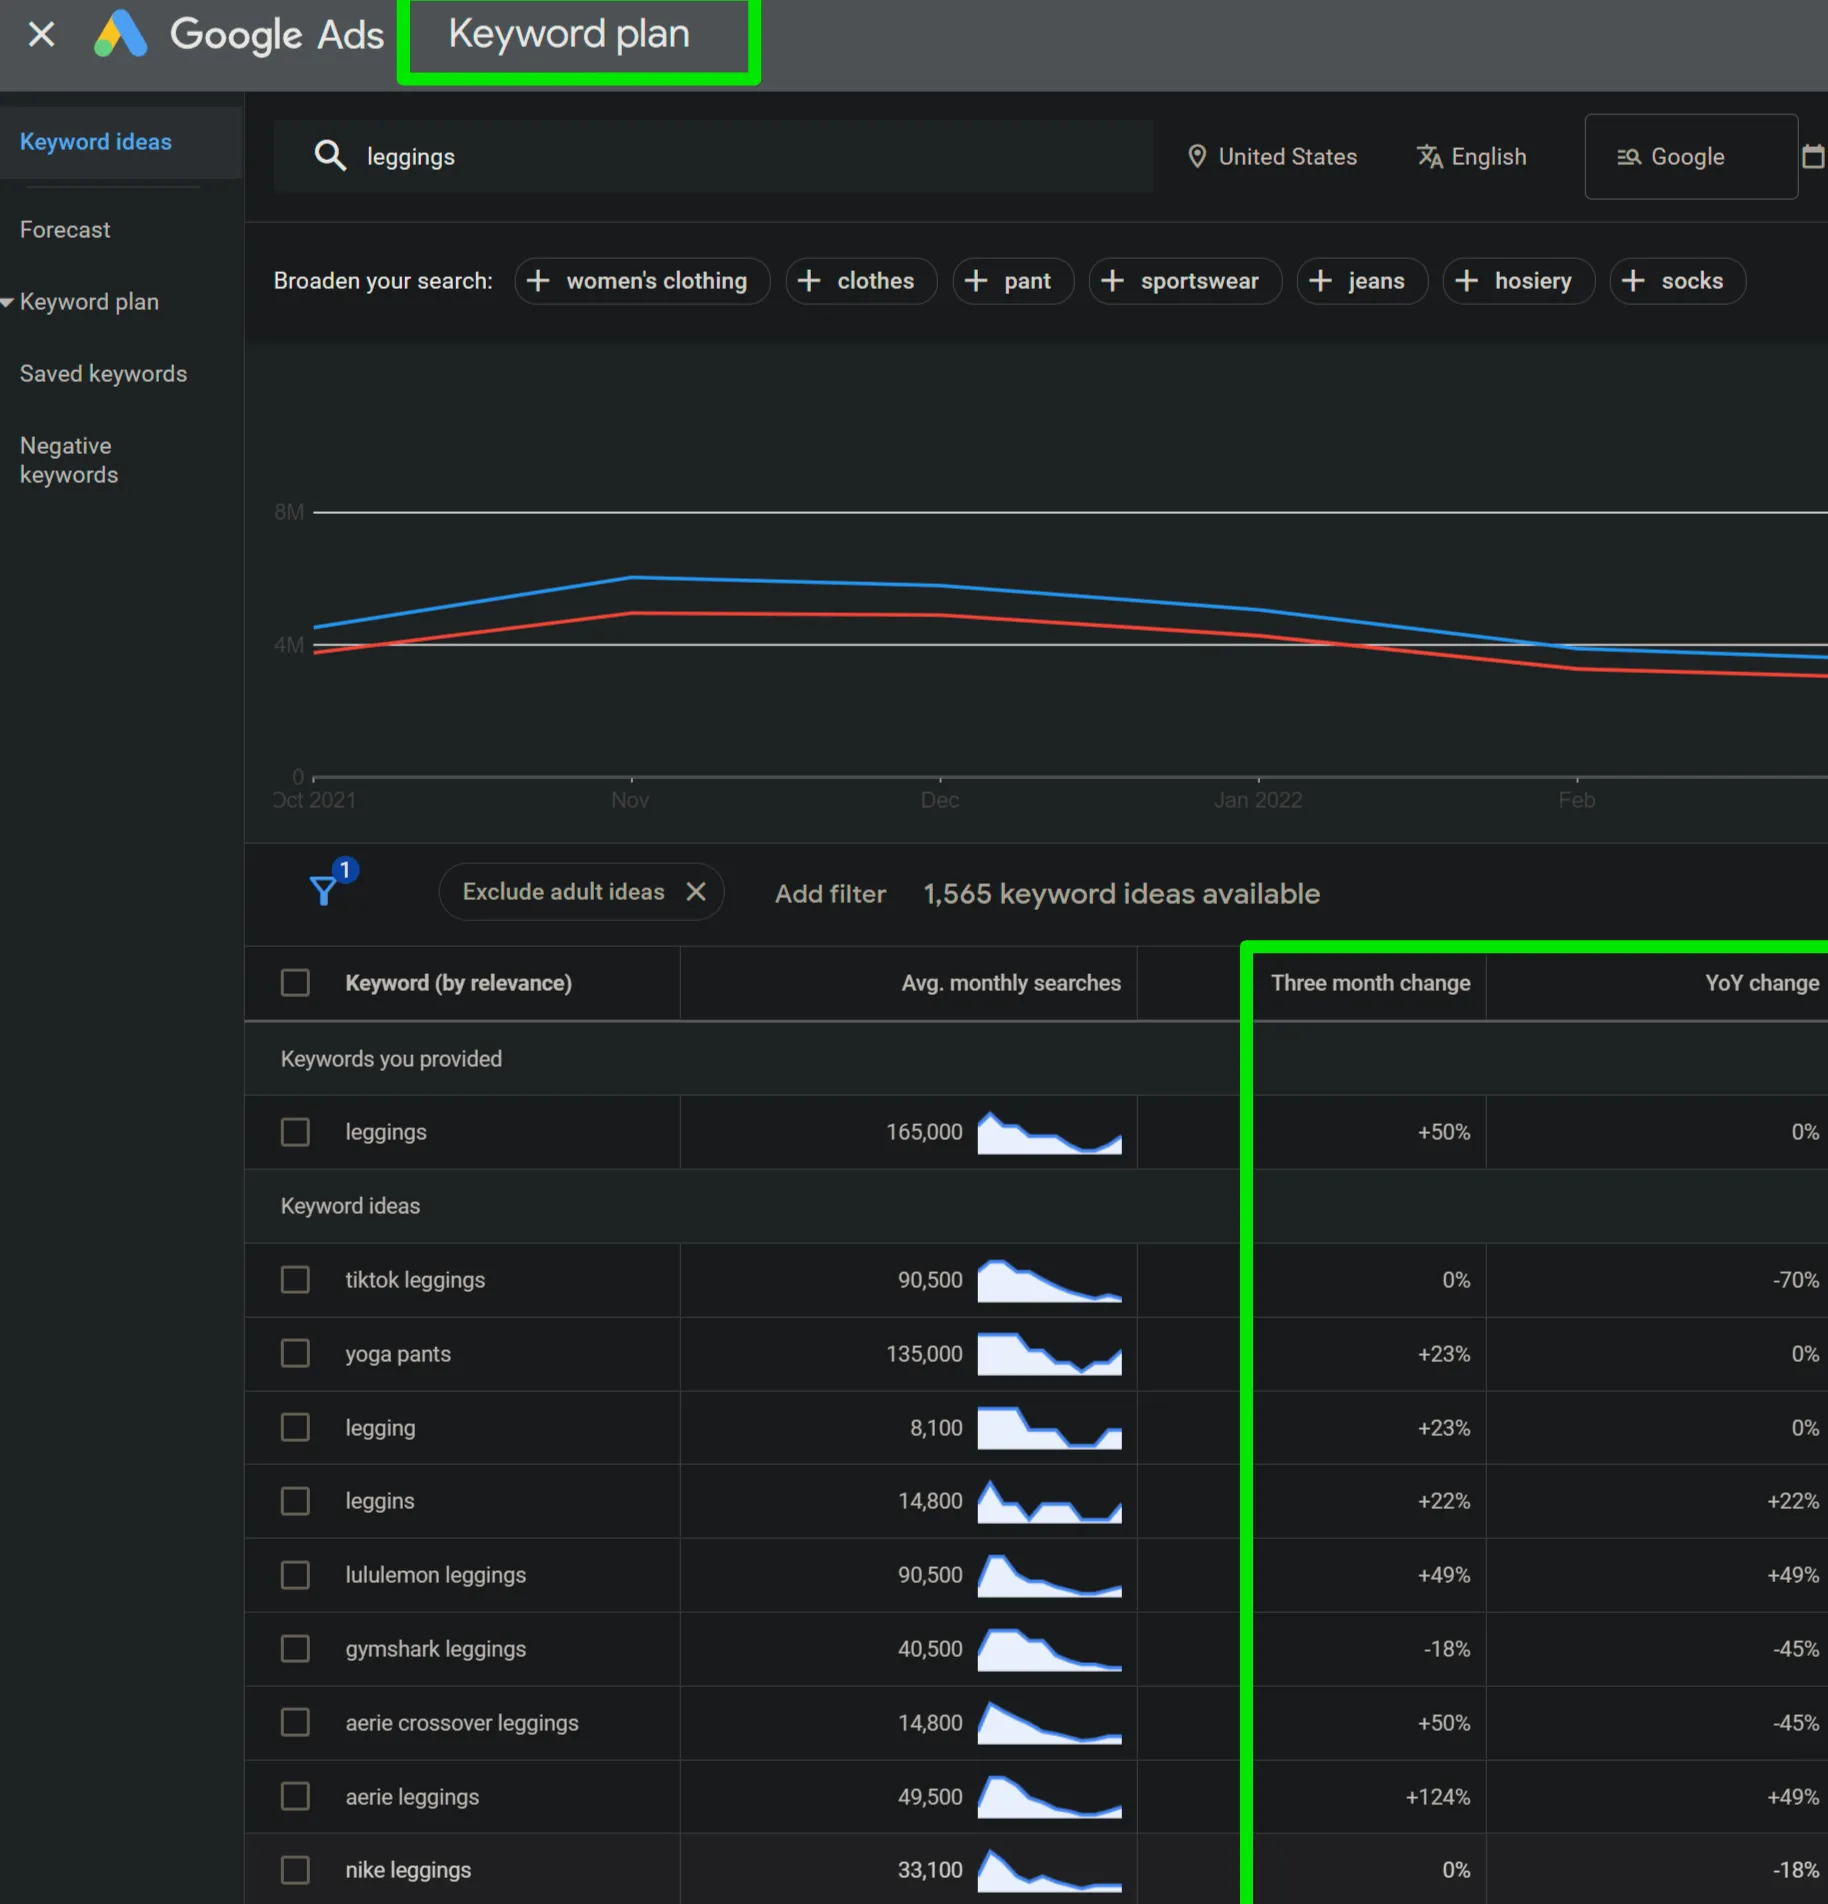
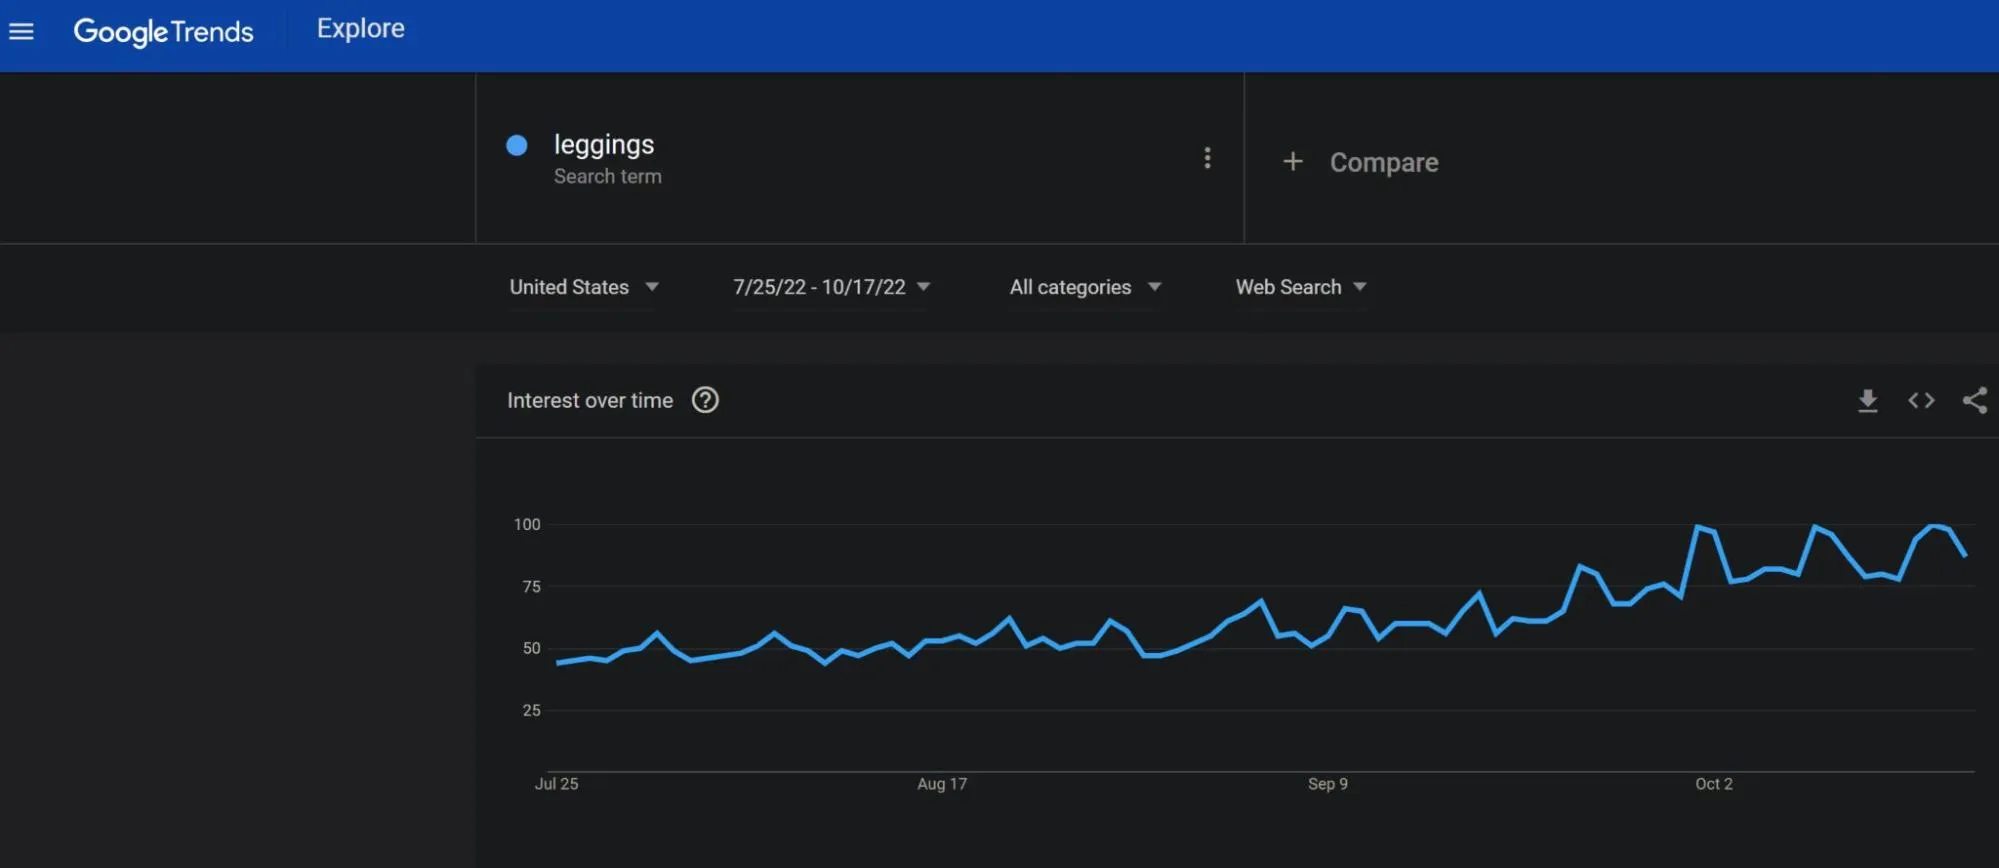
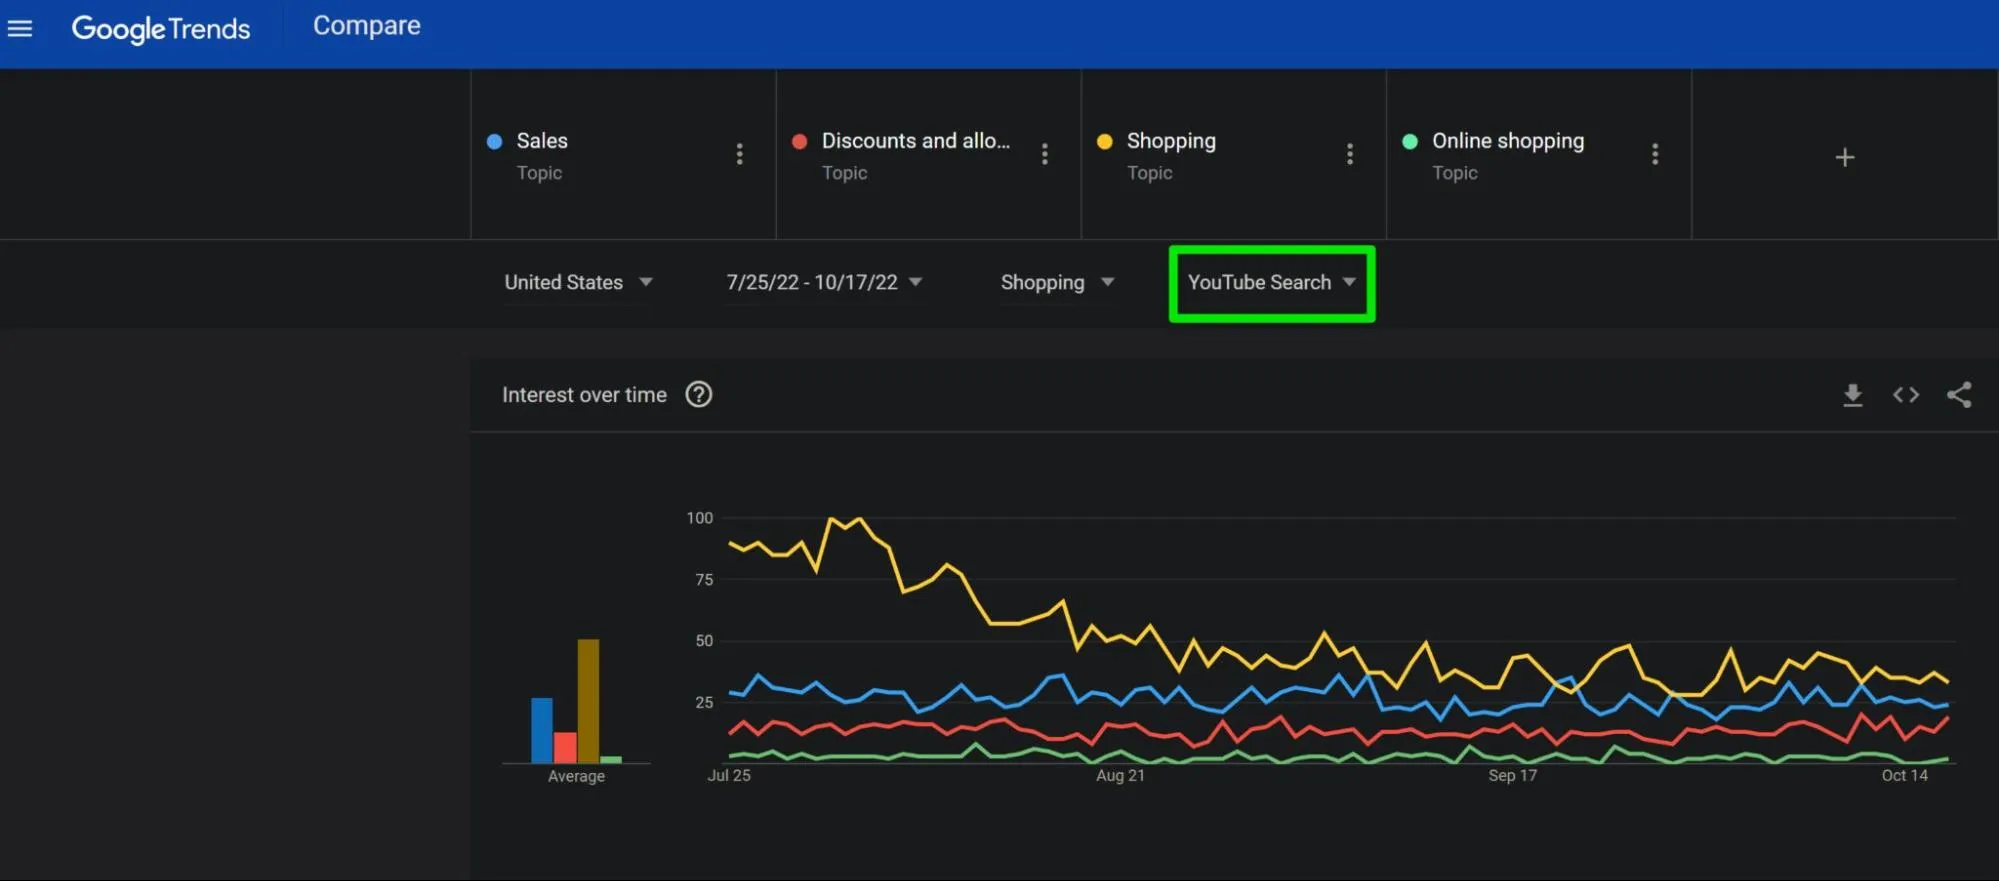
Similarly, check Google’s built-in Keyword Planner tool and Google Trends for any outliers in interest over time for high search volume or high conversion volume search terms.
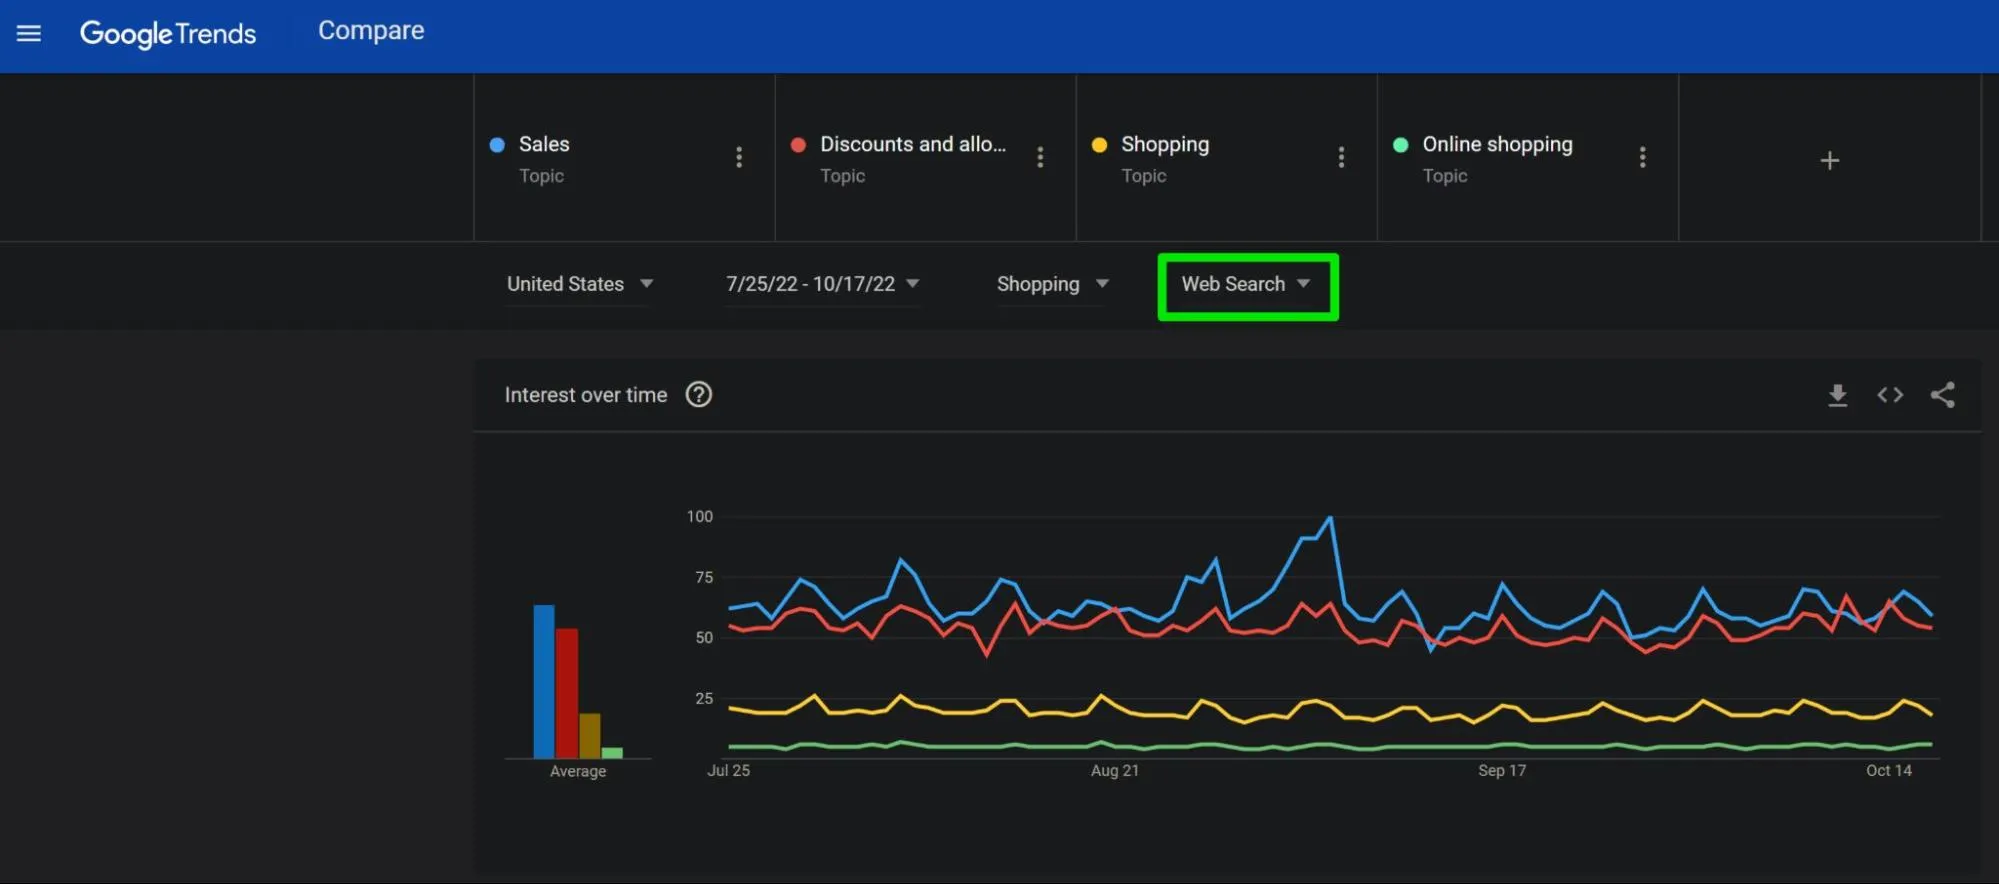
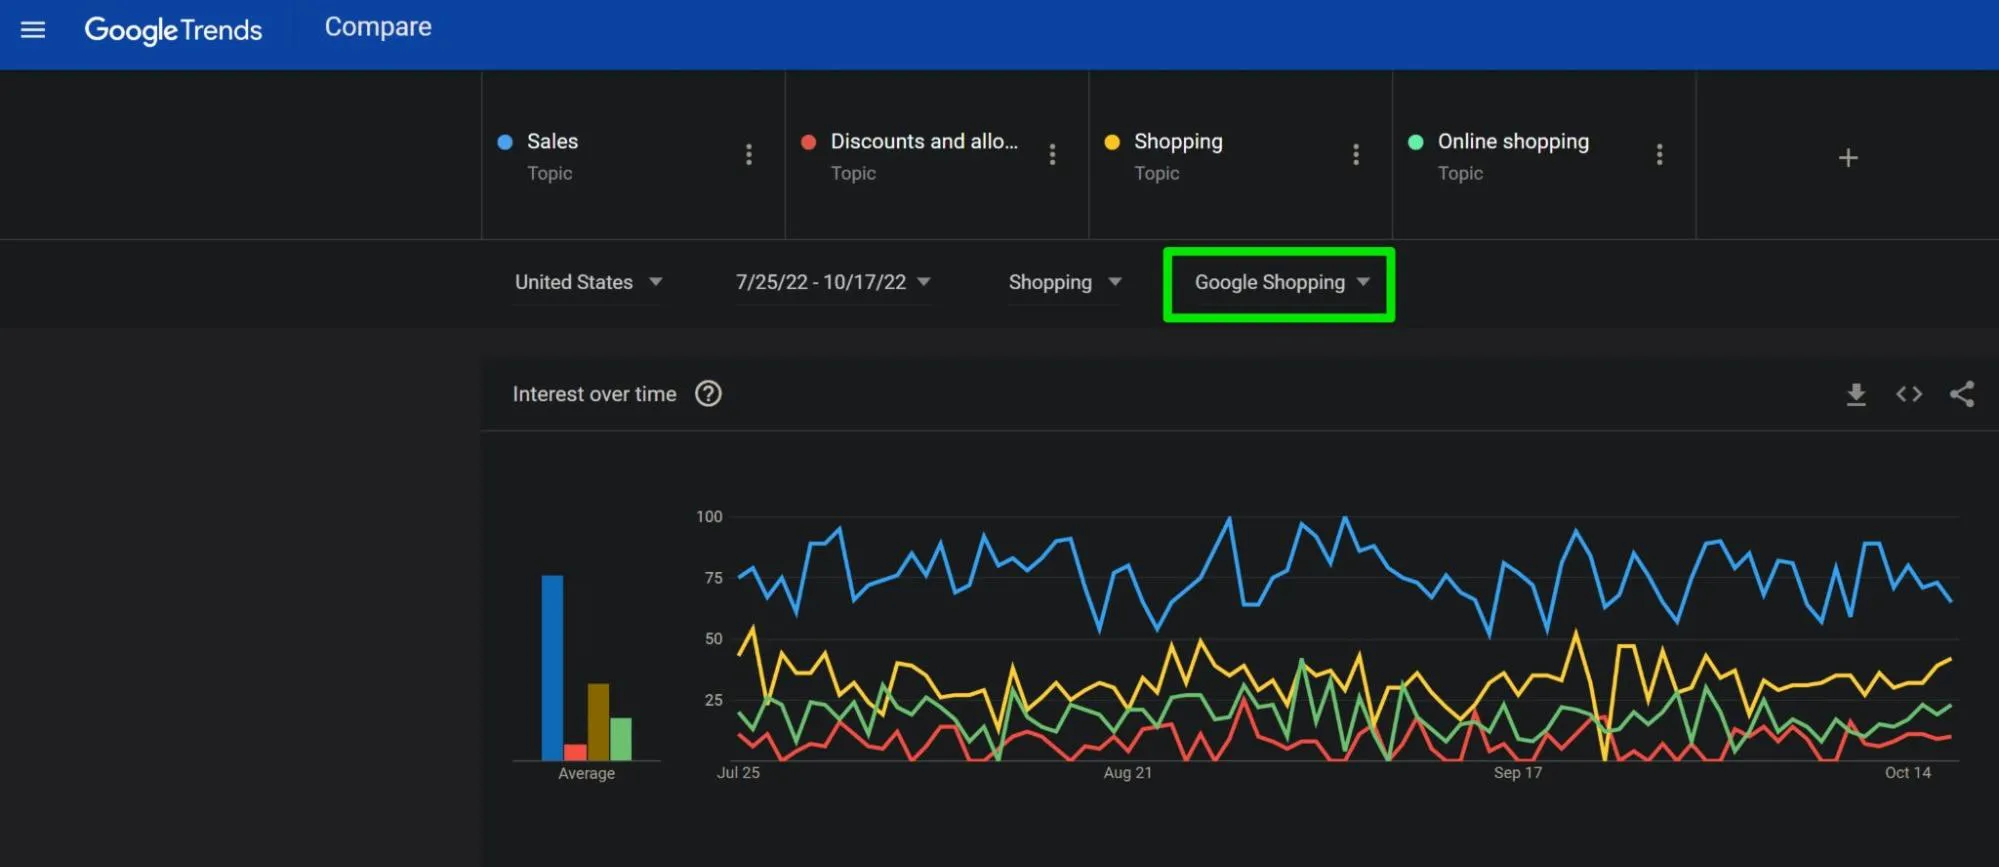
When using Google Trends, try different search terms, topics, categories (e.g. Web search, Shopping, YouTube), and date ranges to uncover potential insights into changes in search behavior.
Have people recently changed or started to change the way they’re searching for the products you offer? Are there new major competitors who’ve recently entered the market?
Is there seasonality at play or global dynamics that may be affecting the buying behavior of your products or consumer spending in general that is apparent through this analysis?
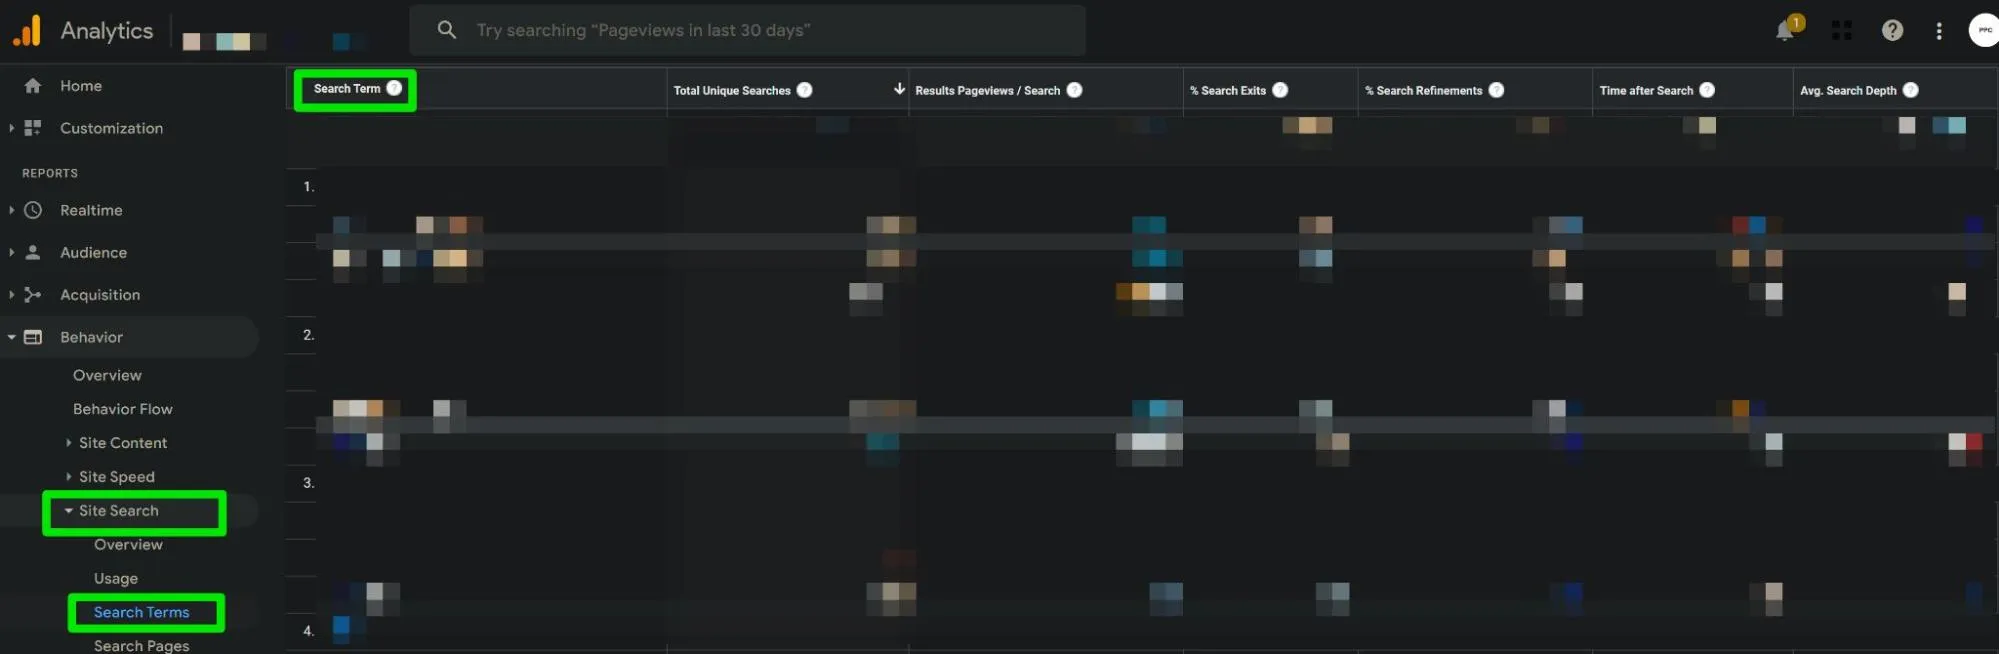
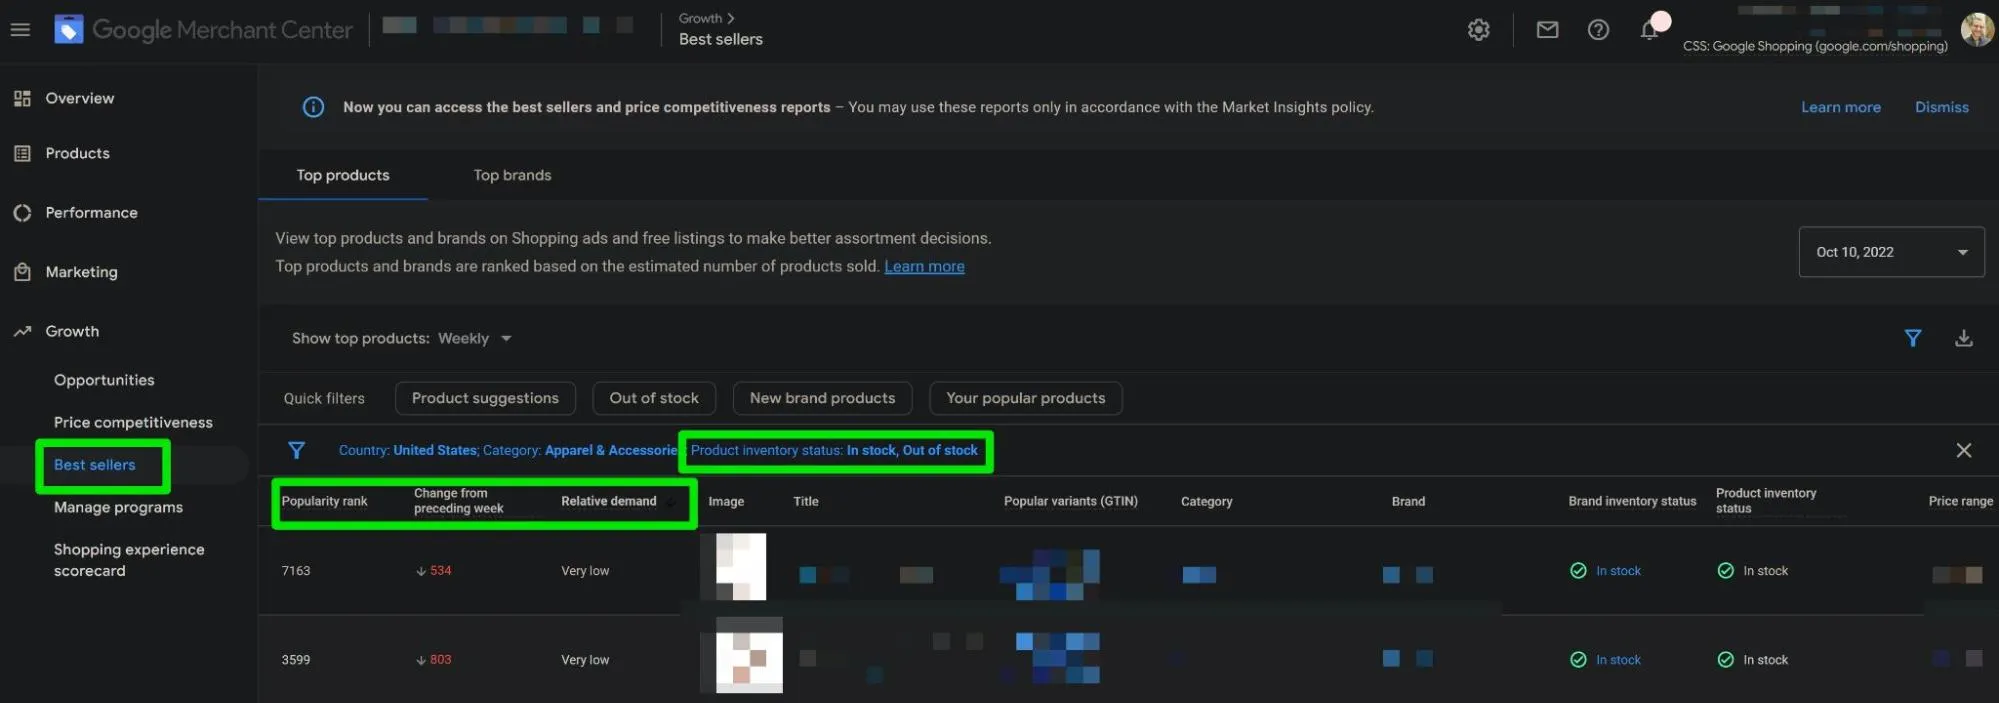
Other areas to check, depending on if these features are available to you, are the Site Search > Search Terms section of your Google Analytics account and the Best Sellers section of your Google Merchant Center account.
Are there any outliers in how people use the search feature on your site? If applicable, are you seeing similar changes in search behavior in your Microsoft Ads account? Have any of your top selling products changed in popularity rank recently?
Note that the popularity rank is the popularity of the item on Shopping ads and free listings, in the selected category and country, based on the estimated number of units sold.
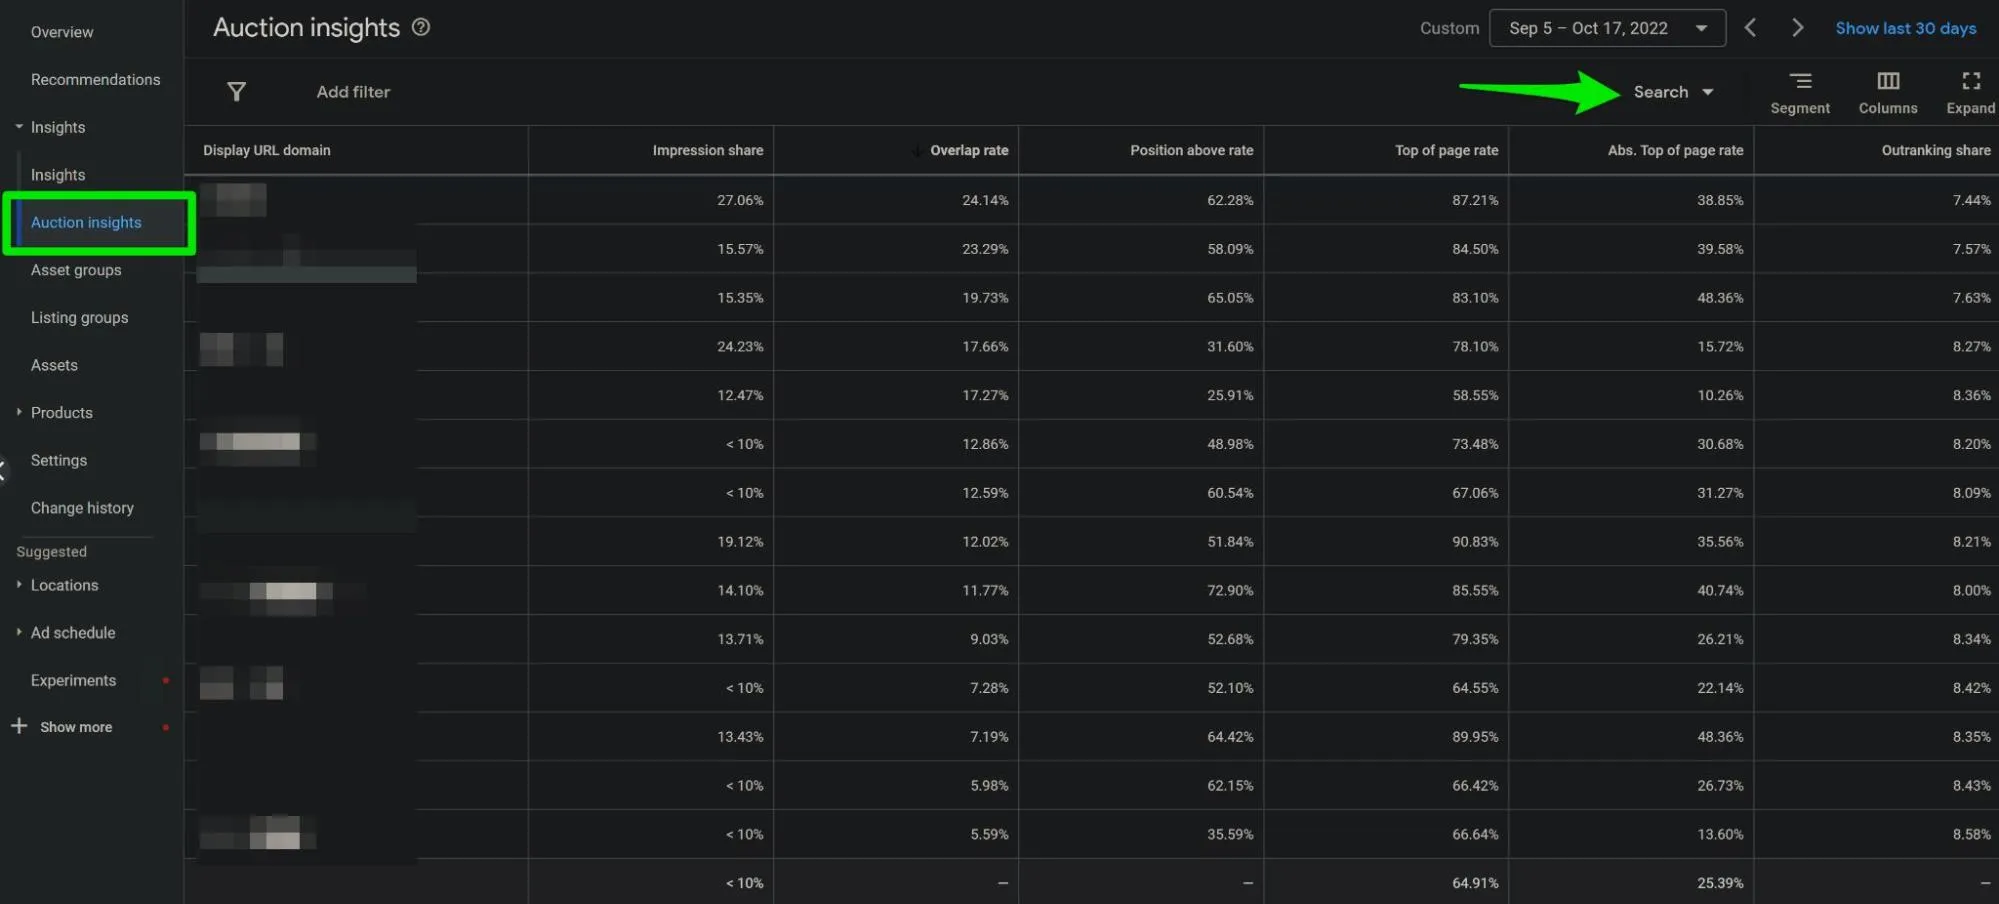
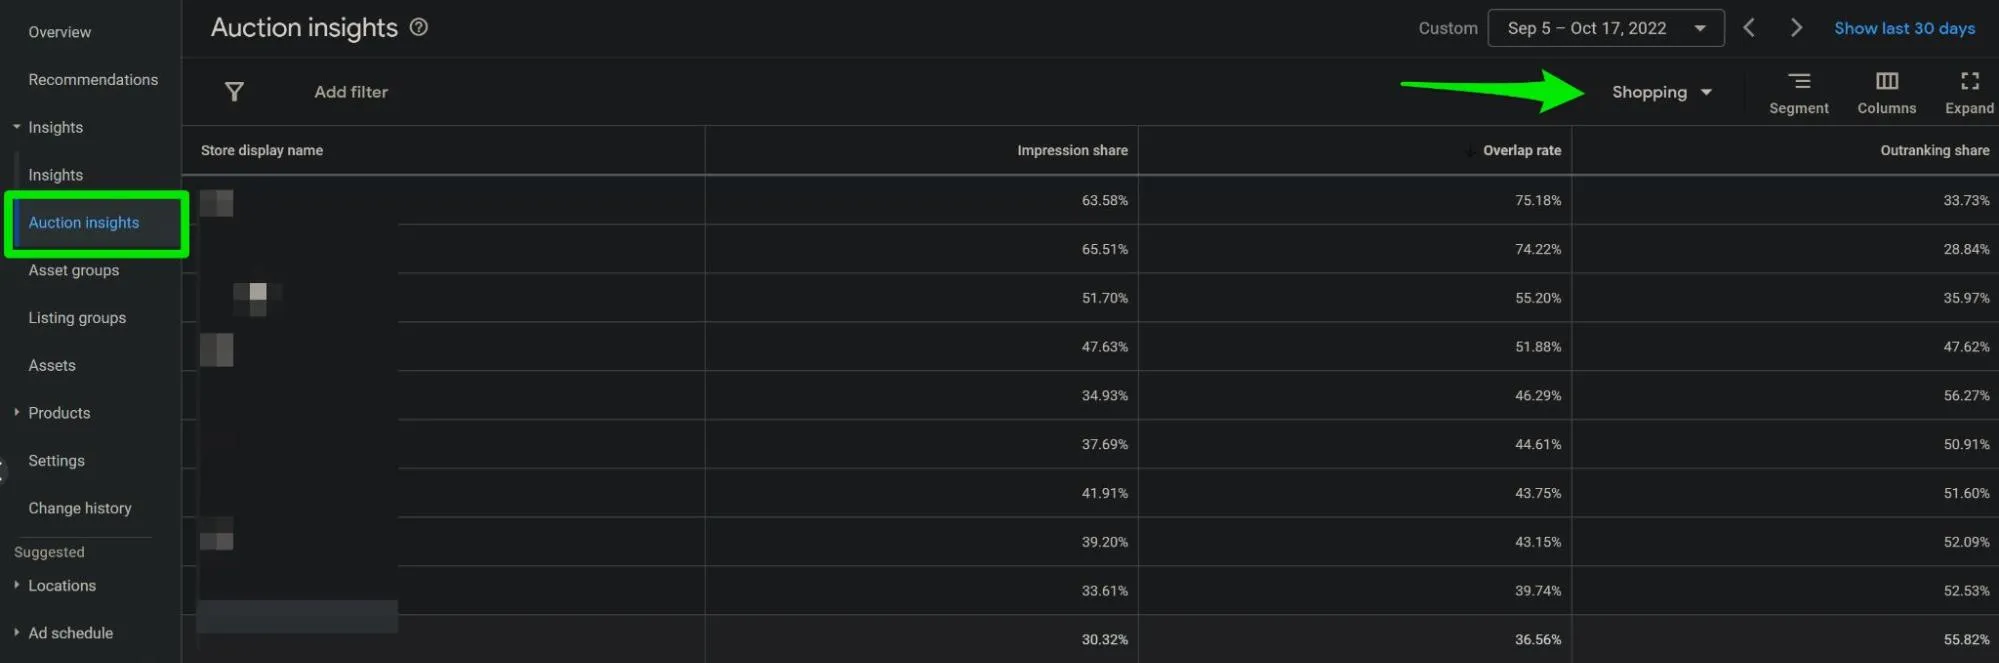
Have your competitors started getting more or less aggressive in their bidding? Check the Auction Insights section of your PMax campaign to investigate. Don’t forget to check both the Search and Shopping filter of this section.
Other Marketing
Google Ads doesn’t work in a vacuum. Have you recently pulled spend away or dramatically increased spend or marketing efforts towards another marketing channel that may have caused a ripple effect to Google Ads performance?
Common examples include changes to social media marketing, email or SMS marketing, affiliate and referral marketing, or third-party remarketing channels.
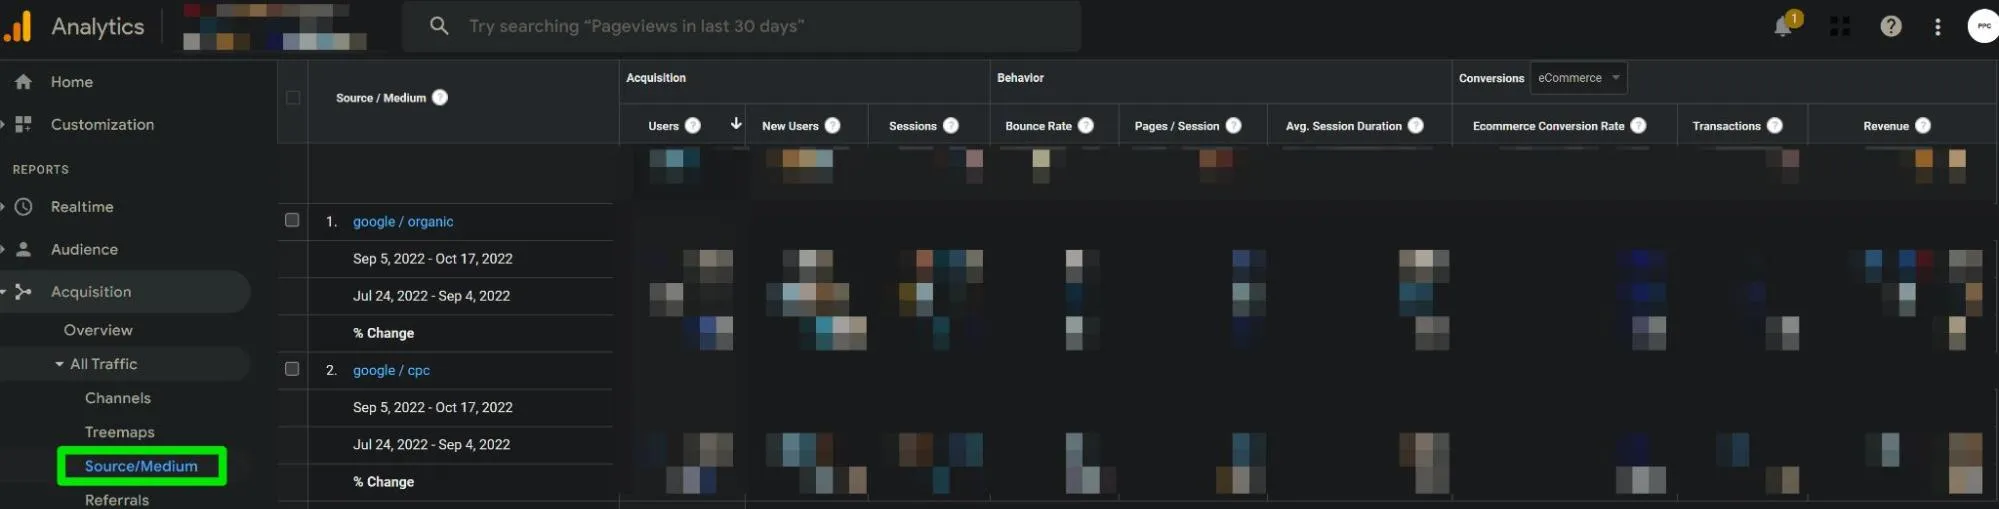
Check for metric fluctuation outliers in your Google Analytics Source/Medium report or your third-party attribution software, if you have one, for more detailed performance insights.
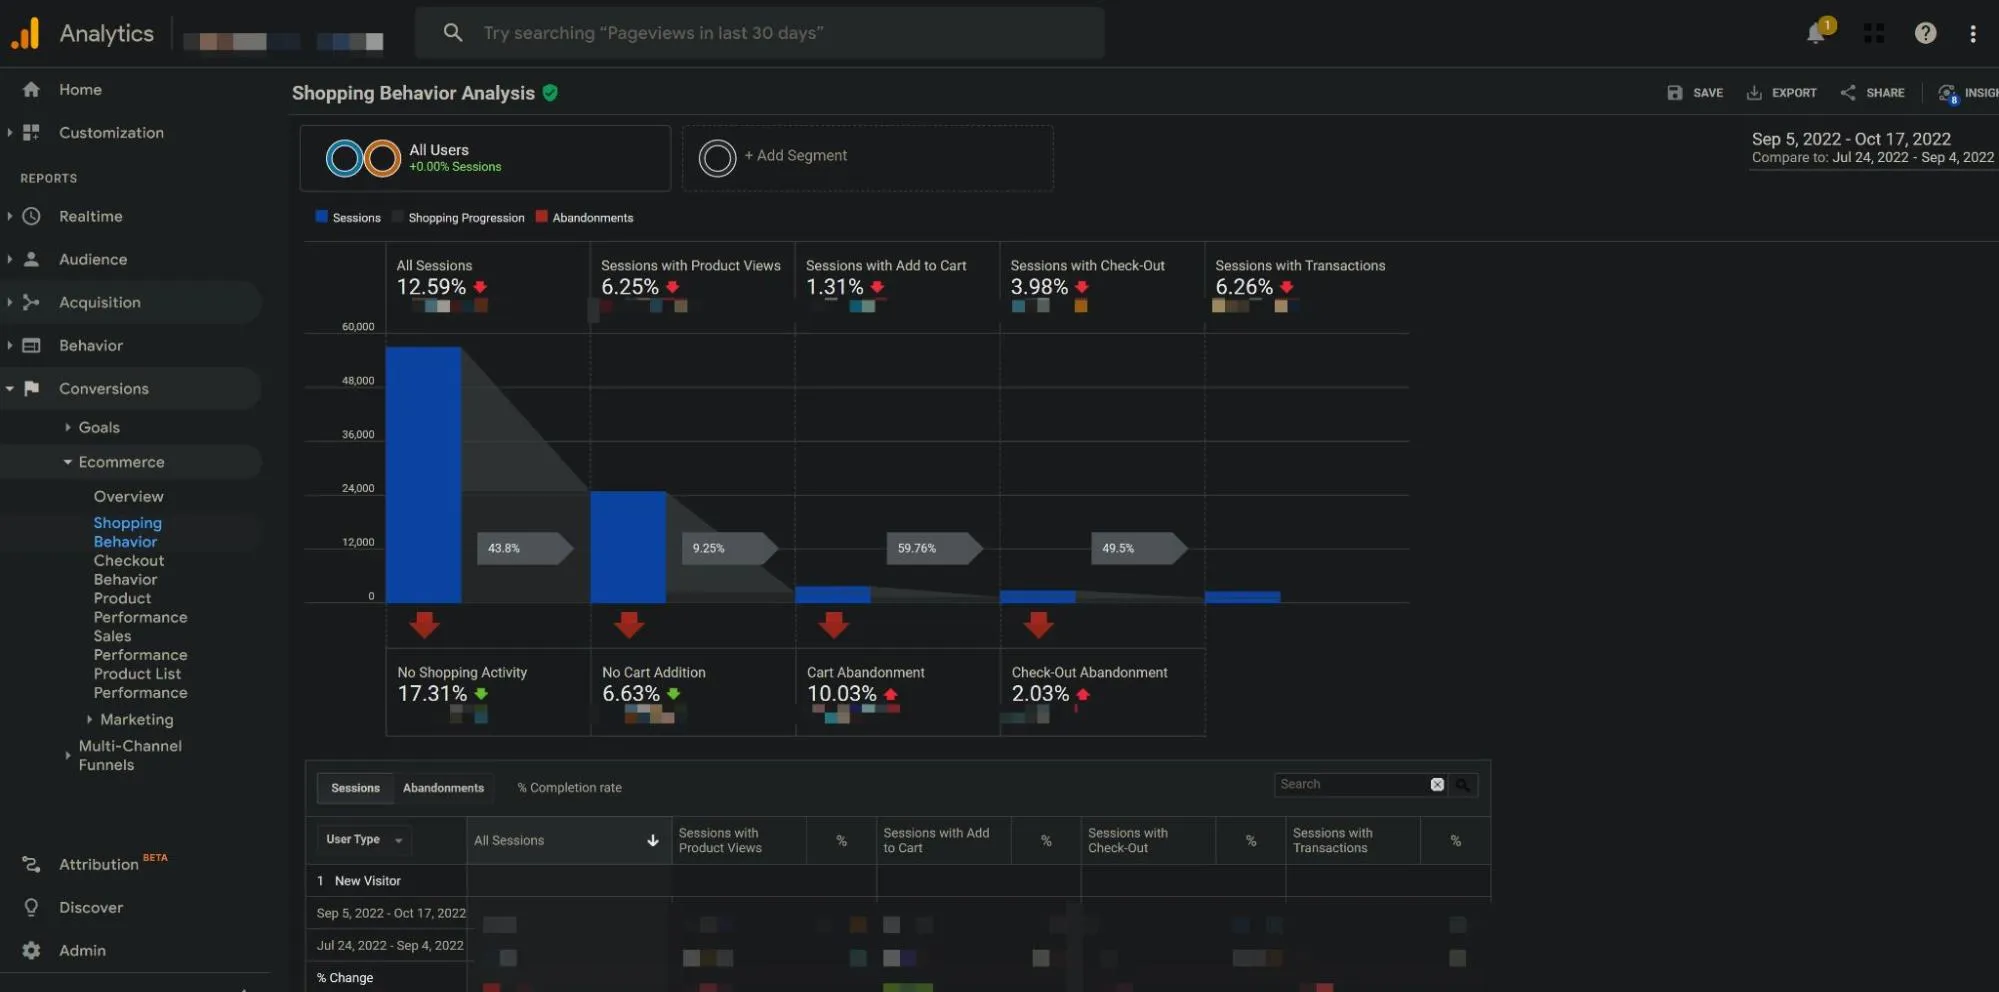
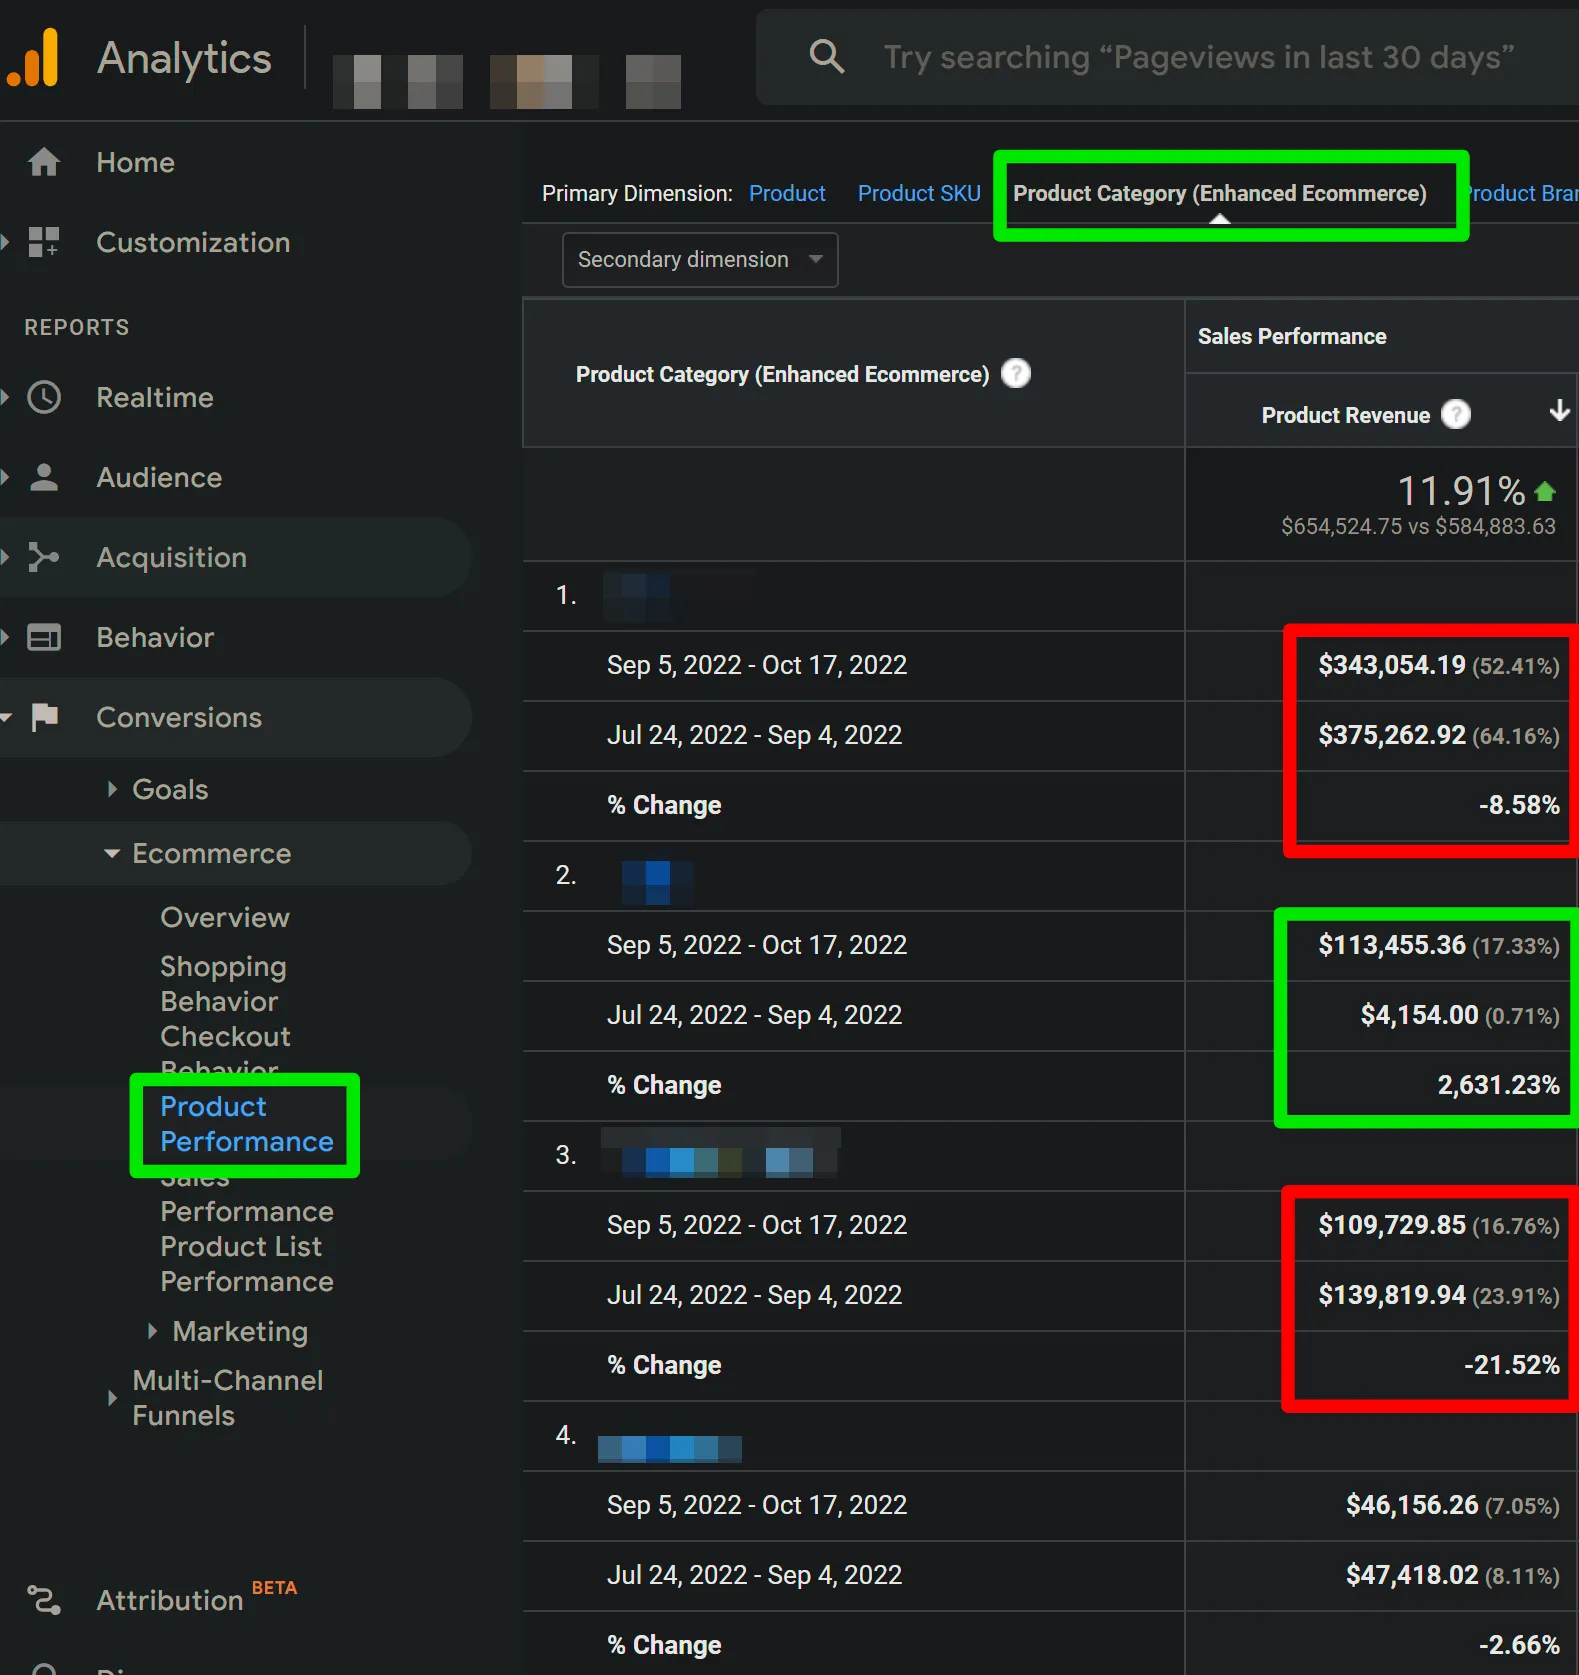
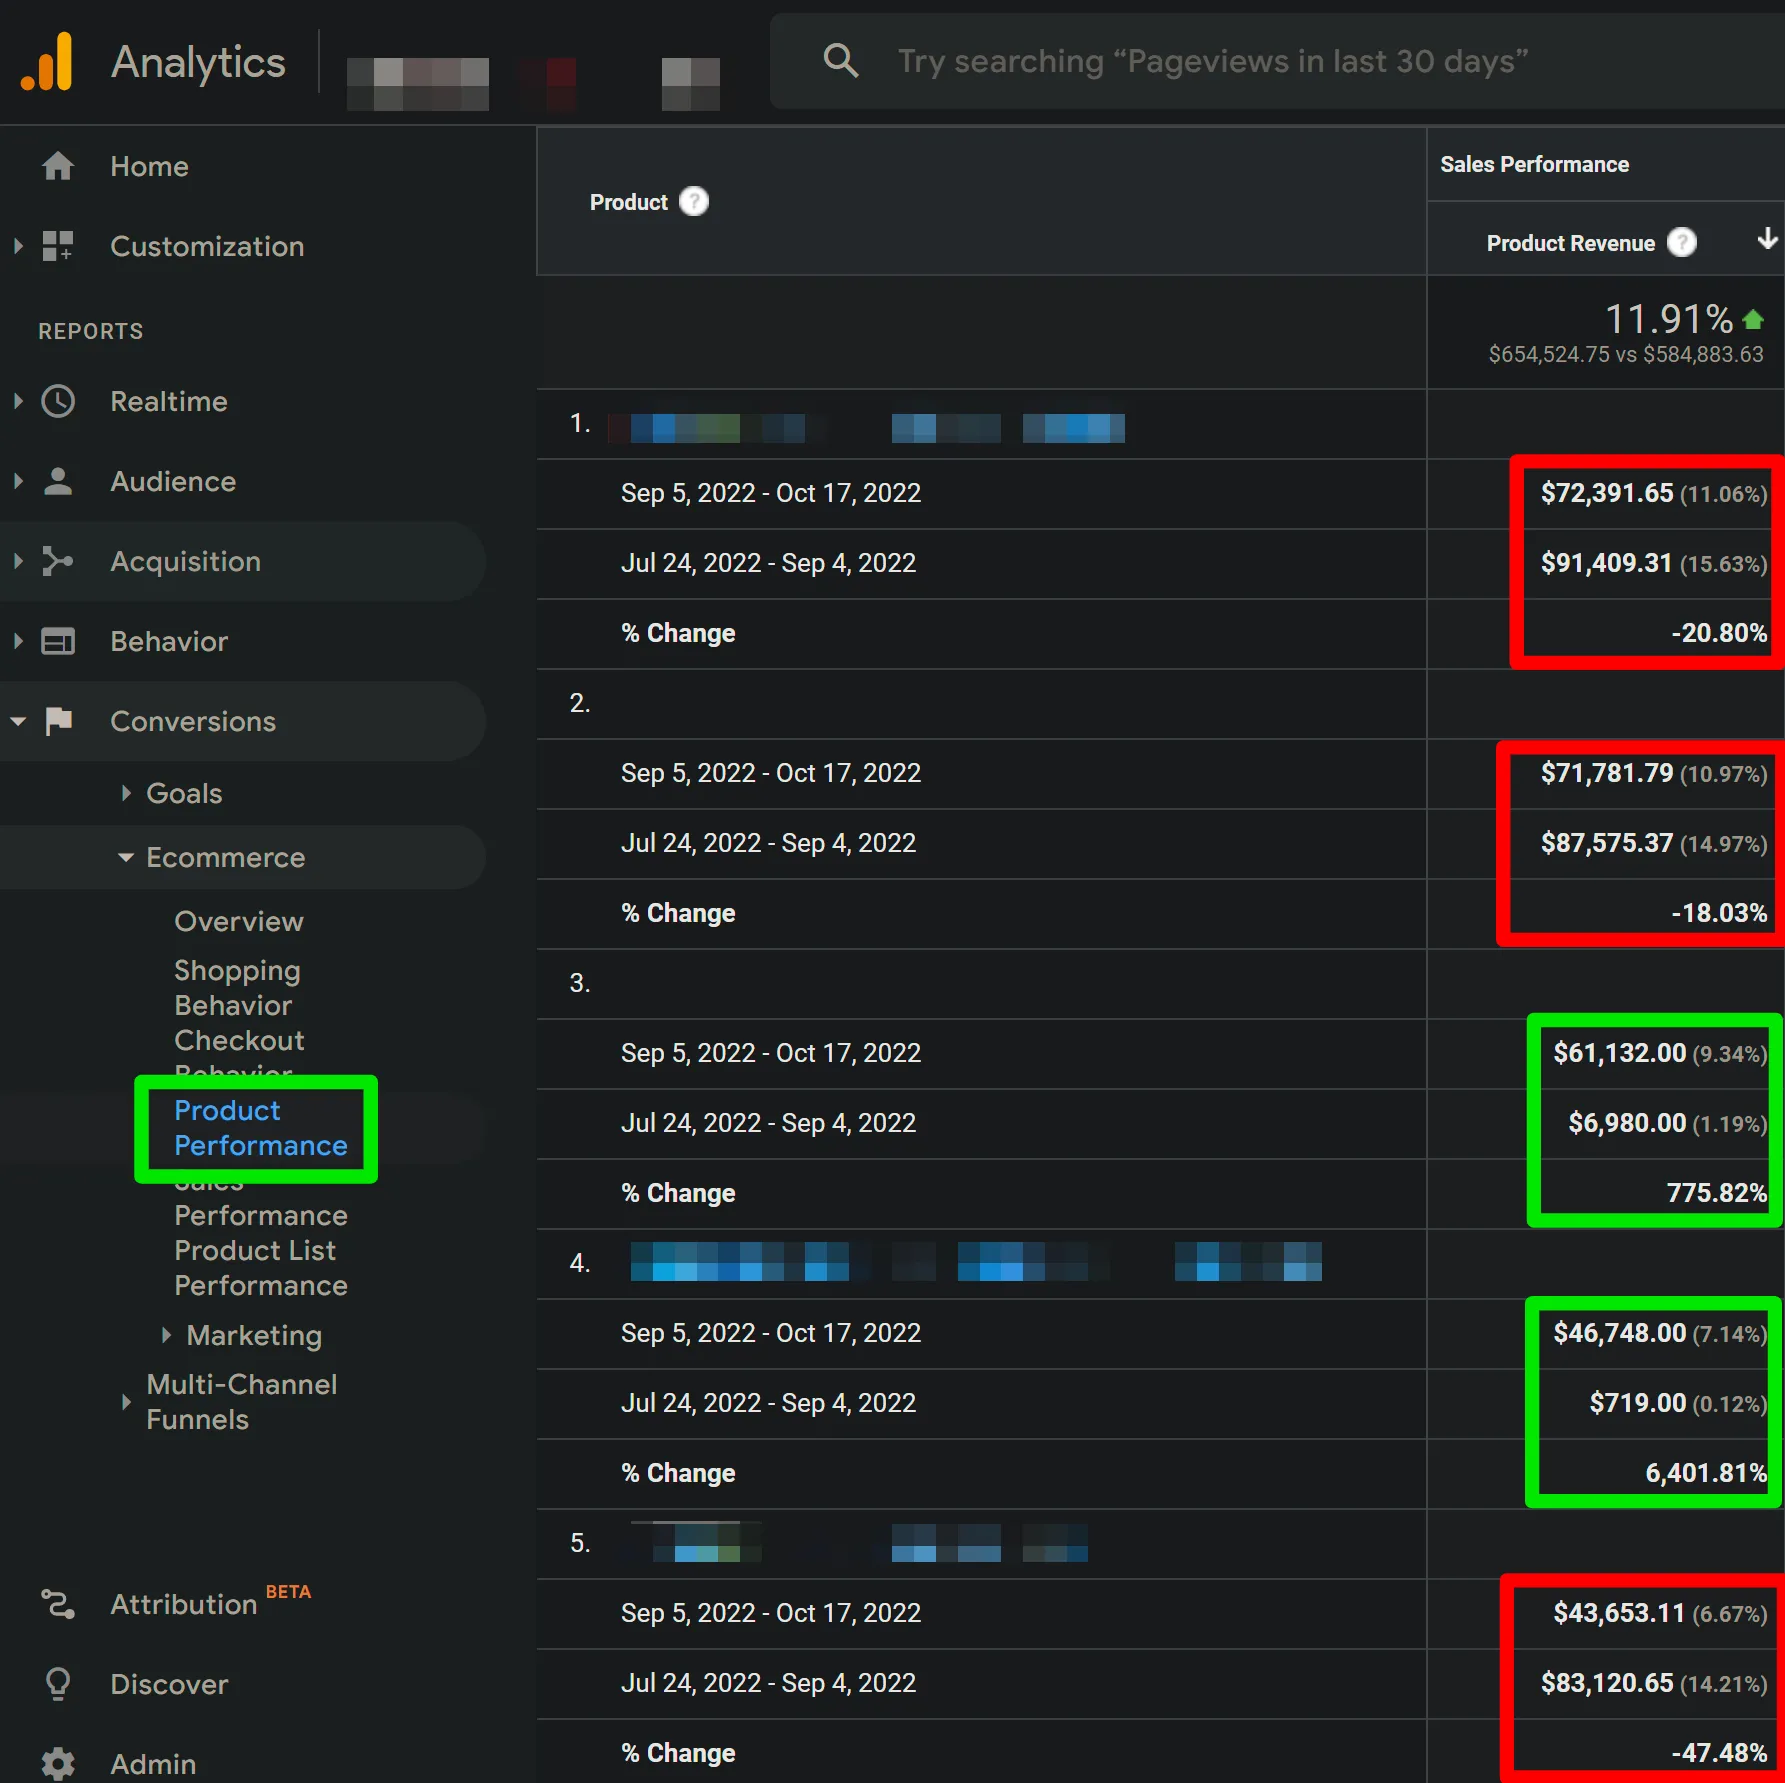
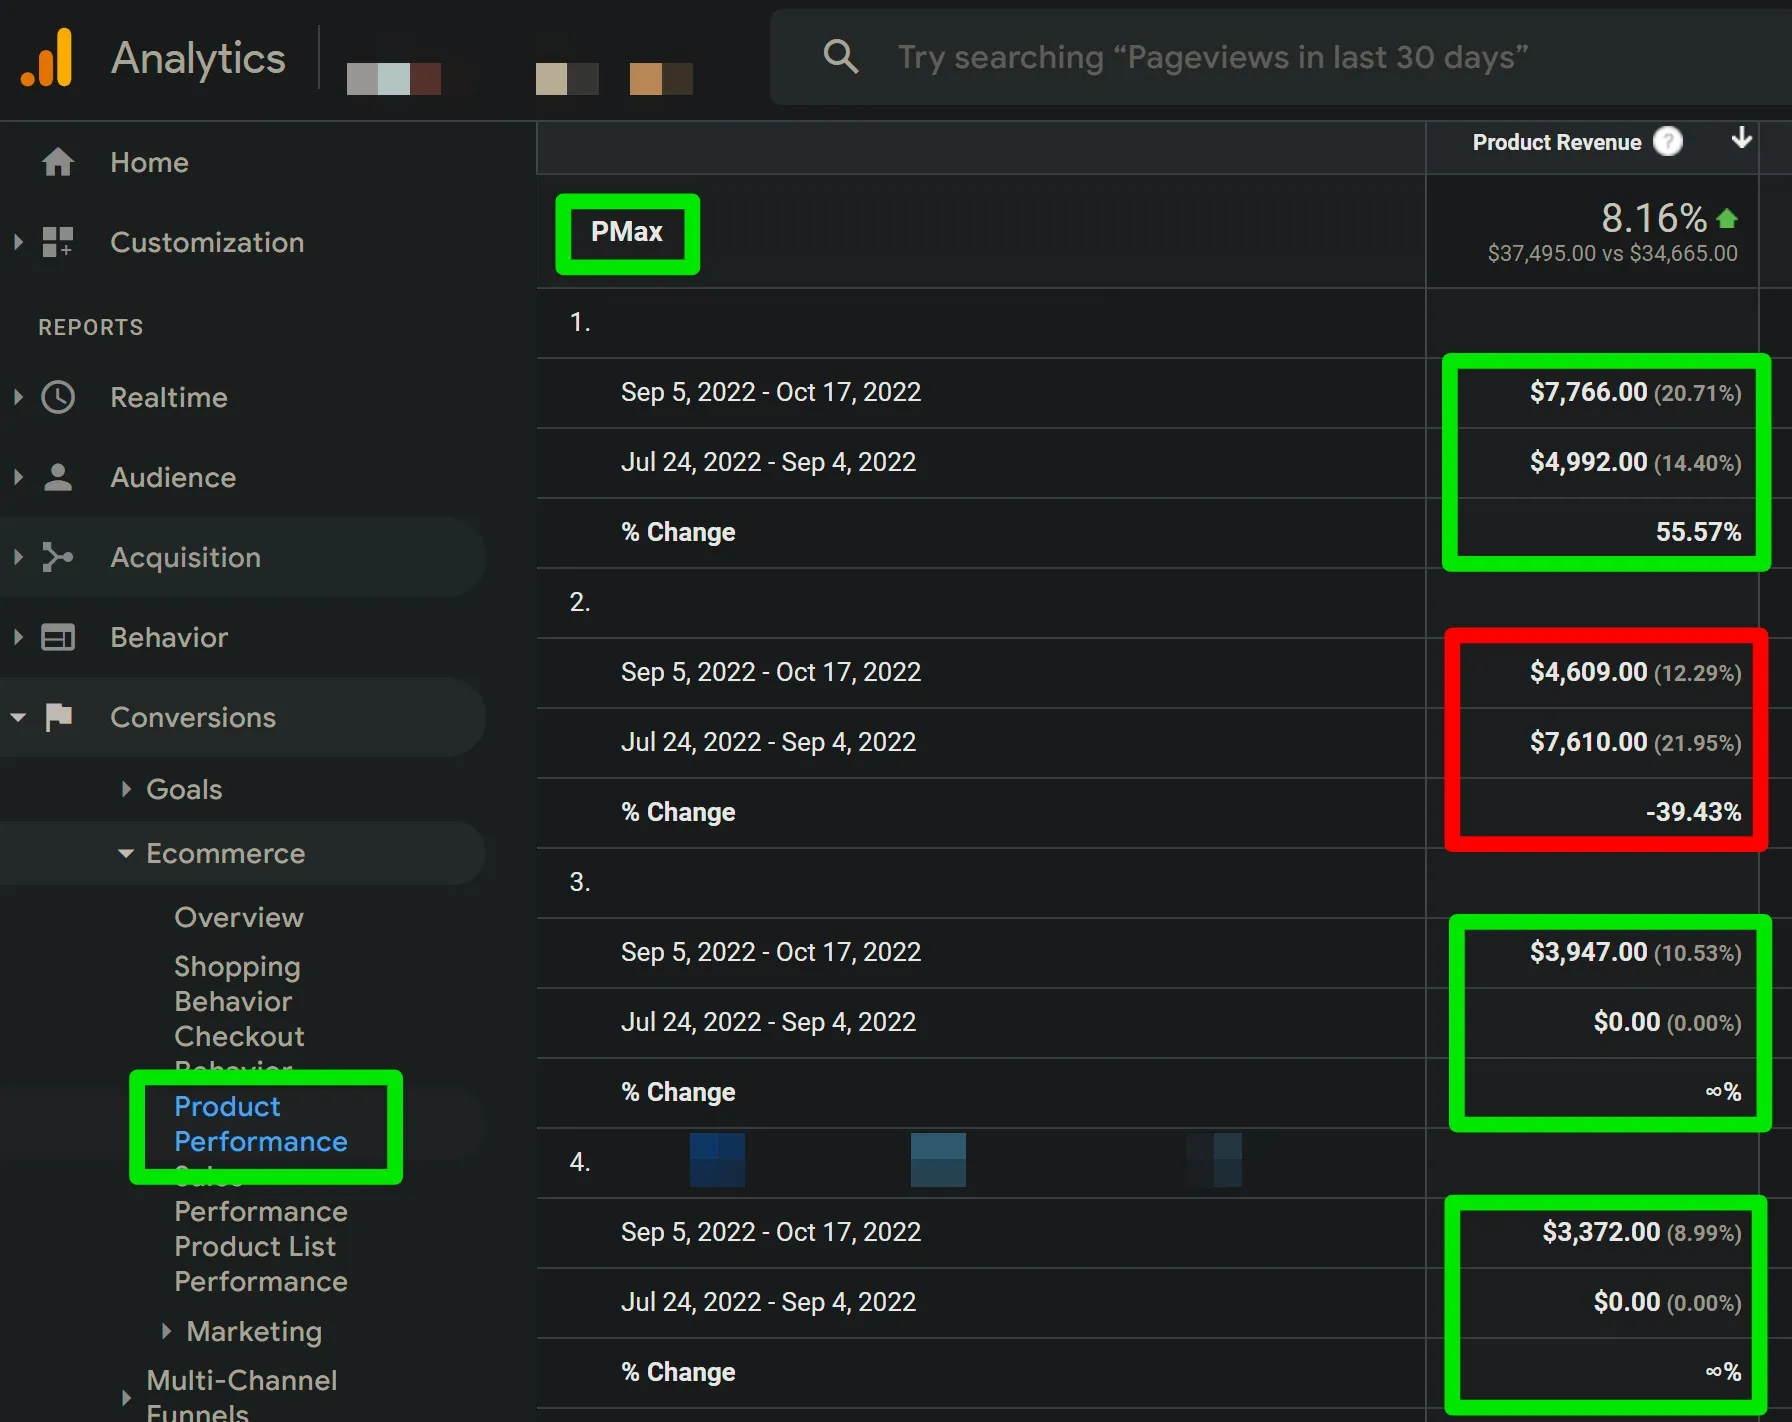
Don’t forget to analyze the Shopping Behavior and Product Performance section of your Google Analytics account as well to locate any performance fluctuation outliers.
Non-PMax Campaigns
Have you added, paused, or made any major changes to any other non-PMax campaigns in the account?
Performance Max campaigns tend to be sensitive to and affected by relatively major changes to other active Google Ads campaigns, such as, but not limited to, Display, YouTube, Discovery, and Search campaigns using Dynamic Search Ads.
Diving Deeper (PMax Specific): Performance Fluctuations Directly Correlated To Performance Max Campaigns
Now that we’ve investigated the usual suspects found outside of PMax, let’s dive deeper into the PMax campaign in question to see if there are more causation insights we can uncover.
Google Bidding & Targeting Algorithm Shifts
Has Google started showing your ads more or less on the Shopping ads network? Build a custom report to find out using the “MC ID” dimension. This is the ID of the Google Merchant Center account associated with the products being advertised.
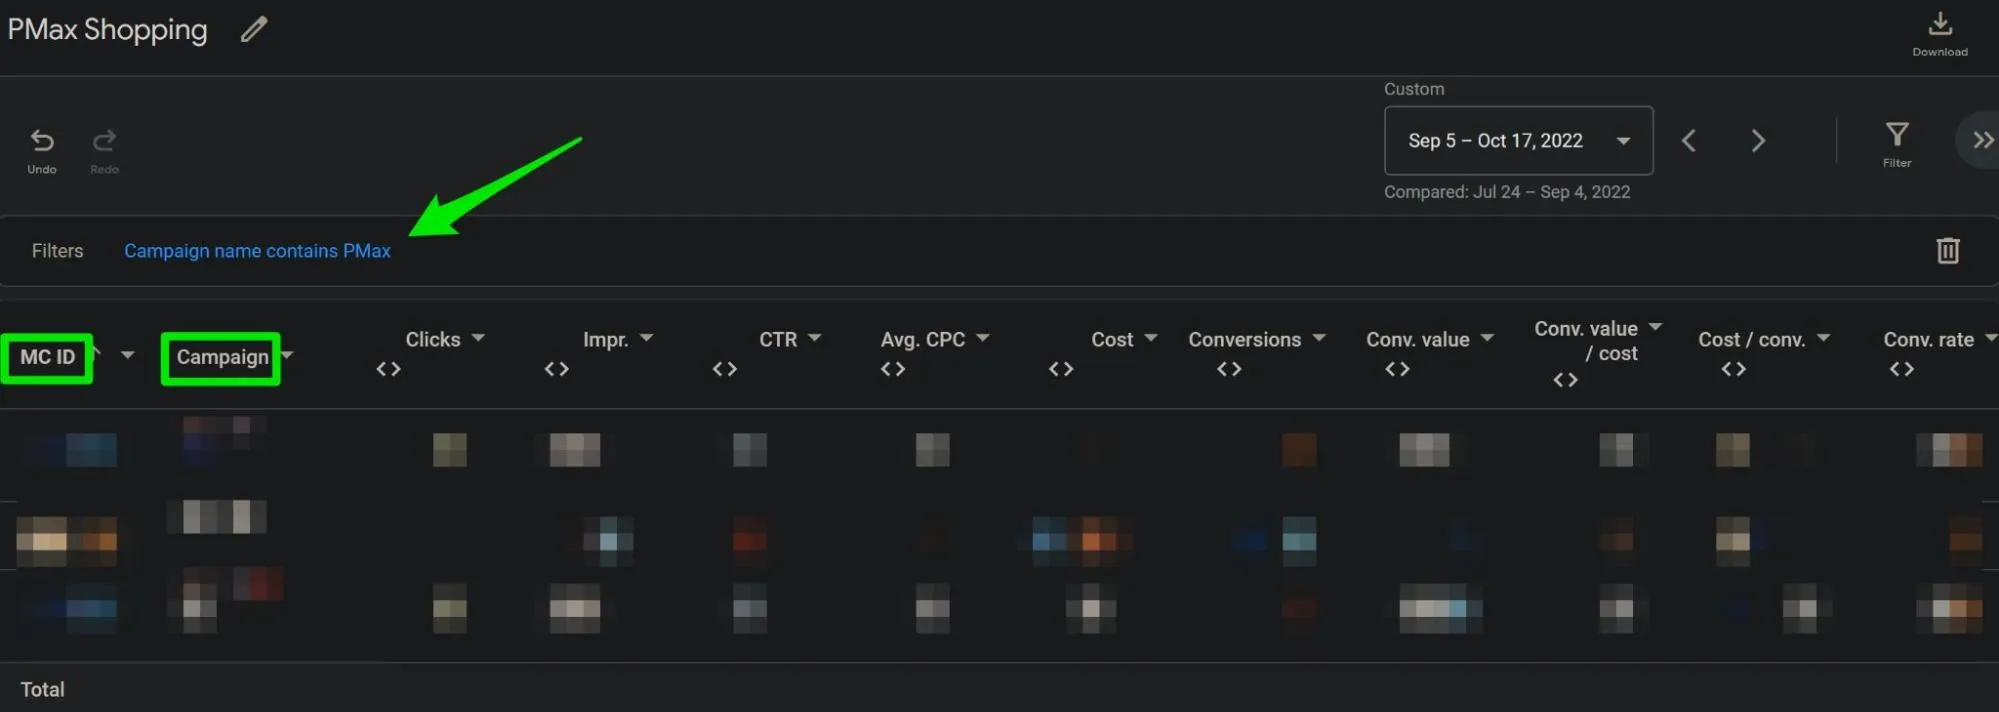
Note: Expect impression metrics in campaign data tables in the Campaigns section of your account to be lower than the number of impressions shown for an associated MC-ID.
Per Google: “When an ad shows many products in an individual ad slot, each product collects an impression. However, the campaign, Asset Group, and ad recognize that only a single ad was showing and will count it as one impression.”
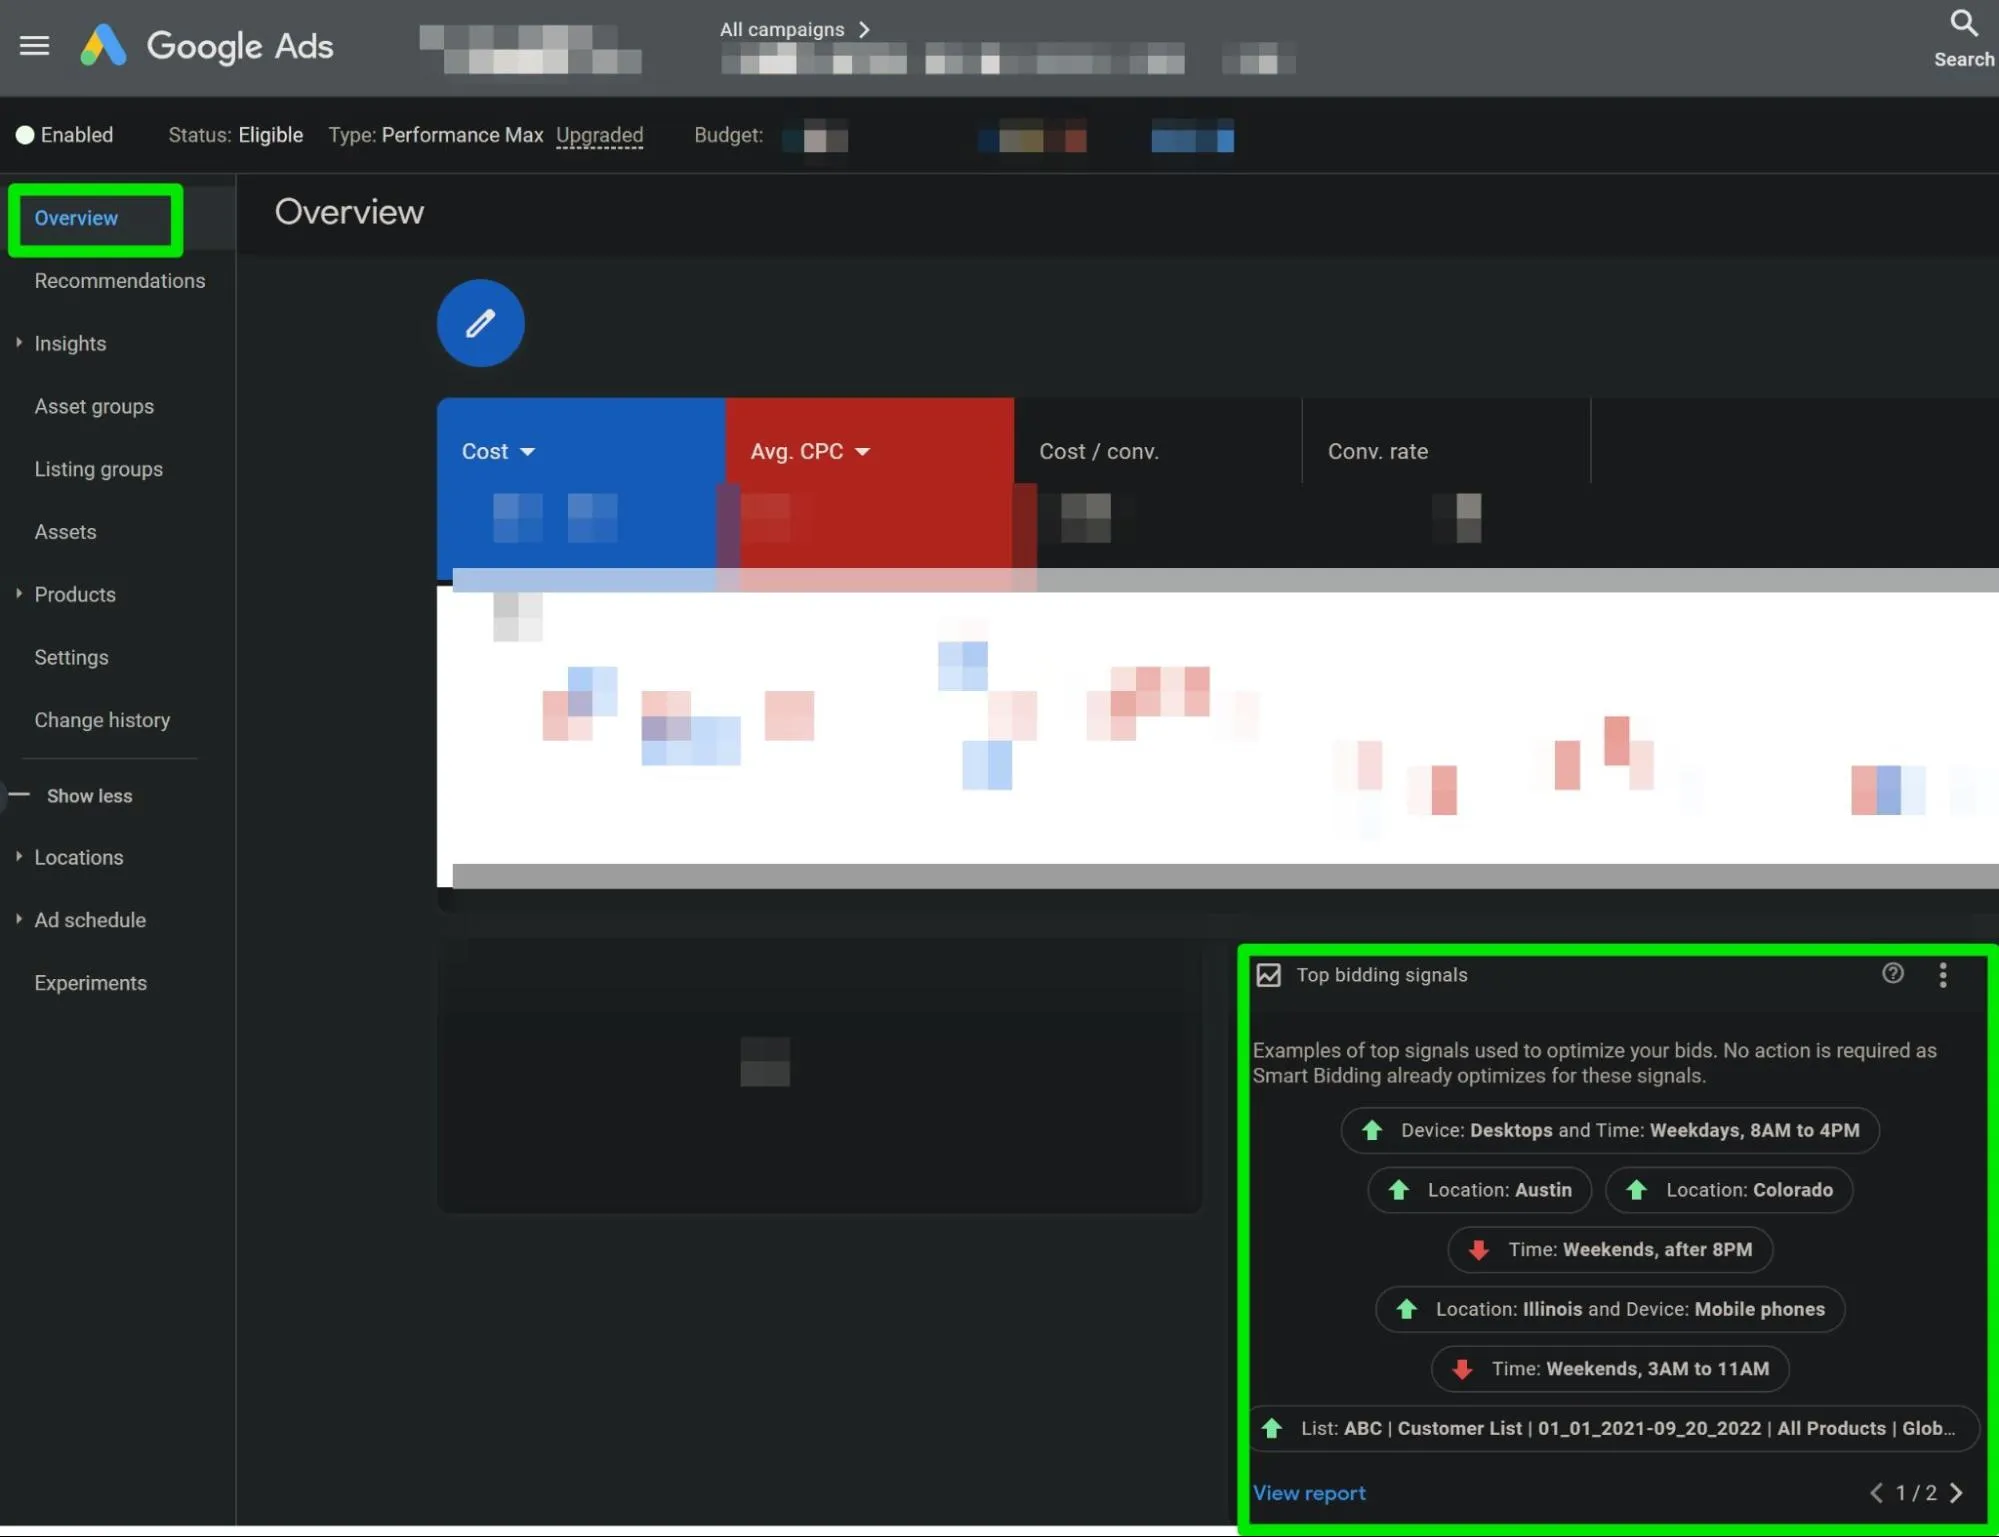
Get a glimpse of recent optimizations made by Google’s automated bidding strategy by reviewing the Top Bidding Signals report in the Overview tab of your campaign.
Investigate the landing pages Google has been sending Performance Max ad clicks to by building a custom report using the Landing Page dimension:
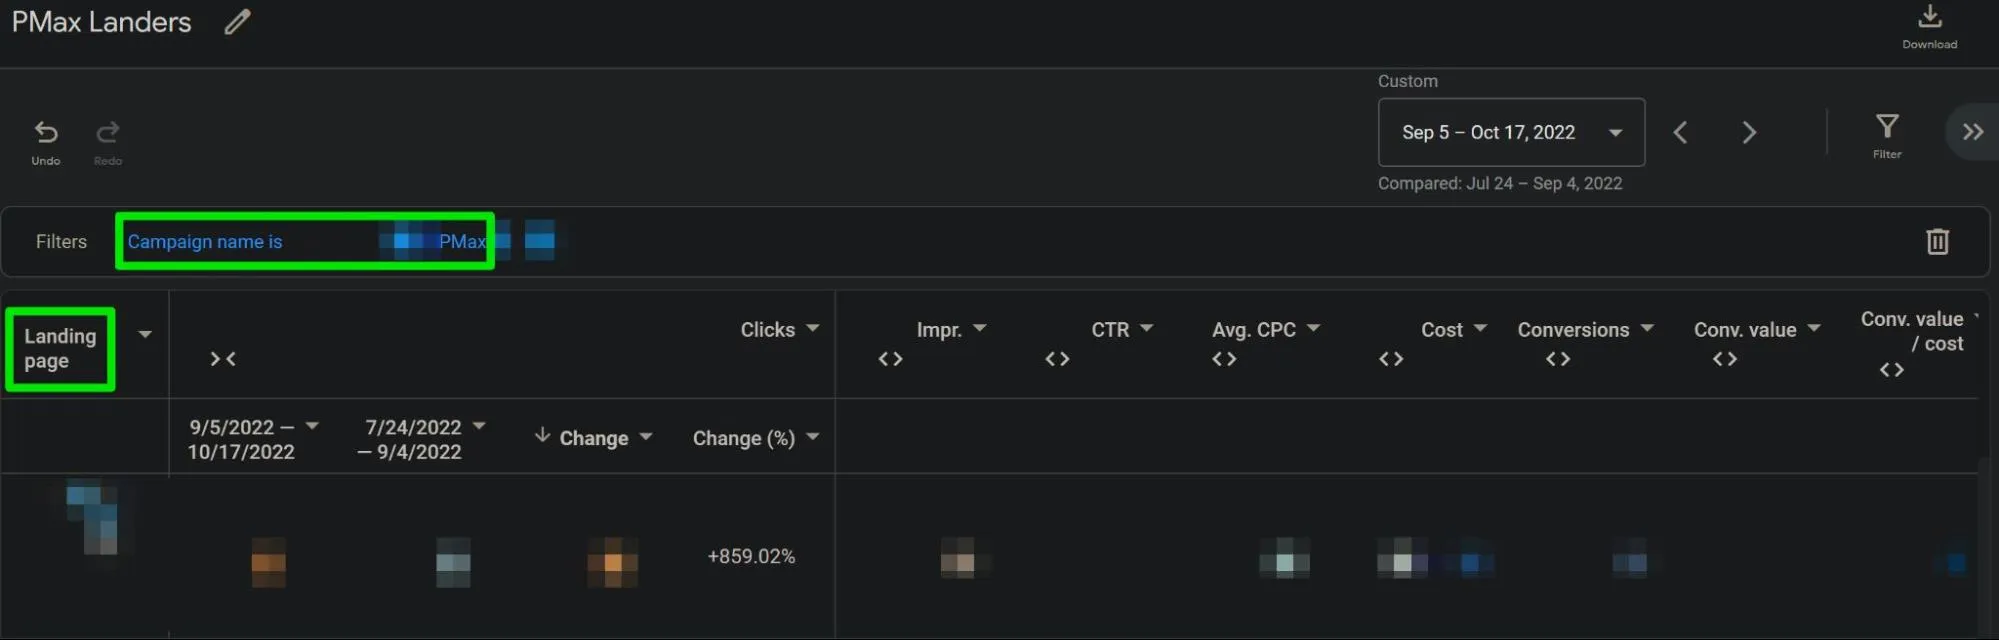
Note: This report is especially important to check if Final URL Expansion is enabled for a given PMax campaign.
Additionally, in many cases, you’ll want to download this data so you can, at a minimum, run the data through pivot tables to find categorical patterns, such as the performance of blog pages vs product pages, different product categories, best sellers vs other products, home page vs product pages, etc.
Performance Metric Outliers
First, if the Performance Max campaign has reliable historical data, familiarize yourself with what “normal” performance fluctuation looks like for it. This will help stifle recency bias.
Look for metric outliers when comparing pre and post major increases or decreases in performance.
Pay special attention to diagnostic and micro-volume metrics like Avg. CPC, CTR, Impr., Conv. rate, Value / conv., Views, Avg. CPM, as well as other major performance indicators like sales-based Conversions and Conv. Value / cost or Cost / Conv.
Open the Products section of the campaign and look for any outliers in Product-specific performance outliers pre and post major drops in performance.
Look at product-specific metrics as a whole for the campaign as well as by Asset Group by adding the Asset Group table filter.
Pay particular attention to differences in high vs low Value/conv. and high vs low priced products, products with a relatively high number of impressions and relatively high CTRs vs relatively high Conv. rate products with statistically significant click data historically, and best seller impressions vs others product impressions.
Is Google now predominantly pushing lower or higher Value/conv. products? Is Google now predominantly pushing products with high CTRs but not products with high conversion rates?
Is Google now favoring to show products that aren’t your bestsellers or products you need to push?
It’s important to note that the Conversion metrics found in this Products section represent products in your product catalog that were clicked and led to the sale of some product of yours, they do not necessarily represent the number of sales of that product after an ad click.
Make sure you compare the product sale metrics you see here with what you find in the Product Performance section of your Google Analytics account with an audience filter that just shows traffic from Performance Max.
To investigate performance change outliers for Listing Groups (performance of product attributes as assigned in Merchant Center and as segmented within an Asset Group), perform the same analysis to the Listing Groups section of your PMax campaign as you did in the Products section.
Note that you will be limited in your ability to analyze comparison metrics in this section because, at the time of this writing (November 2022), comparison values are not available in the Listing Groups section of Performance Max campaigns.
Lastly, check whether there has been a change in approval status to any assets within your Asset Groups or Ad Extensions, such as Eligible (Limited) or Disapproved.
Situation-Dependent Causes Of Performance Fluctuation
It’s important to mention that there will be special case scenarios to consider when evaluating why Performance Max improved or worsened in performance that will only be relevant for some accounts.
I’ve listed many of the most common of those below.
- Major promotions occurred on the site, but Seasonality Adjustments were not added to campaigns promoting those applicable products in the account.
- Data Exclusions were not applied or were applied incorrectly for times when conversion tracking was down.
- Active Scripts or Automated Rules made changes to the account.
- Other users made changes to the account unbeknownst to the primary person managing the account. It’s not uncommon to see a well-intentioned developer, for example, make a change to some conversion action settings in the Conversions section of the account without first informing the primary account manager.
- Google’s Auto-Apply Recommendations feature made changes to the account unbeknownst to the primary person managing the account.
- Customer Match lists were added, edited, or removed from the account.
- A Custom Experiment ended in the account.
- Account-level conversion value rules or adjustments were added, edited, or removed from the account.
- Previously “Best” rated assets within a high-volume or high-performing Asset Group are now rated “Low.”
- High-volume or high performing Search Categories or terms shifted from serving predominantly from a high-volume or high-performing Asset Group to a low-volume or low-performing Asset Group.
- Major shifts in the performance of high-volume or high-performing search terms in non-PMax campaigns.
- Edits were made to a Business Feed in the account that affected the non-PMax campaigns that were using them.
- Errors or edits to a CRM integration with Google Ads, like Salesforce, occurred.
- Negative keywords were added to the PMax campaign per the request of a user other than, and without the knowledge of, the primary account manager.
- Negative keywords were improperly added to a negative keyword list that has been applied to a Performance Max campaign by a Google rep.
- YouTube ad placements were opted out of by Google per the request of a user other than, and without the knowledge of, the primary account manager.
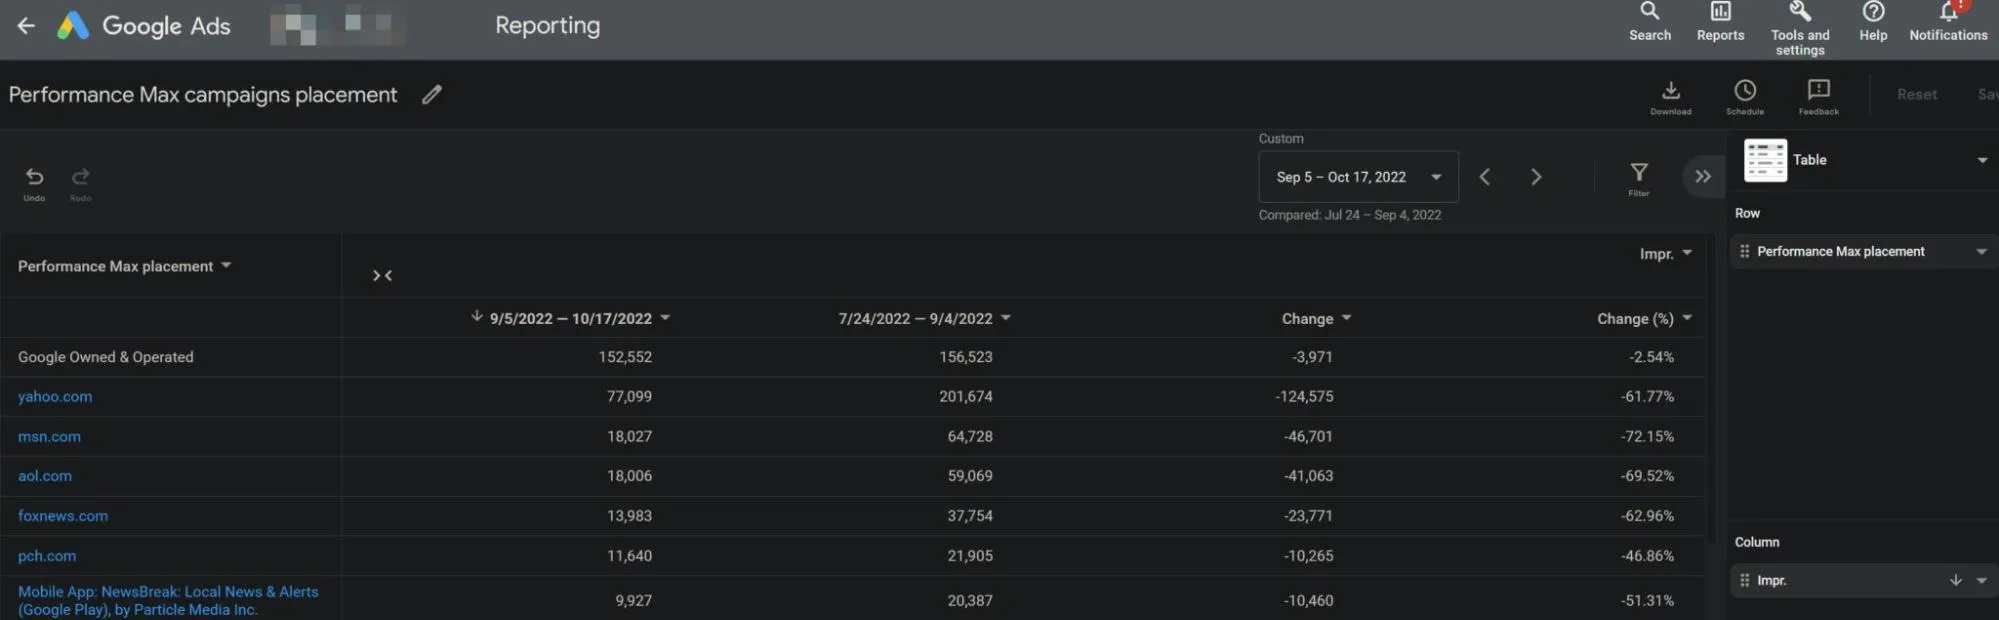
- Mobile app placements not owned and operated by Google incurred sharp increases or decreases in impressions per the “Performance Max campaign placements” report.
- Mobile app category exclusions were applied at the account level.
- Location or Ad Schedule exclusions were added or removed in a PMax campaign.
- Performance Max URL Exclusion rules have been implemented incorrectly.
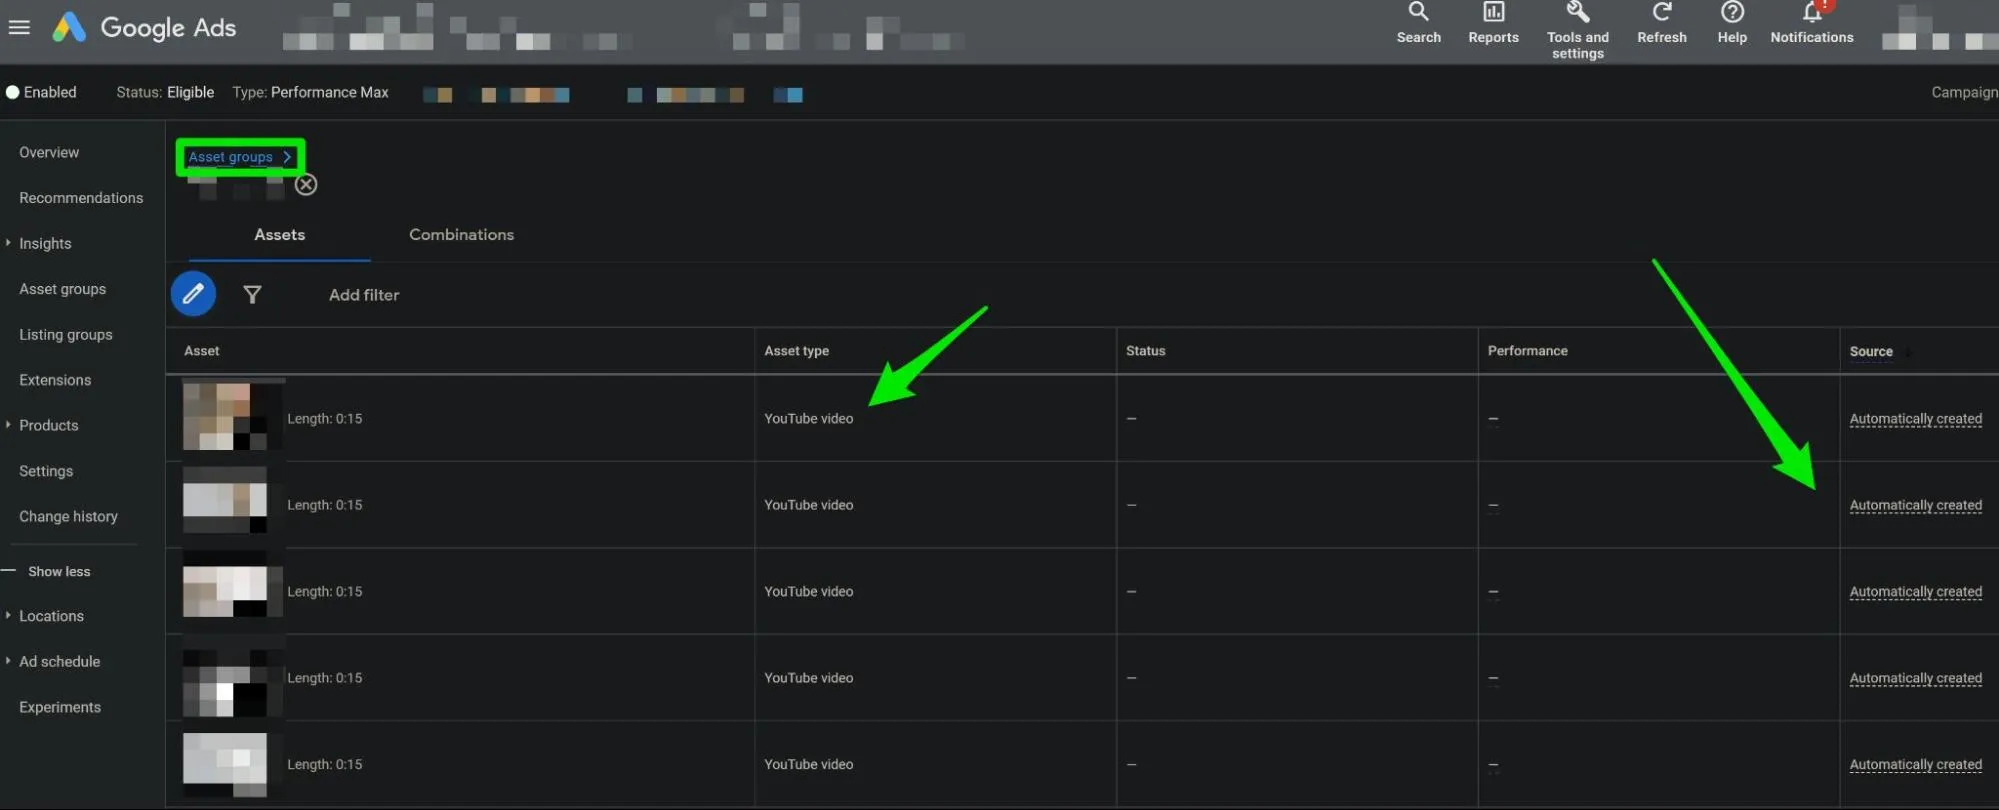
- Auto-generated YouTube videos were added to the campaign by Google due to no video assets being present within an enabled Asset Group.
What’s Next?
Warning: Don’t Make Too Many Corrective Changes At Once
Once you’ve identified areas of opportunity for corrective action or scale, don’t make too many potentially high-impact changes at once, such as changing the bid strategy type AND excluding some high-volume products from your PMax campaign.
With the limited insights we can already gather from this campaign type, the last thing you’ll want to have is a situation where you don’t know which major change you made was the cause of greatly improved or greatly worsened performance.
Where to go from here depends highly on what you found in your analysis and on many other factors that will vary dramatically from business to business, such as, but not limited to, aversion to experimental risk, available ad spend budget, profitability thresholds, goals of the business, and internal resources for account management.
This is where Google Ads is most tricky and often where businesses will turn to PPC professionals for assistance in correcting ad spend inefficiencies or scaling success in a way that is uniquely tailored to the needs and available data of the business.
Performance Max is an ever-changing new-ish product offering from Google Ads, so expect some technical areas of this guide to possibly become quickly outdated.
However, there are also many high-level data analysis principles baked in that I don’t see changing much anytime soon.
While this guide doesn’t cover every possible situation or reason for performance changes in your Performance Max campaigns, my hope is that it will be a solid starting point for most.
I’m also sharing a checklist below to help you get started quickly.
You don’t have to go through every single one of these points. Just go over the ones that are relevant to your business.
I also discussed some of these points on PPC Town Hall with Frederick Vallaeys and Mike Rhodes. You can watch the full video here:
Get actionable PPC tips, strategies, and tactics from industry experts twice a month.


Performance Max 44-point evaluation checklist for ecommerce businesses
Investigate…
- Estimated conversion reporting delay.
- Average days to conversion from first ad interaction (account-wide and campaign-specific).
- Conversion tracking and recent changes to conversion actions.
- What “normal” PMax performance fluctuation looks like for the account (if appl.)
- Recent changes to budget, bid strategy type, Asset Groups, and Listing Groups
- Google Merchant Center product disapprovals and warnings, account issues, and feed issues.
- Changes to the site (e.g. navigation/checkout, plugins, hosting, page designs)
- Changes to in-stock products, especially best sellers.
- Changes to pricing, customer shipping costs, and promotions listed or previously listed on the site.
- Extremely negative reviews on and off the site
- Google Search Console for “Failing” URLs
- Changes in relevant search and buying behavior via the Insights section of your PMax campaign and your account as a whole, Google’s Keyword Planner, Google Trends, your site’s search feature (if appl.), Best Sellers section of Google Merchant Center (if appl.), and Microsoft Ads (if appl.).
- New competitors in the market or competitors who are changing their level of competitiveness within ad auctions you compete in.
- Major changes in other marketing and site traffic channels outside of Google and Microsoft Ads (e.g. Facebook Ads, email automation, affiliates, third-party remarketing channels)
- Major changes in on-site shopping behavior (e.g. cart abandonment, check-out abandonment, sessions with transactions)
- Shifts in Shopping network-specific performance for PMax.
- Top Bidding Signals report for optimization changes recently made by automated bidding.
- Performance shifts of landing pages PMax ad clicks are being sent to.
- Major changes made to non-PMax campaigns that may have impacted the performance of PMax.
- Major shifts in the performance of high-volume or high-performing search terms, geographies, devices, days, days of the week, hours, audiences, match types, or campaign types in non-PMax campaigns.
- Performance metric outliers for the campaign pre and post-major increases or decreases in performance.
- Performance metric outliers for the products advertised in the campaign - at the campaign-level and Asset Group-level.
- Performance metric outliers for the Listing Groups in the campaign.
- Asset Group assets or Ad Extensions with Eligible (Limited) or Disapproved status.
- Seasonality Adjustments not being added for major promotions, or for other major expected spikes or dips in conversion rates.
- Improperly added Data Exclusions, or for instances where Data Exclusions should have been added but were not.
- Scripts or Automated Rules that made changes to the account that may have had an impact on Performance Max.
- Account changes by other users who are not the primary account manager.
- Auto-applied recommendation changes made by Google.
- Customer match list additions, removals, or edits.
- Custom Experiments recently ended in the account.
- Value rules or conversion value adjustments were added, edited, or removed.
- “Best” rated assets inside top performing Asset Groups had a recent change in rating.
- High-performing or high-volume search categories or terms shifted away from a high-performing or high-volume Asset Group.
- Edits made to a Business Feed or Custom Variable that affected any non-PMax campaigns.
- CRM integration issues.
- Negative Keyword List was added to the PMax campaign being evaluated per the request of another user.
- Negative keywords were improperly added to a Negative Keyword List that is applied to the PMax campaign being evaluated.
- YouTube ads were opted out of by another user.
- Mobile app placements not owned and operated by Google had major increases or decreases in impressions.
- Mobile app category exclusions were applied at the account or campaign level.
- Location or Ad Schedule exclusions were added or removed for the PMax campaign being evaluated.
- Improperly setup Performance Max URL Exclusions.
- Auto-generated YouTube videos were added by Google to the PMax campaign being evaluated.
Want to safeguard your Performance Max campaigns? Click here to learn how.
Get actionable PPC tips, strategies, and tactics from industry experts to your inbox once a month.