Amazon Prime Day isn’t a Google event. There’s no banner in the interface, no seasonality preset, no official guidance. Yet every July, Google Ads advertisers who have never opened a Seller Central account watch the ground shift under them. A massive external signal reshapes the Google Ads auction floor in a matter of days.
We wanted to know how much. So we looked at aggregated Google Ads performance across 22,034 accounts managed through Optmyzr, comparing four windows around Prime Day 2025 (July 8-11): a June baseline (Jun 10-16), the week before the event (Jul 1-7), the event itself, and the week after (Jul 12-18).
The averages say Prime Day was no big deal. The segments say it depends entirely on what you sell and how you bid.
The next two sections are the whole story in brief: what we found, then what to do about it before (and during) the next event. Everything after that is the evidence.
The short version
If you read one section, read this one.
- CPCs rose during the Prime Day period, and the increase reversed within a week. Aggregate cost per click (CPC) peaked at $0.73 during the event and came right back down after. For most accounts, the event was a brief pressure point, not a lasting one.
- The week after Prime Day showed no hangover. Cost per acquisition (CPA), return on ad spend (ROAS), and conversion rate (CVR) in the post-event week were as healthy as any week in the study. But most of that strength was already in place before the event, so read it as “no post-event slump” rather than a Prime Day payoff. Either way, there was no reason to pull back.
- Ecommerce and lead gen lived through two different events. Ecommerce accounts captured real demand: ROAS peaked at 723% during Prime Day and efficiency kept improving afterward. Lead gen accounts paid higher CPCs and CPAs with no ROAS lift to show for it, and their efficiency dip outlasted the event.
- Automation works best with guardrails. Smart Bidding isn’t a set-it-and-forget-it solution. It’s an engine that needs a pilot. Target ROAS and Target CPA held steady because they had clear efficiency targets. Maximize Conversions, the strategy where you essentially tell Google to get volume at any price, posted the biggest CPC spike and never fully recovered. Target Impression Share was worse, bleeding ROAS to chase visibility.
- Results were consistent with an Amazon-overlap hypothesis. Home & Garden may have greater category overlap with Amazon, and it saw CPC and CPA peak during the event while ROAS bottomed out. Tech & Computing and Style & Fashion stayed resilient, with ROAS and conversion efficiency improving straight through the event window.
What to do before (and during) the next Prime Day
Here’s the playbook. The first five moves come straight from the data in this study. The last one is about watching the next event unfold in real time, while you can still act on it.
- Don’t cut budgets the day after the event. There was no post-event slump in this study; the week after was as efficient as any other, at the aggregate level and for ecommerce especially. Slashing spend on July 12 would have meant pulling back into perfectly healthy conditions for no reason.
- If you run lead gen, plan for the event plus the week after. Lead gen accounts paid higher CPCs and CPAs during Prime Day with no efficiency lift, and the CVR dip extended into the following week. Your budget pacing and your expectations should account for that longer tail.
- Make sure your bidding strategy has a value constraint before the next high-competition window. Target ROAS and Target CPA improved through the event. Maximize Conversions spiked CPCs and didn’t recover its ROAS, and Target Impression Share bled efficiency throughout. If you head into a major retail event on a volume-only or visibility-only strategy, you’re telling the algorithm to keep buying no matter what the auction charges.
- Map your Amazon overlap honestly. Home & Garden felt the auction heat. Tech, Fashion, and Automotive didn’t, or absorbed it. Knowing which side of that line your products sit on should shape whether you lean in, hold steady, or protect efficiency during the event window.
- Don’t panic mid-event. The aggregate CPC increase reversed within a week. The accounts that got hurt weren’t the ones that paid more for four days. They were the ones whose bidding strategy had no brake pedal.
- Watch the event unfold in real time. These numbers are population averages; your account will write its own story during the four days that matter. Monitor budget pacing, performance anomalies, and your top campaigns and products live, so you can act before a problem costs you revenue. Optmyzr’s Sale Day Command Center was built for exactly this: it pulls Google Ads, Merchant Center, and Analytics into one dashboard with budget-exhaustion and site-down alerts, hourly trends against last year’s same sale day, and disapproved-ad and out-of-stock flags you can fix on the spot.
The rest of this study walks through each cut of the data, with the full tables. The aggregate numbers look contained, but they hide very different experiences depending on what you sell and how you bid. In every table below, the best value for each metric is shown in green and the worst in red.
The aggregate picture: a brief bump, then no hangover
Across all 22,034 accounts:

CPC peaked during Prime Day at $0.73 and came back down the following week. Click-through rate (CTR) rose during the event and settled right back to its pre-event level.
What happened next matters for how you pace budgets. The week after the event was as efficient as any in the study on CPA, ROAS, and CVR. The catch is most of that improvement showed up before Prime Day even started. Aggregate ROAS rose from 567% in the baseline week to 601% pre-event, then barely moved through the event and after. So this looks more like normal July conditions than a post-Prime surge, and the CVR differences in particular (a range of under 2%) are small enough to be noise. What the data does rule out is a hangover: there’s no sign the event drained the following week’s demand.
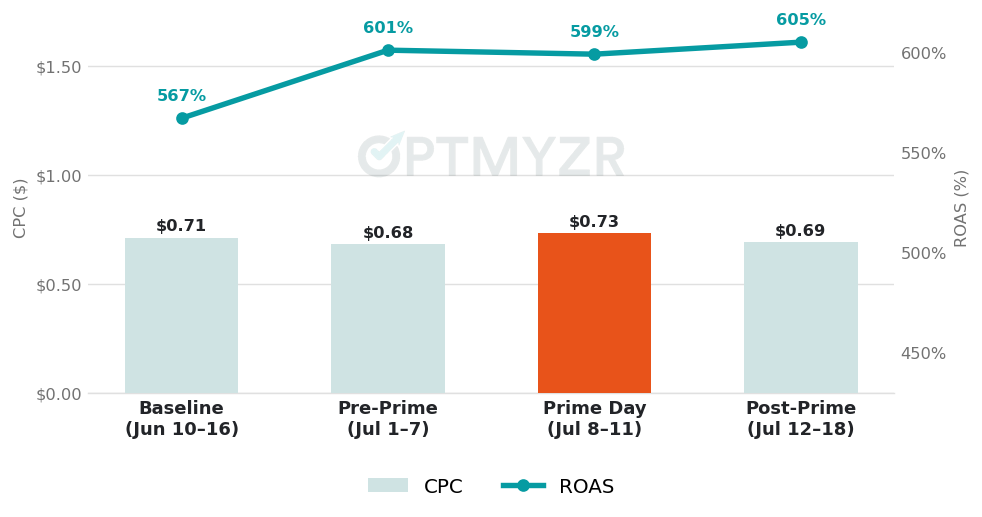
Aggregate CPC and ROAS across the four windows. The Prime Day CPC bump is the clear signal: it rose about 7% and reversed within a week. ROAS held steady, with most of its improvement already in place before the event.
That’s the aggregate story. But averages are where the real insights go to hide, so the segments are where this gets interesting.
Ecommerce vs. lead gen: the same auction, two different bills
This is the most consequential split in the study. If you remember one pair of tables from this report, make it these two.
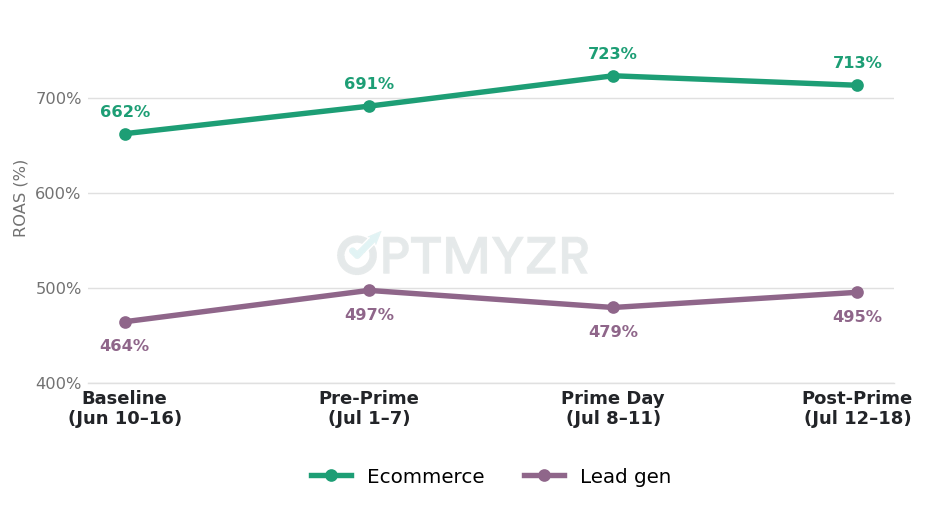
ROAS by business model. Ecommerce captured demand during Prime Day; lead gen paid more without the lift.
Ecommerce accounts

Ecommerce advertisers experienced stronger performance metrics during Prime Day. ROAS rose to its highest point during the event, at 723%. CPC barely moved across any of the four windows, so these accounts were largely insulated from auction price pressure.
CVR and CPA both kept improving after the event, and the post-week produced the best values in the table for both. Whatever drove it — carry-over intent, thinner post-event competition, or normal seasonality — the pattern is clear: ecommerce efficiency peaked after Prime Day ended, not during it.
Lead gen accounts

Lead gen advertisers got the costs without the party. CPC rose from $1.02 in the pre-event week to $1.12 during Prime Day, and CPA climbed alongside it to $6.57, with no ROAS lift to offset the higher spend.
CTR tells its own story. It spiked to 2.57% during the event and fell straight back after. People clicked more during Prime Day, but those clicks didn’t turn into a lasting conversion-rate improvement. The pattern is consistent with shoppers in deal-hunting mode clicking ads that couldn’t satisfy that intent, though the data stops short of proving it.
The most concerning part for lead gen: the dip outlasted the event. Post-week CVR was the lowest of all four periods, below even the Prime Day level, and ROAS didn’t recover to its pre-event mark within the study window. For ecommerce, Prime Day lasted four days. For lead gen, it lingered into the following week.
Campaign types: Shopping shrugged, Search paid
Search

Search bore the most cost pressure of any campaign type. It had the largest CPC increase in this cut of the data, and CPA tracked the CPC move because CVR offered no offset. ROAS dipped during the event. The good news: it recovered to its highest point of the study, 620%, in the post-week. Search took the hit and bounced back.
Shopping

Shopping is the calmest table in this study. CVR rose in every single period, the most consistent trend in the campaign-type data. CPC held at $0.29 through the event, CPA improved, and ROAS peaked during Prime Day at 450%. Shopping absorbed Prime Day conditions without any of the CPC pressure that hit Search.
Performance Max

Performance Max looked a lot like Shopping: modest CPC movement, a CVR improvement during the event, and CPA falling steadily across all four periods. ROAS peaked during Prime Day at 719% and held close after. A stable picture with a slight efficiency-improvement trend, which is what you want from a campaign type you’ve handed this much control to.
Display

Display produced the oddest pattern in the campaign data: ROAS peaked during Prime Day even though CVR dipped. One reading is that the conversions during the event skewed toward higher values, fewer of them but worth more each. The data doesn’t confirm that, so treat it as a hypothesis to check in your own account, not a conclusion. CPC and CPA stayed low relative to Search throughout.
Demand Gen

Demand Gen showed limited sensitivity to Prime Day relative to Search. CPA improved during the event and held flat after, while ROAS climbed through the event and into the post-week, finishing at its highest point. Whatever was driving Demand Gen’s improvement, Prime Day didn’t interrupt it.
Bidding strategies: the value constraint earned its keep
This is the most practically useful cut in the study. Unlike your vertical or your business model, your bidding strategy is something you can actually change before the next event.
Target ROAS

The cleanest table in the study. ROAS improved through Prime Day and kept rising after. CVR and CPA both moved in the right direction across all four periods, and CPC was the most contained of any Smart Bidding strategy during the event. The post-week posted the best CVR, CPA, and ROAS of the four windows.
Target CPA

CPA fell during Prime Day and kept falling after, the most consistent CPA improvement of any bidding strategy. ROAS moved in the same overall direction. One of the cleaner trend lines in the bidding data.
Maximize Conversion Value

One caveat before you read this table: CVR in the pre-event week was already well below baseline. That’s a pre-existing dip, not a Prime Day effect, so don’t credit or blame the event for it. Within the event window, CPA fell and continued improving after, while ROAS held relatively flat across all four periods.
Maximize Conversions

Maximize Conversions is the cautionary tale in this dataset. It had the largest CPC spike of any strategy during Prime Day, and it was the only Smart Bidding strategy whose ROAS didn’t recover within the study window: ROAS peaked in the pre-event week at 311%, dipped during the event, and finished the post-week still below that pre-event level. Without a value constraint, nothing tells the algorithm to stop when CPCs rise. The data doesn’t show what happened inside the model, but the outcome is exactly what you’d expect from a strategy whose only objective is volume, with no guardrail on what it pays to get there.
Manual CPC

The CTR spike is the most distinctive signal here: the biggest jump of any period, to 3.53%. CPC rose about 8% during the event, yet ROAS was broadly flat across all four periods, which suggests these advertisers held their efficiency despite paying more per click. Manual bidders, it turns out, didn’t panic.
Target Spend

Target Spend peaked during Prime Day, with ROAS hitting 418%, and then gave it back. Post-event ROAS dropped below the pre-event level, and CVR fell to its lowest point of the study. One of the few strategies where the post-week showed a clear reversal rather than continued improvement.
Target Impression Share

ROAS declined consistently from the pre-event week through Prime Day to the post-event week, the sharpest downward trend of any bidding strategy in the study. This shouldn’t surprise anyone. A strategy that optimizes for visibility rather than value keeps buying that visibility when the auction heats up, whatever it costs. The data is consistent with the theory.
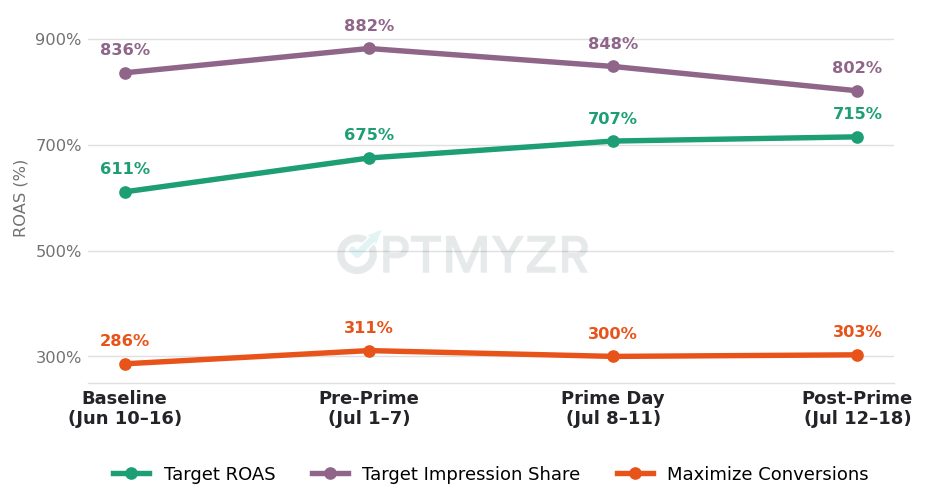
ROAS by bidding strategy. The value-targeted strategy climbed through the event; the volume- and visibility-only strategies didn’t.
What the bidding data adds up to
Strategies with explicit value targets showed more resilience. Target ROAS and Target CPA both posted ROAS improvement during Prime Day and kept improving after, with CPA falling through all four periods. That’s consistent with a value constraint limiting overbidding in a more competitive auction, with the usual caveat that this is observational data, not a controlled experiment.
The strategies without a value constraint paid for it. Maximize Conversions chased volume and Target Impression Share chased visibility, and both footed the bill for the event. In Maximize Conversions’ case, the bill still wasn’t fully paid by the end of the study window.
Verticals: Amazon overlap roughly predicted who paid
Home & Garden

The most visible cost pressure of any vertical. CPC and CPA both peaked during Prime Day, ROAS dropped to its lowest point, and the post-week brought only a partial recovery, with ROAS landing just above baseline. This is a category with meaningful overlap with Amazon’s core retail catalog, and the auction data reflects exactly that.
Real Estate

Read this one carefully. The pre-event ROAS was already far below baseline, a pre-existing shift rather than a Prime Day effect. Within the window, CPA improved during the event while CTR rose, and post-week ROAS was the highest of all four periods at 641%. But the swings here are large enough that sample size is a real consideration. I wouldn’t build a strategy on this table.
Health & Fitness

The pre-event week was the strongest period for this vertical, not Prime Day. CVR and CPA were at their best before the event, CPC rose back toward baseline during it, and the post-week saw further CVR decline.
Travel

ROAS hit its high in the pre-event week at 760%, then compressed during Prime Day. CVR was flat throughout, so the ROAS movement tracked mostly with CPC. The post-week recovered partially but didn’t reach the pre-event level.
Automotive

Automotive is the textbook case of absorbing auction pressure. CPC rose about 10% during Prime Day, and CVR improved by a similar proportion, so the net effect was a near-flat CPA across the event and pre-event periods. One of the most balanced responses to auction pressure in the vertical data.
Tech & Computing

The most coherent improvement arc of any vertical in this dataset. ROAS rose through Prime Day and kept rising after, finishing at 897%, the highest of any period. CPA fell consistently across all four windows. You’d expect a tech category to feel Amazon’s biggest event most acutely. This data says Google advertisers in the space did just fine.
Style & Fashion

CPC fell during Prime Day and CPA improved alongside it. ROAS rose through the event and into the post-week, reaching its highest point at 872%. The pre-event week was actually the weakest period for this vertical within the study window.
Sports

ROAS peaked during Prime Day at 875%, then fell in the post-week as CVR dropped to its lowest point and CPA rose. A post-event reversal that didn’t show up in most other verticals. Worth watching if the pattern holds in future years.
Food & Drink

CPC fell steadily after the pre-event week, reaching its lowest point post-event at $0.61, and CPA followed. ROAS stayed relatively flat across Prime Day and the post-week, with no clear lift from the event. The post-week efficiency improvement here came from lower costs, not a higher conversion rate.
What the vertical data adds up to
No vertical was uniformly better or worse across all five metrics. But one pattern is hard to ignore: the verticals that handled Prime Day best — Tech & Computing, Style & Fashion, and Automotive — tend to have less direct product overlap with Amazon’s core retail categories, while Home & Garden, which overlaps heavily, took the most visible cost pressure. I want to be careful here. This is pattern-matching across a handful of verticals, not a firm conclusion, so treat it as a hypothesis to test against your own account.
Two other observations worth carrying forward. Automotive showed what a healthy response to auction pressure looks like: CPC up, CVR up by a similar amount, CPA flat. Sports and Travel both showed post-event reversals, peaking in a key metric during or before the event and then declining the following week, a different trajectory from the ecommerce-heavy verticals.
How this study was built
We pulled account-level and campaign-level Google Ads reporting across 22,034 accounts in the Optmyzr platform.
To keep outliers and tracking artifacts from distorting the aggregates, we excluded accounts with daily spend under $10 USD, conversion rates over 100%, ROAS over 5,000%, or conversion values over $10M per day. Ecommerce account-days with zero conversion value were dropped as likely attribution gaps.
For the ecommerce classification: accounts running Shopping campaigns, or Performance Max campaigns linked to a Google Merchant Center feed, were classified as ecommerce. Everything else was classified as lead gen.
The four comparison windows were Baseline (Jun 10-16), Pre-Prime (Jul 1-7, chosen to avoid July 4), Prime Day (Jul 8-11), and Post-Prime (Jul 12-18).
The usual caveat applies to everything above. This is aggregated, observational data. It tells you what happened across a large population of accounts. It can’t tell you what caused any single outcome, and it can’t tell you what will happen in your account. Use it to form hypotheses, then test them.
A note on what’s signal and what’s noise: these are point estimates, not a controlled experiment, and we’re not publishing confidence intervals. Lean on the big, coherent moves, like the CPC rise during the event that reverses the week after, and the gap between ecommerce and lead gen. Be skeptical of small differences (anything under a few percent, such as the aggregate CVR changes) and of swings inside thin slices like individual verticals or minor bid strategies, where a handful of large accounts can move the average. Real Estate is the clearest example: its numbers bounce around too much to build on. The broad cuts are reliable; the narrow ones are directional.
Prime Day will keep getting bigger, and Google’s auctions will keep feeling it. The advertisers who come out ahead are the ones who decide, before it starts, what kind of event it’s going to be for them. That’s what this data is for.