AdWords Quality Score is still somewhat of a black box. Thanks in a large part to the numerous factors that Google takes into account while calculating QS during the real-time auction. In 2007, Google started to show advertisers additional details about their Quality Scores. Originally, it only indicated if the landing page or CTR was an issue, but has since improved to show three components that factor into QS: ad text relevance, expected CTR and landing page relevance. Thanks to the latest reporting updates to their API, these three sub-components of Quality Score that have long been visible in the AdWords UI are now accessible through the API.
We have already included the three components of Quality Score – Predicted CTR, Ad Relevance and Landing Page Experience in the Quality Score Tracker. This data makes it easier to identify specific areas for improvement instead of shooting in the dark.
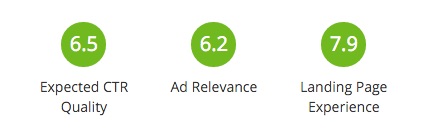
What are the three components of Quality Score?
- Expected CTR/Predicted CTR: This is based on the historical performance of keywords and ads. During the real time auction other factors like device, location, the words in the query, the time of day, etc. are also taken into account.
- Ad Relevance: This component measures how relevant the keyword is to the ad.
- Landing Page Experience: This is based on how relevant your landing page is to the keyword and ad. It also takes into account factors like transparency, ease of navigation, original content, and page load times as they affect the overall user experience.
In AdWords, the three components are shown as ‘below average’, ‘average’ and ‘above average’. To give you an idea of the overall health of the account at the component level, we’ve come up with a way to aggregate this data and show you a numerical score that can range from 1 to 10, just like the QS number you’re already used to seeing from Google. This data is also available at the campaign, ad group and keyword level in the relevant tabs in the Quality Score Tracker. Showing the component scores at higher levels than just the keyword helps you see bigger issues to focus on. For example, if you see that the Landing Page Experience score for the account is less than four then the website as a whole needs to be fixed.
How can I use this data to optimize?
- Start from the list of ‘Ad groups to Optimize’ on the Quality Score Dashboard and work your way down this list. We’ve already prioritized these ad groups based on a combination of low QS and high cost. That way we know that your optimization work will have the biggest impact on your bottom line.
- Inside the ad group, go to the keywords tab and see which keywords are affecting the QS negatively.
- For these keywords, check which component has a low score and fix that. For example, if the ad relevance is low, you can break out the keyword into a different ad group and write more relevant ad text.
You can also select a campaign with a low QS from the campaign selector on the left and then identify the ad groups that need to be optimized. The optimization can be done directly in your AdWords account.
Check the score for the three Quality Score components in your Optmyzr account.![]()
We’ve already used this new data to optimize our own account’s QS so we hope you will find it useful too.