


I spend a lot of time talking and writing about the more humanistic elements of advertising; how to appeal to your audience in a unique and personal way, how to create a genuine connection with your visitors and so on and so forth. In our experience, there’s a lot to be said for these sorts of unquantifiable things that often get overlooked amongst the maelstrom of statistical analysis and data crunching.
Often times we need to make a judgment call that accounts for both our intuition and the immutable data our campaigns accrue.
That being said there are times when it’s important to sublimate our instinctual emotions and optimize our campaigns within the ruthlessly unforgiving framework of our historical data.
A/B split testing ad copy is one these instances.
Few, if any, of the standard optimization techniques we SEMs use will yield as consistent and predictable results as A/B split testing our ad copy. We can peel and stick keywords into new ad groups, restructure our account to work on our Quality Scores, readjust our custom bidding schedule with the hope of increasing our conversion rates – but they’re all inherently unpredictable to a certain extent. A/B split testing ad copy, when done right, will guarantee that your KPI of choice will increase (however incrementally) over time.
However, there are some important things to understand about A/B split testing ad copy that will spell the difference between your tests’ success or failure.
Setting yourself up for success in Adwords
Optmyzr provides by far the most advanced and efficient A/B split testing tools available to agencies and individual advertisers, but you need to make sure your AdWords campaigns are configured in a way that will help you run your split tests appropriately from within the Optmyzr dashboard.
By default, AdWords will optimize your ad rotation based on the ads expected to get the most clicks. This is great – if you’re lazy 🙂
If Google rotates your ads based on the ads expected to get the most clicks, you’ll generally see one or two of the ads in a given ad group getting the lion’s share of impressions and clicks. Naturally.
A/B split testing is all about getting statistically significant data across all the ads involved in any given test, so the first thing you need to do is change the ad rotation settings to rotate evenly. AdWords offers the option to rotate evenly for 90 days and then optimize, but since we’re going to be A/B split testing long after 90 days (right!?) we want to choose the “rotate indefinitely” option.
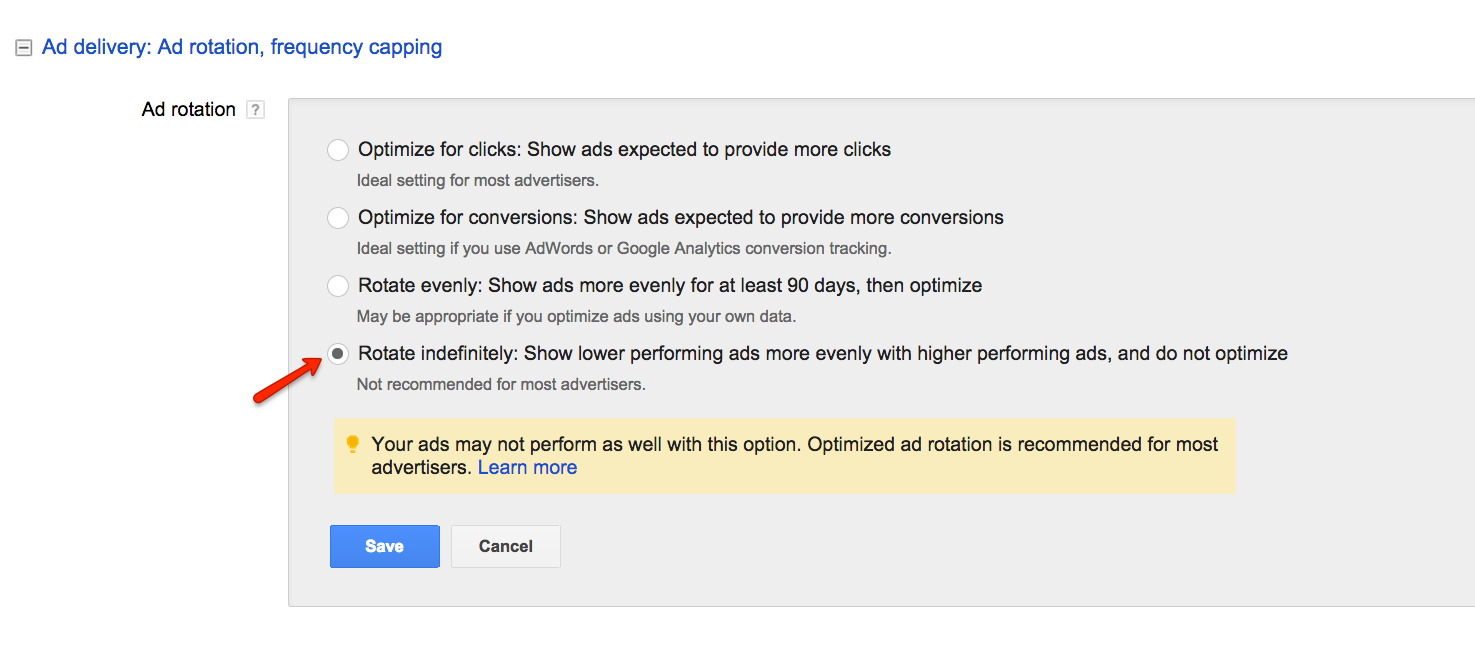
You can change this setting in the campaign setting tab. Keep in mind, since this is a setting modified at the campaign level, it will apply the rotation setting to all the ad groups in the campaign.
Developing your A/B Split Tests
Now that we’ve configured our ads to rotate evenly, we need to figure out what to test and how to test it. Based on how much data your account is generating you’re going to have to decide what type of split test you want to run.
People often confuse technical terminology, so we’ll begin by defining the difference between a multivariate (full factorial) test and an A/B test.
A/B split tests are the easiest to run and unless your landing pages are getting high volumes of daily traffic, an A/B split test is the method of choice (in my opinion at least). While many people think that A/B split testing is strictly for testing one individual variable, that’s not really the case. You can run 2 completely different ads against each other (or 3 or 4 for that matter), with different headlines, description text and display URLs, and still call it an A/B split test.
If you’re just measuring which ad performed the best, and not which individual variable performed the best, it’s an A/B test.
A multivariate test is when you seek to learn which individual variable performed the best. In other words, if you were testing 4 different variables (headline, description line 1, description line 2 and display URL), you would need to write 16 different ads (all possible combinations) in order to see which combination of variables worked the best. For most accounts, multivariate tests sound great in theory but don’t work so effectively in practice. In order to determine a winning ad, you need statistically significant data. Most accounts aren’t getting the kind of volume to make multivariate tests worth the time and effort.
So for our sake, let’s go back and talk a little more about A/B split tests.
I strongly recommend running single variable A/B split tests whenever possible (and let’s face it … it’s always possible). When you run 2 ads alongside each other testing just one variable, you know what element in the ad accounted for the better (or worse) performance.
For example, say you decided to run an A/B test on 2 different ad headline ideas. You’re a high end self-publishing company and you thought it may be a good idea to include your minimum order price in your ad headline to help dissuade people looking for cheap solutions from clicking on your ad. So you write two identical ads and only change the ad headline in one of them to include your minimum order price. When the statistically significant (more on that soon) results are in, you’ll know beyond the shadow of a doubt that it was the change in the ad headline that accounted for the difference in performance.
If for example you also changed the description lines of the ad to something other than the identical copy of the other ad in the ad group, you won’t know if it was the headline or the description or a combination of the two that accounted for the difference in performance.
Like we said, that would still be considered a valid A/B split test since we know one of the ads statistically outperformed the other ad, but we won’t know exactly which element of the ad should get the credit.
That being said, there are times a multivariable A/B split test is really useful. If you’re running a new ad group and you have two completely separate ideas that are thematically dissimilar, running two completely separate ads in an A/B test to determine which direction you should take for future tests could be a really useful strategy to use.
Let’s go back to our previous example of your high-end self-publishing company. You’re not sure whether highlighting the speed and quality of your service or the professionalism and experience of your editorial staff would make for a better ad. These are two separate ideas, and with the allotted ad space you can’t cover both aspects of the business. In this case, it may be a good idea to run a multivariable A/B test with one ad focusing primarily on the speed and quality and another ad focusing primarily on the editorial staff. You’re not testing any one variable like a headline, but rather a concept as a whole. Once your test determines which ad is more appealing (based on the KPI you choose to measure by – more on that soon) you can then dive into single variable A/B tests to further refine your copy and consistently increase performance.
For the sake of not getting stuck in a rut of stagnation and complacency, it’s always a good idea to periodically test new multivariable “concept” ads to try and find new ideas that you haven’t explored in the past.
Now that we know the sort of test we want to run, what do we actually test? You’ll probably get five different answers to this question if you ask five different people, so I’ll just tell you what we’ve found from the hundreds of accounts we’ve managed over the past few years.
Start with A/B testing ad headlines. When testing one variable like a headline, I generally aim to write four variations – which of course would give us four separate ads in an ad group. If you’re getting fewer than 75-100 clicks daily for any given ad group, consider writing 2-3 ads instead.
Your headline is not only the first element of your ad read by a user; it is often the only part of the ad that gets attention. If someone sees an ad headline they really like, they’ll often click the ad without reading the rest of what you have to say for yourself. Conversely, if the headline turns them off or isn’t precisely what they’re looking for, they’ll likely pass you on and move to the next ad on the page.
There’s a lot of information to swallow on a search engine results page, and people just don’t have the time or mental fortitude to read and analyze every line of every ad and organic result. It’s not something we advertisers like (after putting so much work into every character of our precious ads) but it’s the cold reality we have to eventually come to terms with. So in fewer words, test your headlines first. I hope most people would agree with that.
Following our logic, test your description lines of text next. Whether you test one line at a time or both lines of description text in one shot depends on your preference and the type of ad you’re writing (is there a distinct thought on each line or are both lines one long message?).
It’s a good idea to test your display URLs since the historical CTR of your display URLs plays a role in your Quality Score. Don’t expect to see dramatic results from an A/B test on display URLs (if there’s one part of your ad someone won’t read, it is the display URL), but test them anyway for the sake of Quality Score and for the sake of doing your job right.
What specifically to test is a longer discussion for another time but I try to always think of the products and services we’re advertising more in the context of their emotional benefits to the customer and less in the context of their features. Nobody buys a vacuum because they want a vacuum; they buy a vacuum because they want a clean room. We’ve seen some extraordinary A/B test results testing features VS. benefits (“bag-less and compact!” VS. “a home as clean as you after a long hot shower!”), and in almost every case, highlighting benefits and emotional payoffs always produce better results.
Also consider the idea of what I like to call qualifiers. Qualifying your clicks by including prices in your ads is one way of dissuading undesirable clicks from people whose traffic you don’t want to pay for.
A/B testing landing pages is also something that is highly effective, but with the advent of complex A/B landing page tools and software it has become an industry unto itself and need not conflict with your ad copy A/B split tests.
I’d be remiss to not mention the idea of testing your call to action. Of course, you have a call to action (right!?), and it’s a great idea to test different CTA’s to see which ones capture the attention of your audience the most effectively.
Now that we know how and what to test, let’s take a look at how we measure and define the results of our tests.
Statistical significance
If we didn’t have a tool like Optmyzr, the next few paragraphs would probably (definitely) bore you half to death. I don’t know about you, but I’d rather watch paint dry than talk, write or listen to anything that had to do with coefficients, correlations and the holy grail of statistical measurements – p values.
Luckily for all of us, Optmyzr does all that work for us. But just for the sake of our intellectual well-being, a quick word on p values.
In a statistical test, a p value tells us how significant, or scientifically interesting, our results are. We may find that headline A had a higher CTR than headline B, but how confident can we be that we’d see the same results if we ran the same test again? And again after that?
Our p values (also referred to as our confidence interval) tell us how confident we can be that we’d see the same results repeated, or in other words how reliable our findings were. A p value is just a number outputted by the statistical equations used to calculate the correlation between our variables, and depending on the field of study, different p values represent different thresholds of acceptability.
In the medical profession, when the results of a test can quite literally inform a surgeon on a life and death decision, a p value of less than .01 is required to determine reliability. For AdWords, a slightly less precarious area of study, we could assume that a p value of less than .05 is perfectly acceptable. In fact, in the social sciences p<.05 is the benchmark for reliability.
At this point you’re probably thinking if you never hear the words p value again it would be too soon. Amen to that, brother. I promise, it’s going to be lots of colorful pictures from here on out.
Since this isn’t a beginner’s Optmyzr tutorial, I’m going to assume basic working knowledge of the Optmyzr dashboard.
So we’ve configured and launched our split test, and now we want to see if we have enough statistically significant data to pick our winners.
Navigate over to the A/B testing for ads under the one click optimizations dropdown in Optmyzr.
Before we analyze our results, we’ll want to take a look at the settings Optmyzr allows us to configure.
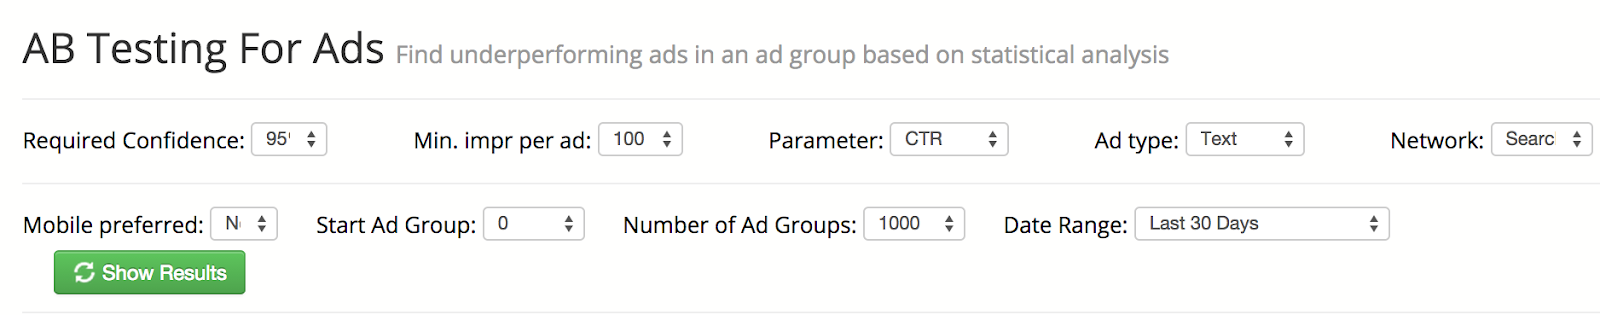
Remember p values? That’s what OPTMYZR is referring to with Required Confidence. By default it’s set to 95% (p<.05) and that’s a good place for it to stay. You can also filter your results by Ad Type, Network, Minimum Impressions Per Ad and the Date Range.
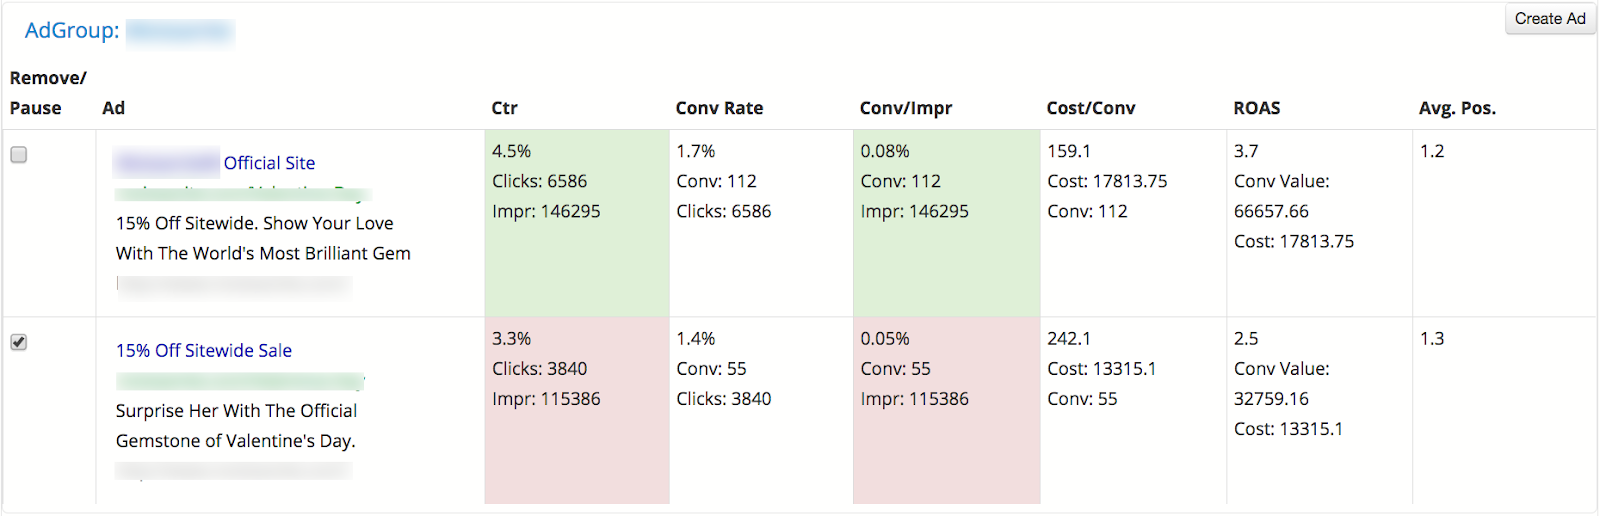
The important option to look at here is the Parameter options list. As you can see from the first image, Optmyzr sets our parameter to CTR by default. This means that the statistical analysis will look at CTR as our key performance indicator of choice to determine the winning ad. As you can see from the green and red highlights in the CTR column, CTR is the metric being “studied” in this test.
You can also choose to run the A/B test results using conversion rate and conversions per impression as your metric of choice.
In order to determine which parameter you should use depends on the strategy behind the ad groups you’re testing ads in. If you’re running a broader, loosely targeted campaign to drive traffic to your site so you could build your remarketing audiences or your brand awareness, CTR may very well be the metric of choice for you. If your campaign is designed to drive profit and a positive ROI, then you may want to analyze your ad performance in the context of conversion rate.
Because the campaign we’re looking at here is a branding campaign, I care primarily about visitors to the site – so I’ll keep CTR as our metric of choice.
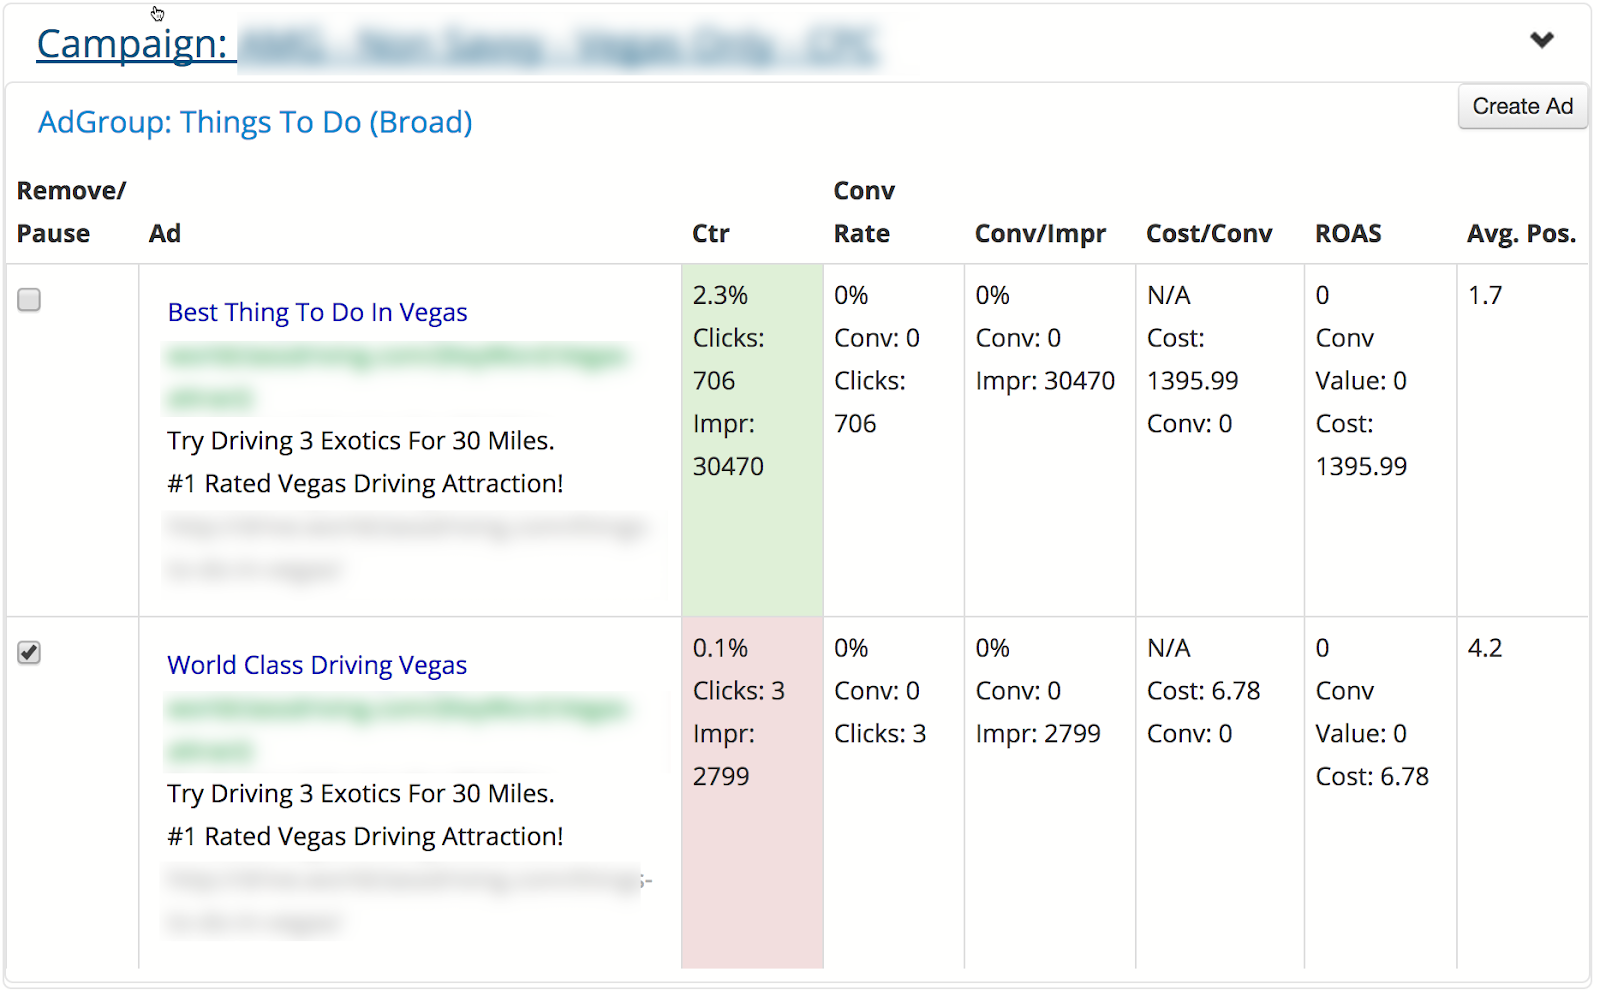
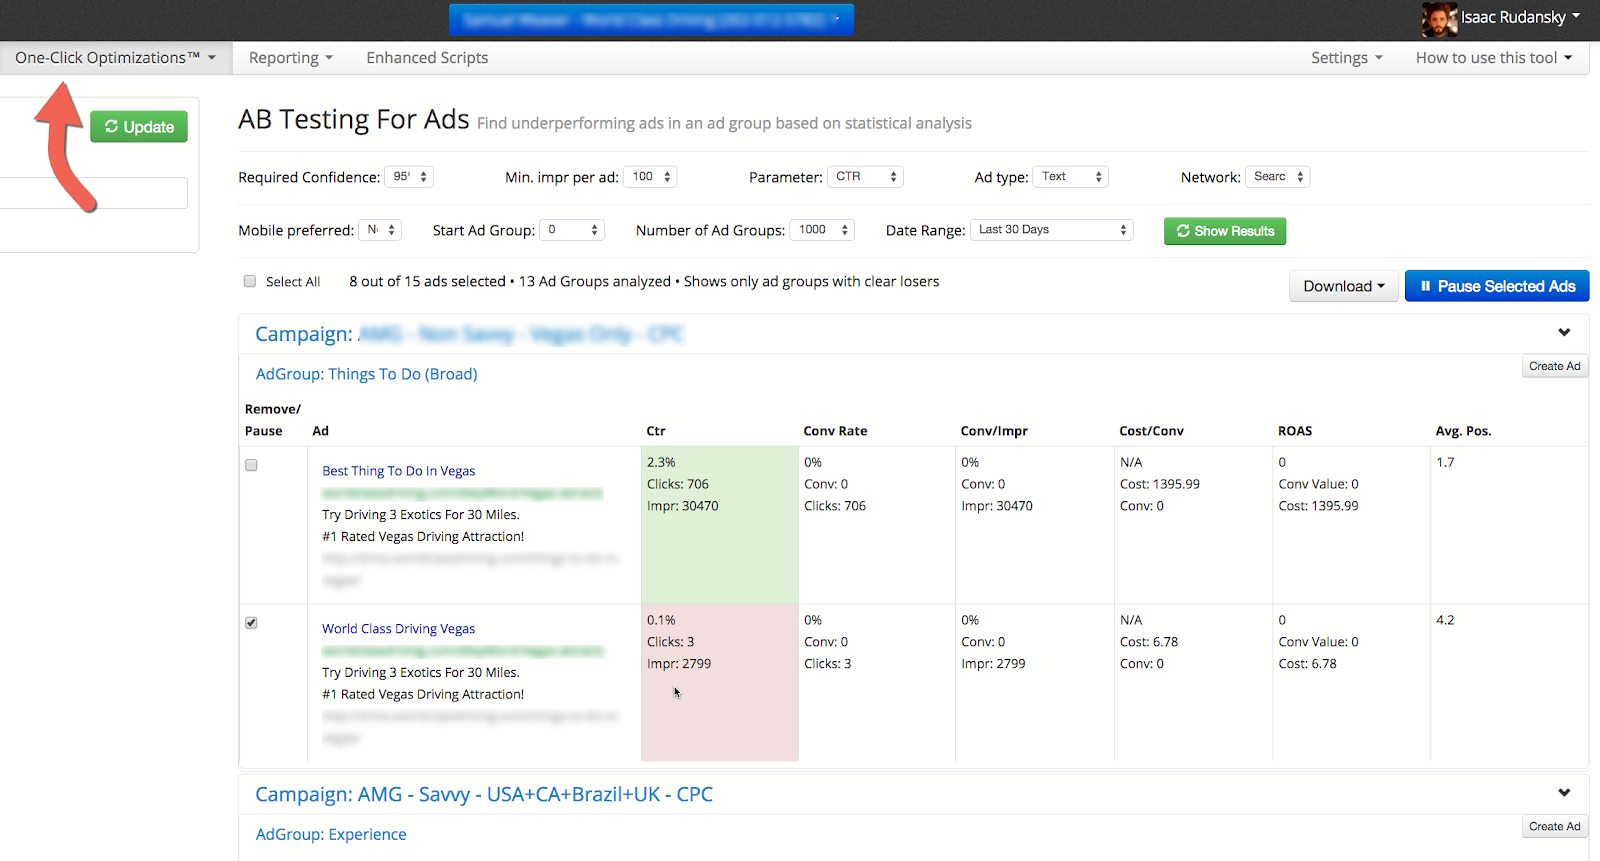
So for this A/B test we’re testing two different headlines. Based on a confidence level of 95%, Optmyzr outputs a winning ad using CTR as our metric of choice.
But can you spot something wrong?
The winning ad has a much higher volume of clicks and impressions as the losing ad. This is because the ads in this ad group were not set to rotate indefinitely and Google was giving preference to the ad expected to get more clicks. While the test results are still statistically significant, we want our data to be more equal when it comes to the volume of clicks and impressions.
Let’s hop over to another account to see what a proper A/B test should look like.
In this example, we ran a multivariable A/B test on two different overall ad concepts. Even though the winning ad still has quite a few more clicks than the loser, the losing ad has enough volume to lend real validity to the results of this test.
Notice another thing. Even though my parameter of choice over here is still CTR, Optmyzr graciously lets us know if another one of the metrics also matches up with statistical significance at our desired confidence interval. In this example, the winning ad also has a statistically significant higher Conversion per Impression rate than the losing ad. Good to know!
If you run into instances when one ad wins on CTR but loses on conversion rate, you need to seriously think about the campaign strategy and decide which metric to base your optimizations off of.
If you haven’t fallen in love with Optmyzr, you will now!
Not only does Optmyzr make it incredibly easy (and a little fun) to run AB split tests results across an entire account in one shot, Optmyzr also allows you to pause the losing ads from each split test with the click of a button.
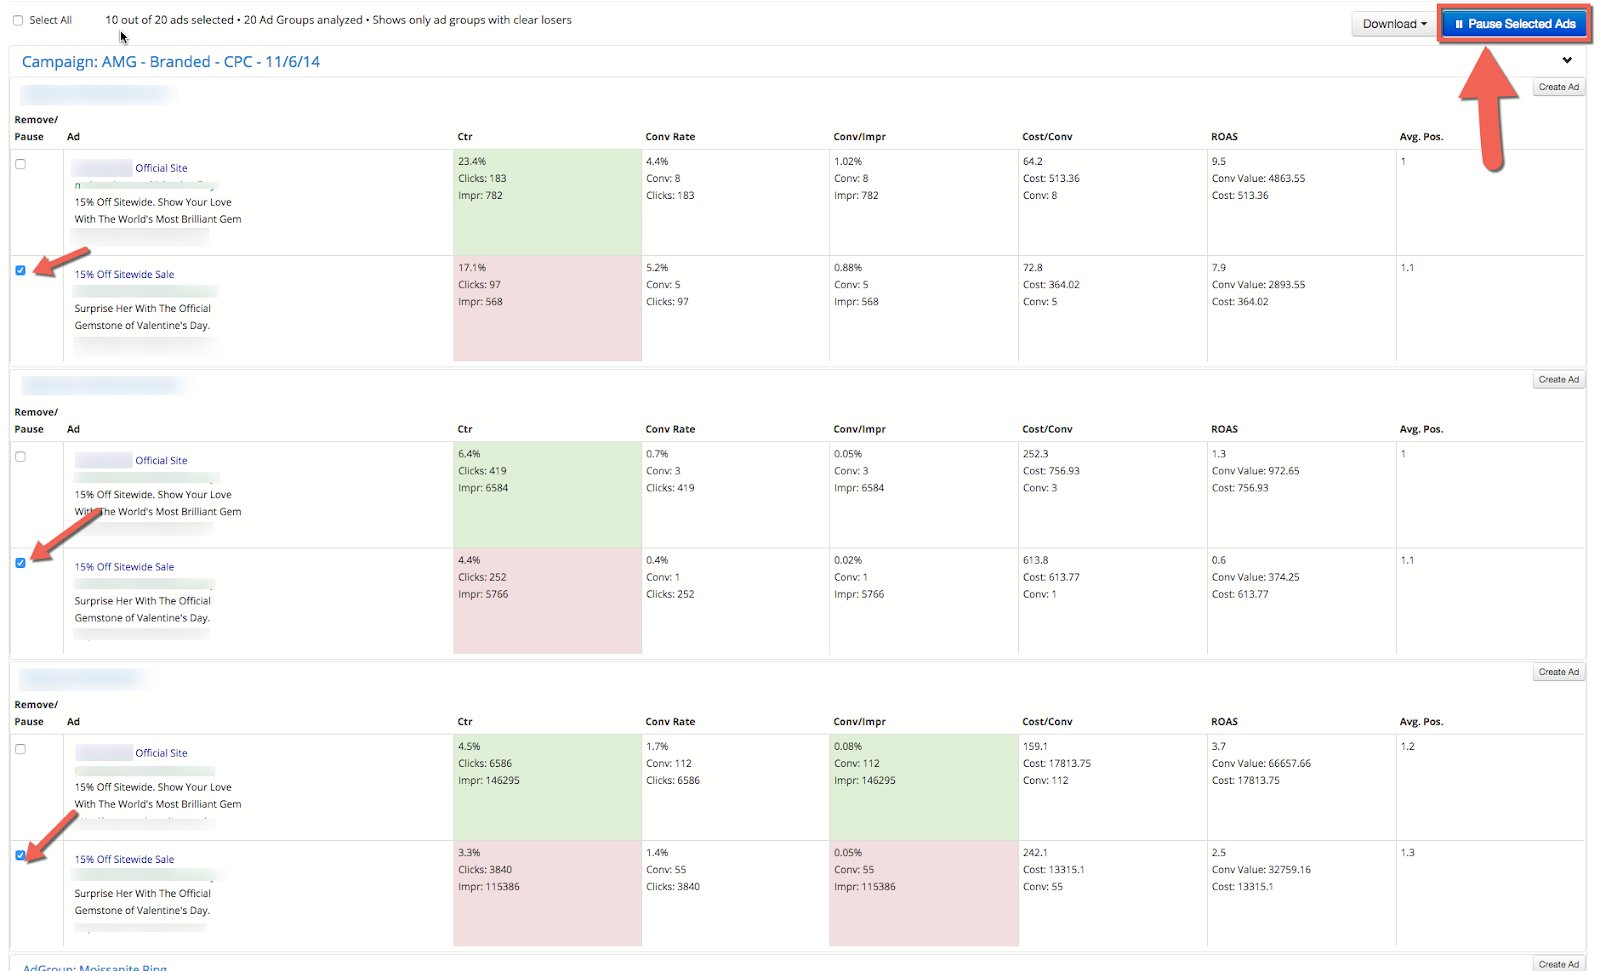
By default, Optmyzr selects all the losing ads across all the ad groups and A/B tests that had statistically significant results within your defined parameters.
If you’re satisfied with the results, you can click the blue “Pause Selected Ads” button in the upper right hand corner and the losing ads will be paused inside your live AdWords account. Seriously, how cool is that?
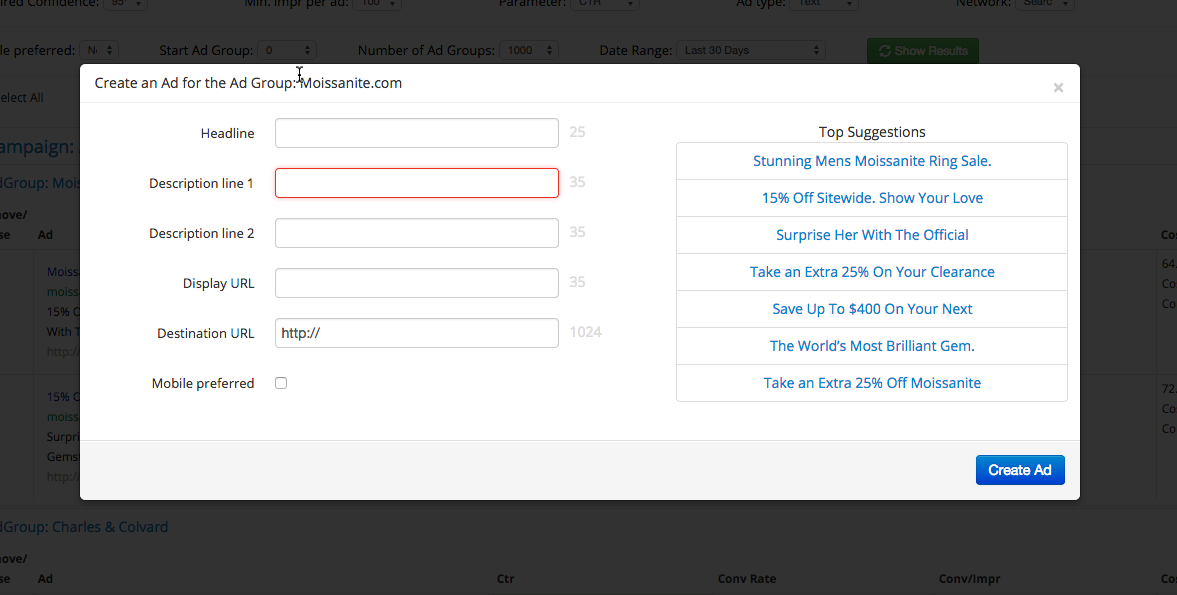
But now that you’ve paused one of the ads, you want to write a new ad in its place so you could run another A/B test. Optmyzr has another incredibly useful tool that allows you to do just that without leaving the dashboard.
By clicking the “Create Ad” button in the upper right hand corner of an ad group’s section, Optmyzr presents you with a dialogue box that will allow you write a new ad and publish it live in the ad group you selected. Even cooler, Optmyzr gives you suggestions for each element of the text ad based on results from historical data and previous A/B tests run in the account.
As you can see, OPTMYZR offers a completely thorough solution to do A/B split testing in an easy, aesthetically simple and intuitive way.
The best way to get a sense of how it works is to just go in there and mess around with the different parameters. Once you get the hang of it, running what would otherwise have been complex analysis will take you a couple minutes.
Conclusion
A/B split testing ad copy gets overlooked even though it’s one of the most reliable and effective forms of optimization. Because of its inherent complexities and ambiguities, we sort of just gloss over it picking and choosing winning ad copy based more on our intuition than on statistically sound results.
Optmyzr’s A/B split testing tool really changes that for a lot of people by simplifying a complex task and making it incredibly easy and hassle-free to perform regularly and effectively.
Even though we rely heavily on statistical evidence with A/B tests, it’s crucial to express your creative voice and use your intuitive sense to determine what, where and how to test. By combining your unique personality and some good statistical analysis, you’ll be A/B testing like a pro.
Again, it’s easy to get complacent in a certain holding pattern with A/B tests, so remind yourself once every couple months (or weeks) to go back to the drawing board and test some new “concept” ads.
If you have any interesting data on A/B tests you’ve run in the past, I’d love to hear about them. Of course, any comments or questions are more than welcome (leave them below), and I’ll be sure to get back to you.
If you’ve made it all the way down here, I really appreciate you taking the time to read this post. Looking forward to next time …
Happy Testing!
Learn more about how I manage AdWords accounts at Adventure PPC.


