Understand what changed, why it changed, and what to do next.
When performance shifts, Optmyzr helps you uncover the root cause fast. Analyze cross-platform results, drill down to ad-level data, and surface actionable insights without jumping between Meta and LinkedIn interfaces.
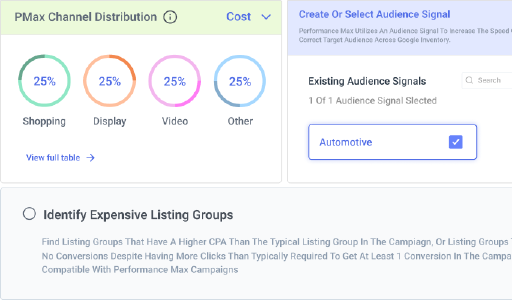

Analysis Capabilities for Meta and LinkedIn Ads
Break down performance by platform and ad placements.
Use Optmyzr’s analysis tools to filter and compare results across campaigns and creative types in Meta and LinkedIn. See what’s working and where performance is slipping based on actual campaign data.
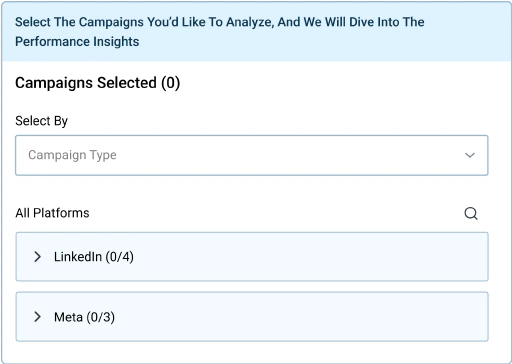
Understand who your ads resonate with most.
Analyze how key audience groups like job titles, interests, locations, and industries are performing across platforms. Optmyzr surfaces these breakdowns in one dashboard, helping you refine targeting strategies faster than you could in Meta or LinkedIn alone.
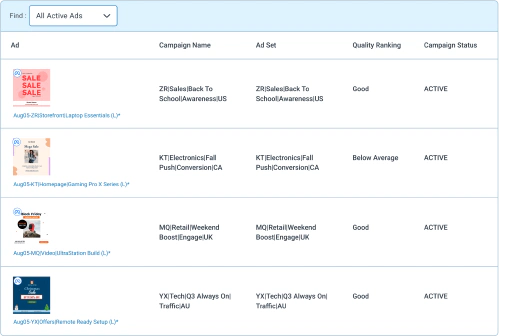
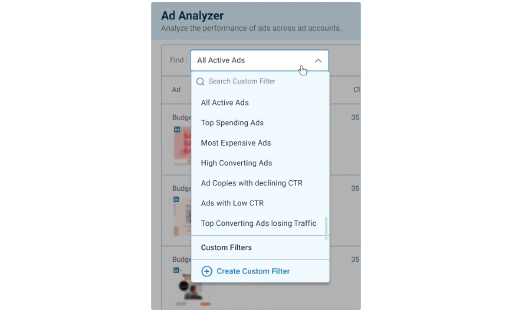
Track ad performance across Meta and LinkedIn without platform hopping.
View individual ad results from every connected account in one place. Spot underperformers, identify trends, and take action faster. No more digging through multiple UIs or switching tabs.

Take back control of your PPC destiny.
Try Optmyzr for 14 days. No credit card required.
